Biology › Practicals › Required practical 11: glucose concentration by colorimetry
Required practical 11: glucose concentration by colorimetry
Benedict's test says whether a reducing sugar is there. To say how much, make a set of glucose solutions of known concentration, test each in exactly the same way, and measure the blue that is left with a colorimeter. The readings make a calibration curve, and an unknown treated the same way is read off it.
The capability this develops
This guide is one investigation under capability P04: Colorimetry, dilution series and calibration curves, which sets out the techniques the investigation belongs to, the calculations it carries and the errors that cost marks in all of them. The notes behind the biology are in Biological molecules, water and inorganic ions.
Where this sits on the specifications
This library maps a qualification to its own specification one numbered heading at a time, against a document whose sha256 is recorded, and publishes the result as a route map. These are the headings whose practical work this investigation serves, on three of the five qualifications mapped so far. Each links to the route map the row belongs to.
| Qualification | Heading |
|---|---|
| OCR H020/H420 | 2.1.2 Biological molecules |
| Cambridge International 9700 | 2.1 Testing for biological molecules |
| Pearson Edexcel Biology A (Salters-Nuffield) 8BN0/9BN0 | 1.12 Mono-, di- and polysaccharides and energy |
Some boards number their practical activities, and those lists were read here from the same specifications as the headings above. This investigation is numbered on them as:
The other qualifications above are matched by specification heading only, because none of them numbers an activity that is this investigation. Use your awarding organisation’s current specification and its practical handbook as the authority on which activities your course requires and how they are assessed.
The principle
Benedict's solution contains copper(II) ions in alkaline solution, and it is blue because of them. A reducing sugar reduces those copper(II) ions to copper(I), which comes out of solution as a brick-red precipitate of copper(I) oxide.
The colorimeter method measures the unreacted reagent. After heating, filter off the copper(I) oxide precipitate and measure the absorbance of the filtrate with a red filter. The more reducing sugar there was, the more copper(II) was reduced, so the less blue remains and the lower the reading.
A red filter is used because a blue solution absorbs red light. The reading falls as the glucose concentration rises, so the curve slopes downwards, and it is valid only across the range of the standards that made it.
- Calibration curve
- A graph of a measured reading against known concentrations, from which the concentration of an unknown is read.
- Reducing sugar
- A sugar that can donate electrons to copper(II) ions in Benedict's solution, including every monosaccharide, maltose and lactose.
- Serial dilution
- A series of dilutions in which each solution is made from the one before it by the same factor.
Apparatus
- Glucose solution, 1.0% (1.0 g in 100 cm³), and distilled water
- An unknown sample: an artificial urine made up by the technician
- Benedict's solution
- Graduated pipettes or syringes for 1 cm³, 5 cm³ and 10 cm³, and test tubes in a rack
- A water bath at 80 °C or above, and a test tube holder
- Filter funnels and filter paper, or a centrifuge
- A colorimeter with a red filter, and cuvettes
- Eye protection
Safety
Work to your school’s risk assessment. Benedict's solution contains copper(II) sulfate, so check its CLEAPSS Hazcard and wear eye protection throughout. The water bath is near boiling and scalds: lift tubes with a holder, point the open end away from people, and keep cables and plugs clear of the water. Use a pipette filler or syringe for every volume, and wipe the outside of each cuvette before it goes into the colorimeter.
Variables
Independent variable
The glucose concentration of each standard: 0.0, 0.2, 0.4, 0.6, 0.8 and 1.0 g per 100 cm³.
Dependent variable
The absorbance of the filtrate after heating, read through a red filter, which falls as glucose concentration rises.
Control variables
- The volumes. 1 cm³ of standard or unknown and 5 cm³ of Benedict's solution in every tube.
- Benedict's solution in excess. Enough copper(II) that the strongest standard does not use it all.
- The heating. The same water bath temperature and the same 5 minutes for every tube, unknown included.
- The filtering. Every precipitate removed the same way before reading.
- The colorimeter. One filter, zeroed on the same blank, for every reading.
Method
Making the standards
- Make up a set of glucose solutions of known concentration, treat every tube identically, and use them to calibrate the method.
- For 10 cm³ of each, mix 0, 2, 4, 6, 8 and 10 cm³ of the 1.0% glucose with 10, 8, 6, 4, 2 and 0 cm³ of distilled water. That gives 0.0, 0.2, 0.4, 0.6, 0.8 and 1.0 g per 100 cm³.
Heating with Benedict's solution
- Put 1 cm³ of each standard into its own labelled tube, and 1 cm³ of the unknown into another, then add 5 cm³ of Benedict's solution to every tube.
- Stand all the tubes in the water bath at 80 °C or above for exactly 5 minutes, then cool them in cold water.
- Benedict's solution must be in excess as well, or the tubes with the most sugar all run out of copper(II) ions and give the same reading as each other.
Describe the drawing
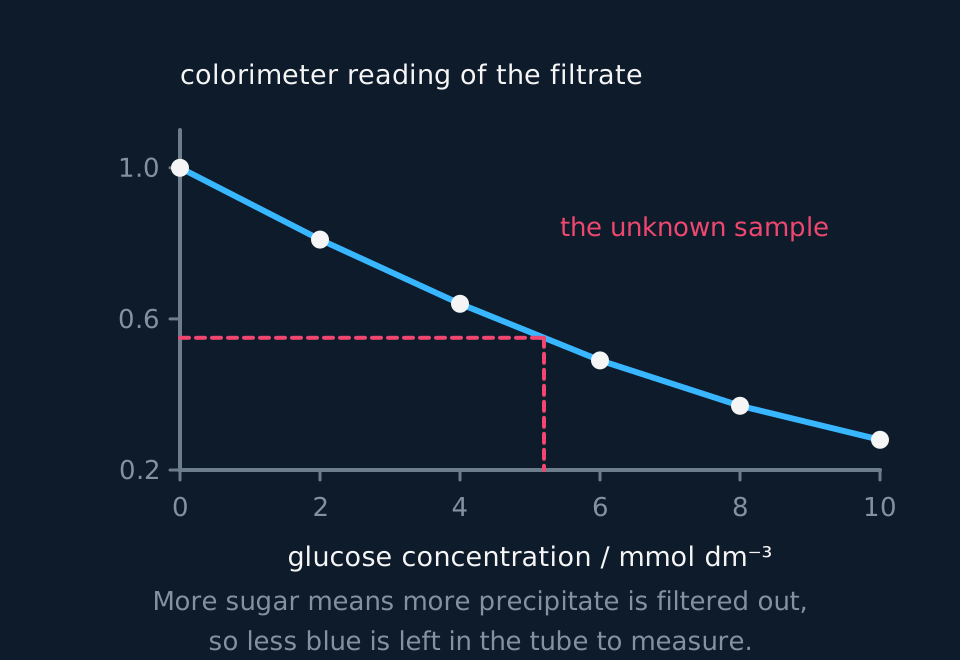
A line graph falling from left to right. Glucose concentration in millimoles per cubic decimetre runs along the horizontal axis from zero to ten, and the colorimeter reading of the filtered solution runs up the vertical axis from 0.2 to 1.0. Six plotted points, one for each known standard, lie on a smooth curve that starts at a reading of 1.0 with no sugar and falls to 0.28 at the strongest standard. Two dashed lines show an unknown sample being read off: across from a reading of 0.55 to the curve, then down to a concentration of about five.
Reading the filtrates
- Filter each tube, or spin it in a centrifuge, so that no precipitate is left in the liquid.
- Zero the colorimeter on distilled water with the red filter in place, then read the absorbance of each filtrate, the unknown last.
- Plot reading against known concentration to get a calibration curve, treat the unknown the same way, and read its concentration off the curve.
Sample data
These readings are idealised. They were computed from a model of the relationship so that the curve can be read without scatter in the way, and each stands for the mean of three tubes. Nothing here is a record of an experiment.
| Glucose / g per 100 cm³ | Absorbance of the filtrate |
|---|---|
| 0.0 | 0.95 |
| 0.2 | 0.78 |
| 0.4 | 0.61 |
| 0.6 | 0.45 |
| 0.8 | 0.31 |
| 1.0 | 0.20 |
| Unknown | 0.52 |
The unknown read 0.52, between the 0.4 standard at 0.61 and the 0.6 standard at 0.45. Read off the curve, that is about 0.51 g per 100 cm³.
The same answer by proportion between the two standards: the unknown is 0.61 − 0.52 = 0.09 of the 0.61 − 0.45 = 0.16 drop, and 0.09 ÷ 0.16 = 0.56 of the way from 0.4 to 0.6. 0.4 + 0.56 × 0.2 = 0.51 g per 100 cm³.
The 0.0 standard, with no glucose, reads 0.95. That is the blue of Benedict's solution with nothing reduced, and it is the top of the curve.
Reading the graph
Plot absorbance on the vertical axis against glucose concentration on the horizontal axis, for the standards only, and draw a smooth curve through them. Do not plot the unknown as a point: it is read from the curve, not added to it.
Reading the unknown. Draw a horizontal line from 0.52 on the absorbance axis to the curve, then a vertical line down to the concentration axis, and read about 0.51 g per 100 cm³.
The shape. The curve falls more steeply at low concentrations than at high ones: from 0.0 to 0.2 the absorbance drops by 0.17, from 0.8 to 1.0 by 0.11. So a reading near the top of the range pins down a concentration less precisely than one near the bottom.
Inside the range only. An unknown reading below 0.20 is more concentrated than the strongest standard and cannot be read off the curve. Dilute it by a known factor, read it again, and multiply the answer back up.
What it measures. Benedict's solution responds to every reducing sugar, not to glucose alone. The answer is a glucose concentration only if glucose is the only reducing sugar in the sample.
Evaluation
Each of these is a real source of error in this investigation, and the middle column is the part an answer earns marks for: what it does to the result, and in which direction.
| Source of error | What it does to the result | What to do about it |
|---|---|---|
| Precipitate left in the filtrate | Particles of copper(I) oxide scatter the light, so the reading is higher than the blue alone would give, and the concentration read off comes out too low. | Filter twice, or spin in a centrifuge and read the clear liquid above the pellet. |
| Benedict's solution not in excess | The strongest standards run out of copper(II) and give the same reading, so the curve flattens at the top and any unknown in that region cannot be read. | Use more Benedict's solution per tube, or dilute the samples, and check that the strongest standard still leaves some blue. |
| Heating times that differ | A tube heated longer has reduced more copper(II), so its reading is lower for a reason that is not its glucose concentration. | Put every tube in the bath together, unknown included, and take them all out together after 5 minutes. |
| The colorimeter drifting during the session | If the zero moves, every reading after it moves by about the same amount, so standards read early and an unknown read late are no longer on the same scale. | Re-zero on distilled water before each reading, and read the standards and the unknown in one sitting. |
| Standards made inaccurately | An error in a standard moves its point and bends the curve, and every unknown read from that part of the curve carries the same error. | Measure every volume with a pipette or syringe, not a measuring cylinder, and make each standard directly from the stock rather than from the one before. |
| Too few standards near the unknown | The curve between two standards is drawn, not measured, so the reading there carries the uncertainty of the drawing. | Once the unknown is roughly placed, make extra standards at 0.45, 0.50 and 0.55 g per 100 cm³ and read it again. |
Questions
Question 1 (2 marks)
Explain why the precipitate is removed before the absorbance is read.
Check your answer
the method measures the blue copper(II) left in solution;
the precipitate would block or scatter light and make the absorbance too high.
Question 2 (2 marks)
Explain why a red filter is used.
Check your answer
the filtrate is blue, so it absorbs red light (red is the complementary colour);
so the absorbance changes most with the amount of copper(II) left, which makes the reading most sensitive.
Question 3 (3 marks)
Explain why the absorbance falls as the glucose concentration rises.
Check your answer
glucose is a reducing sugar, so it reduces copper(II) ions to copper(I);
the more glucose, the more copper(II) is reduced and removed as copper(I) oxide precipitate;
so less blue copper(II) is left in the filtrate, which absorbs less light.
Question 4 (2 marks)
An unknown sample gave an absorbance of 0.15. Explain why its concentration cannot be read from this curve, and what should be done.
Check your answer
0.15 is below the reading of the strongest standard, 0.20, so it is outside the range of the calibration curve;
dilute the sample by a known factor, test it again and multiply the concentration read off by the dilution factor.
Question 5 (3 marks)
Give two variables that must be the same for the standards and the unknown, and explain why.
Check your answer
the volume (and concentration) of Benedict's solution;
the time and temperature of heating (accept: the volume of sample);
otherwise the calibration curve would not apply to the unknown.
Coverage maps are available for AQA 7401/7402, OCR Biology A H020/H420, Cambridge International 9700, Pearson Edexcel Biology A (Salters-Nuffield) 8BN0/9BN0 and Pearson Edexcel Biology B 8BI0/9BI0. Use the relevant route map to check what InkBiology covers, and your awarding organisation’s current specification as the final authority on examinable content.