Biology › Practicals › Required practical 3: water potential of potato tissue
Required practical 3: water potential of potato tissue
You cannot put a probe into a potato cell and read its water potential. What you can do is soak identical cylinders of potato in a series of sucrose solutions and weigh them before and after. Where a cylinder neither gains nor loses mass, the solution has the same water potential as the cells, and the solution's water potential is known.
The capability this develops
This guide is one investigation under capability P07: Water relations of plant tissue: osmosis and transpiration, which sets out the techniques the investigation belongs to, the calculations it carries and the errors that cost marks in all of them. The notes behind the biology are in Membranes and transport across cells.
Where this sits on the specifications
This library maps a qualification to its own specification one numbered heading at a time, against a document whose sha256 is recorded, and publishes the result as a route map. These are the headings whose practical work this investigation serves, on four of the five qualifications mapped so far. Each links to the route map the row belongs to.
| Qualification | Heading |
|---|---|
| OCR H020/H420 | 2.1.5 Biological membranes |
| Cambridge International 9700 | 4.2 Movement into and out of cells |
| Pearson Edexcel Biology A (Salters-Nuffield) 8BN0/9BN0 | 2.3 Osmosis as the movement of free water molecules |
| Pearson Edexcel Biology B 8BI0/9BI0 | 4.2 iv Cell transport mechanisms |
Some boards number their practical activities, and those lists were read here from the same specifications as the headings above. This investigation is numbered on them as:
- AQA 7401/7402 required practical 3
- OCR Biology A H020/H420 PAG 8
- Pearson Edexcel Biology B 8BI0/9BI0 core practical 6
The other qualifications above are matched by specification heading only, because none of them numbers an activity that is this investigation. Use your awarding organisation’s current specification and its practical handbook as the authority on which activities your course requires and how they are assessed.
The principle
A cell's water potential cannot be measured directly. The investigation uses a dilution series to identify the external solution that produces no net movement of water, since that solution has the same water potential as the cells.
Water moves by osmosis from a higher water potential to a lower one, across the partially permeable membranes of the cells. In a solution of higher water potential than the cells, a cylinder takes up water and gains mass. In one of lower water potential it loses water and mass. Pure water at atmospheric pressure has a water potential of zero, and every solution has a negative one, more negative the more concentrated it is.
The reading is the concentration at which the change is zero, found from a line through all the points, and it is converted to a water potential with a table of values for sucrose. The cylinders are compared by percentage change in mass, because they cannot all start at exactly the same mass.
- Water potential, ψ
- The tendency of water to move out of a system, in kPa. Pure water at atmospheric pressure is 0 kPa, and water moves from higher to lower ψ.
- Dilution series
- A set of solutions made from one stock, each a known fraction of its concentration.
- Incipient plasmolysis
- The point at which the pressure potential of a plant cell has just fallen to zero, so its water potential equals its solute potential.
Apparatus
- Sucrose solution, 1.0 mol dm⁻³, and distilled water
- Graduated pipettes or syringes, 10 cm³, and six labelled boiling tubes with bungs or film
- A large potato, a cork borer, a white tile and a scalpel
- A ruler to trim the cylinders to one length
- Paper towels for blotting
- A balance reading to 0.01 g
- A stopwatch or clock
Safety
Work to your school’s risk assessment. Push the cork borer into potato resting on a tile with a twisting motion, never into potato held in the hand, and cut with the scalpel moving away from your fingers. Blades go in the sharps container. Sucrose solution is low hazard, but a spill on the floor is slippery, so wipe it up at once.
Variables
Independent variable
The concentration of the sucrose solution, set by mixing measured volumes of a 1.0 mol dm⁻³ stock with distilled water: 0.0, 0.2, 0.4, 0.6, 0.8 and 1.0 mol dm⁻³.
Dependent variable
The percentage change in mass of each cylinder, (final mass − initial mass) ÷ initial mass × 100, positive for a gain and negative for a loss.
Control variables
- The size of the cylinders. One cork borer and one trimmed length, so every cylinder has the same surface area for water to cross.
- The source of the tissue. Every cylinder from one potato, because potatoes differ in water potential.
- The volume of solution. 20 cm³ in every tube, enough to cover the cylinder completely.
- The time in solution. The same for every cylinder, and long enough for the mass to stop changing.
- The blotting. Done the same way before both weighings, so the mass of surface water is the same each time.
- Temperature. All tubes at room temperature, in one rack.
Method
Making the dilution series
- Make sucrose solutions from a 1.0 mol dm⁻³ stock. A standard set is 0.8, 0.6, 0.4, 0.2 and 0.0 mol dm⁻³, each made by mixing a measured volume of stock with a measured volume of distilled water.
- For 20 cm³ of each, mix 4, 8, 12 and 16 cm³ of stock with 16, 12, 8 and 4 cm³ of water for 0.2, 0.4, 0.6 and 0.8 mol dm⁻³. Use 20 cm³ of water alone for 0.0, and 20 cm³ of stock alone for a sixth tube at 1.0 mol dm⁻³.
- Label the tubes and stand them in one rack.
Preparing and weighing the cylinders
- Cut cylinders of potato with a cork borer, trim them to the same length, blot them dry and record the mass of each.
- Take every cylinder from the same potato, remove any skin, and trim each to 30 mm against the ruler. Blot by rolling the cylinder once across a paper towel, the same way every time.
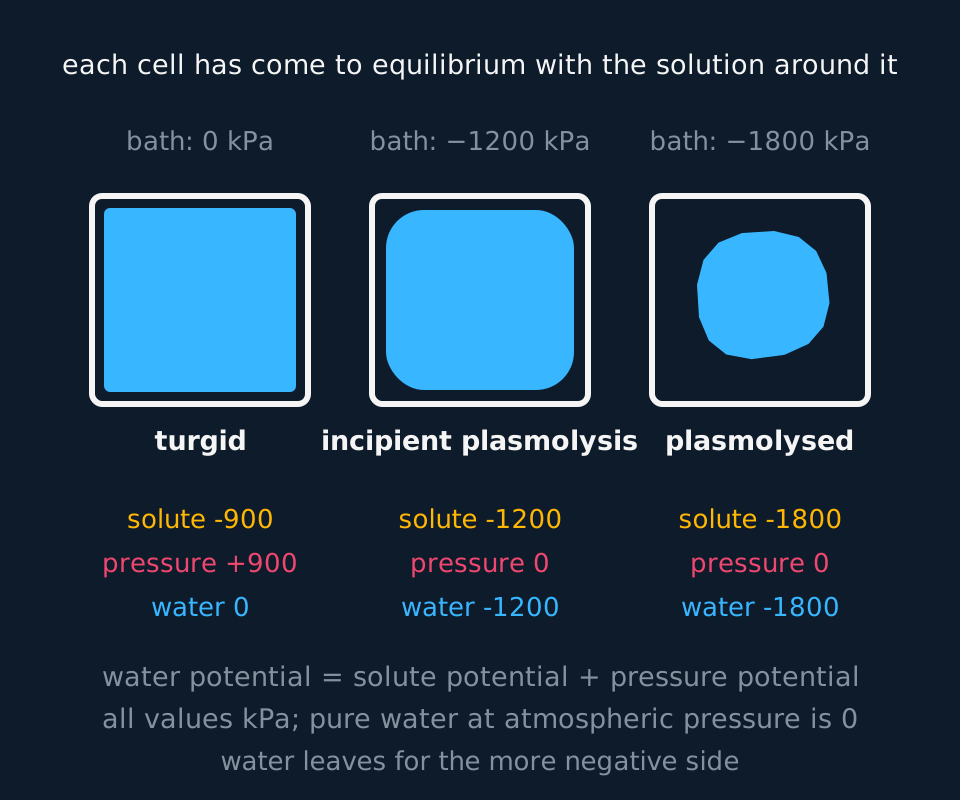
Describe the drawing
Three plant cells drawn side by side, each as a rigid rectangular wall with the living contents shaded inside it. The left cell is pressed hard against its wall and labelled turgid, the middle cell just fills the wall with no push left, and the right cell has shrunk into a rounded blob well clear of its wall. Under each cell three numbers in kilopascals give the solute potential, the pressure potential and their sum, which matches the bathing solution above.
Soaking and reweighing
- Leave one cylinder in each solution for a fixed time, then blot and reweigh.
- Cover each tube, and leave the cylinders for at least an hour, the same time for every tube. Lift each out with forceps, blot it exactly as before and weigh it.
- Repeat with two more sets of cylinders, so that each concentration has three results and a mean.
- Work in percentage change in mass, not raw change. The cylinders start at slightly different masses, and a percentage removes that difference: percentage change = (change in mass ÷ initial mass) × 100.
Sample data
These readings are idealised. They were computed from a model of the relationship, so that the analysis can be worked without scatter in the way, and each row stands for one cylinder where a real table would show the mean of three. Nothing here is a record of an experiment.
| Sucrose / mol dm⁻³ | Initial mass / g | Final mass / g | Change in mass / g | Percentage change in mass / % |
|---|---|---|---|---|
| 0.0 | 2.50 | 2.81 | +0.31 | +12.4 |
| 0.2 | 2.50 | 2.60 | +0.10 | +4.0 |
| 0.4 | 2.50 | 2.40 | −0.10 | −4.0 |
| 0.6 | 2.40 | 2.16 | −0.24 | −10.0 |
| 0.8 | 2.60 | 2.23 | −0.37 | −14.2 |
| 1.0 | 2.50 | 2.08 | −0.42 | −16.8 |
Take the fourth row. The change is 2.16 − 2.40 = −0.24 g, and the percentage change is −0.24 ÷ 2.40 × 100 = −10.0%. The fifth row lost more grams than the fourth from a larger cylinder, so the raw changes alone would not compare them fairly.
Between 0.2 and 0.4 mol dm⁻³ the percentage change goes from +4.0% to −4.0%, so the line crosses zero halfway between them, at 0.30 mol dm⁻³. A line of best fit through the points near the crossing gives the same reading.
For sucrose, 0.1 mol dm⁻³ is about −260 kPa, 0.2 is −540, 0.3 is −820, 0.4 is −1120 and 0.5 is −1450.
So the water potential of this potato tissue is about −820 kPa.
Reading the graph
Plot the percentage change in mass on the vertical axis against sucrose concentration on the horizontal axis. The vertical axis runs through zero, with gains above and losses below, and the horizontal axis is drawn at zero change, because that is the line the reading is taken from.
Where the line crosses zero, the cylinder neither gained nor lost water, so that solution's water potential equals the potato's.
Above the crossing. At 0.0 and 0.2 mol dm⁻³ the solution has a higher water potential than the cells, less negative, so water entered by osmosis and the cylinders gained mass. The cell walls stop the cells bursting.
Below it. From 0.4 mol dm⁻³ upwards the solution's water potential is lower than the cells', so water left and the cylinders lost mass. The loss grows more slowly at the highest concentrations, from −14.2% to −16.8% over the last step, because the cells are already plasmolysed and have less water left to lose. Draw a curve through the points, not a straight line, and take the reading where the curve is steepest and best defined, near zero.
The reading is a concentration first. It is converted to a water potential afterwards, from the sucrose table, and the answer is negative. Quote it as about −820 kPa, not to more figures than a reading from a graph supports.
Evaluation
Each of these is a real source of error in this investigation, and the middle column is the part an answer earns marks for: what it does to the result, and in which direction.
| Source of error | What it does to the result | What to do about it |
|---|---|---|
| Blotting that differs between weighings | Surface water left on a cylinder is weighed as if the tissue had taken it up. It makes gains too large and losses too small, and it can move the crossing point by itself. | Blot every cylinder the same way, one roll across a paper towel, and have one person do all of it. |
| Evaporation from open tubes | Water leaves the solutions, which become more concentrated, and the cylinders lose water as they wait to be weighed. Every change shifts towards a loss, so the crossing moves to a lower concentration and the water potential reads too high. | Cover the tubes, and weigh each cylinder as soon as it is blotted. |
| Too short a soak | The cylinders have not finished gaining or losing water, so every change is smaller than it would become. The crossing is less affected, since a solution of equal water potential gives no net movement however long it is left, but the line is flatter and the crossing is harder to place. | Leave the cylinders until the mass stops changing, which a trial run with weighings every 20 minutes will show. |
| Cylinders of different sizes | A cylinder with more surface area exchanges water faster, so in a fixed time it changes mass by a larger percentage for a reason that is not the solution. | One cork borer and one trimmed length for every cylinder. |
| One cylinder per concentration | There is no measure of spread, so a single unlucky cylinder cannot be told from a real difference. | Three cylinders at each concentration, a mean, and the range beside it. |
| A balance reading to 0.01 g | Each weighing is uncertain by ±0.01 g, so a change of 0.10 g is uncertain by ±0.02 g, which is ±20% of it. The points nearest the crossing, which matter most, have the smallest changes and so the largest percentage uncertainty. | Use longer cylinders, or several cylinders weighed together in each tube, so the changes near the crossing are larger. |
Questions
Question 1 (2 marks)
Explain why the results are recorded as percentage change in mass rather than change in mass.
Check your answer
the cylinders start with different masses;
a percentage change allows them to be compared, since a larger cylinder gains or loses more grams in the same solution.
Question 2 (2 marks)
A cylinder had an initial mass of 2.40 g and a final mass of 2.16 g. Calculate the percentage change in mass.
Check your answer
change = 2.16 − 2.40 = −0.24 g;
percentage change = −0.24 ÷ 2.40 × 100 = −10% (accept −10.0%).
Question 3 (3 marks)
The percentage change in mass was zero at 0.30 mol dm⁻³ sucrose. Explain what this shows about the potato cells, and give their water potential, using 0.3 mol dm⁻³ sucrose = −820 kPa.
Check your answer
there was no net movement of water into or out of the cylinder;
so the solution and the cells had the same water potential;
the water potential of the cells is about −820 kPa.
Question 4 (3 marks)
Explain why the cylinder in distilled water gained mass.
Check your answer
distilled water has a water potential of 0 kPa, higher than that of the potato cells;
water moved into the cells by osmosis;
through the partially permeable cell-surface membranes (the wall stops the cells bursting).
Question 5 (3 marks)
A student did not blot the cylinders after removing them from the solutions. Explain the effect on the water potential found.
Check your answer
surface water is weighed with the cylinders, so every final mass is too high;
every change is shifted towards a gain, so the line crosses zero at a higher concentration;
the water potential found is too low (more negative).
Coverage maps are available for AQA 7401/7402, OCR Biology A H020/H420, Cambridge International 9700, Pearson Edexcel Biology A (Salters-Nuffield) 8BN0/9BN0 and Pearson Edexcel Biology B 8BI0/9BI0. Use the relevant route map to check what InkBiology covers, and your awarding organisation’s current specification as the final authority on examinable content.