Physics › Astrophysics › The HR diagram and the life of Sun-like stars
The HR diagram and the life of Sun-like stars
The Hertzsprung-Russell diagram plots luminosity, or absolute magnitude, against surface temperature, hot on the left and cool on the right. Stars gather into the main sequence, the giants and supergiants above it and the white dwarfs below. A Sun-like star's life is a path from the main sequence through red giant and planetary nebula to a white dwarf.
Choose your exam board to show the notes and questions relevant to your specification. You can change this setting at any time, and content for other boards remains available.
The HR diagram and stellar evolution, part 1 of 2. Part 2 is Supernovae, neutron stars and black holes.
Builds on Black-body radiation and spectral classes and Fission and fusion.
IN THIS TOPIC
- Sketch the HR diagram with temperature running hot-left to cool-right, the vertical axis read as luminosity increasing upward or as the reversed absolute-magnitude scale, and label the main sequence, red giants, supergiants and white dwarfs.
- Describe the evolution of a Sun-like star as a path across the diagram, through the red giant and planetary nebula stages to a white dwarf.
COMMON MISCONCEPTION
The Sun will end its life in a supernova.
The Sun is too light to go supernova: it will become a red giant, shed its outer layers, and end as a cooling white dwarf. Only far more massive stars explode.
One diagram, every star
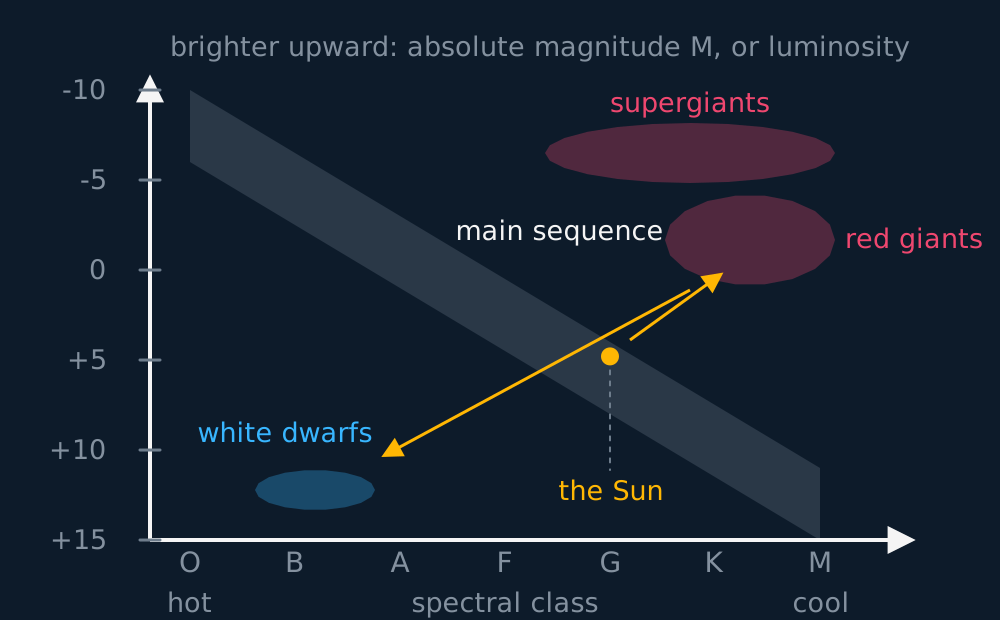
Take a large sample of stars, work out each one's absolute magnitude and temperature using the tools of the last two lessons, and plot one against the other. The result is the Hertzsprung-Russell diagram. Two axis conventions need keeping apart. The temperature axis runs backwards: from about 50 000 K on the left down to 2500 K on the right, so hotter is left, and it is often labelled by spectral class OBAFGKM instead. The vertical axis is only backwards when it carries absolute magnitude, whose scale is reversed: it runs from +15 at the bottom to −10 at the top, so brighter is still higher.
The vertical axis carries the star's own output, and the boards differ only in what they print on it. Some draw the same diagram with luminosity up the side, the total power radiated, given as a multiple of the Sun's and on a logarithmic scale from about 10−4 to 106, increasing upward like any ordinary log axis. That is not a different diagram. Absolute magnitude is itself a logarithmic measure of the same power, running the opposite way, which is exactly why the magnitude axis is drawn upside down: brighter is higher whichever label is printed. Read either as a luminosity against temperature plot and the picture is the same.
Describe the drawing
The Hertzsprung-Russell diagram: a grey diagonal main-sequence band from hot bright stars at top left to cool faint ones at bottom right, a red-giant region above it on the cool side, a wide flat band of supergiants stretched across the top at the highest luminosities with its red end at the cool side, a white-dwarf region below the main sequence on the hot side, the Sun marked partway down the band, and amber arrows tracing a Sun-like star's future from the main sequence to the giants and down to the white dwarfs.
Stars do not scatter randomly. Most crowd onto the main sequence, the diagonal band running from hot-and-bright down to cool-and-dim, and every star on it is fusing hydrogen in its core. The Sun sits partway down, class G, absolute magnitude +4.8. The red giants sit above and to the right, cool at the surface yet hugely luminous, which by Stefan's law forces them to be enormous.
The extremes sit further out again. Higher still, in a band stretched right across the top of the diagram, are the supergiants. The cool right-hand end of that band holds the red supergiants, the swollen late stage of a heavy star: tens of thousands of times the Sun's luminosity at a surface no hotter than a red giant's, which by the same argument makes them hundreds of times the Sun's radius. Betelgeuse is a red supergiant. Below and to the left are the white dwarfs, hot yet so faint they must be tiny: a white dwarf is roughly the size of the Earth.
Describe the drawing
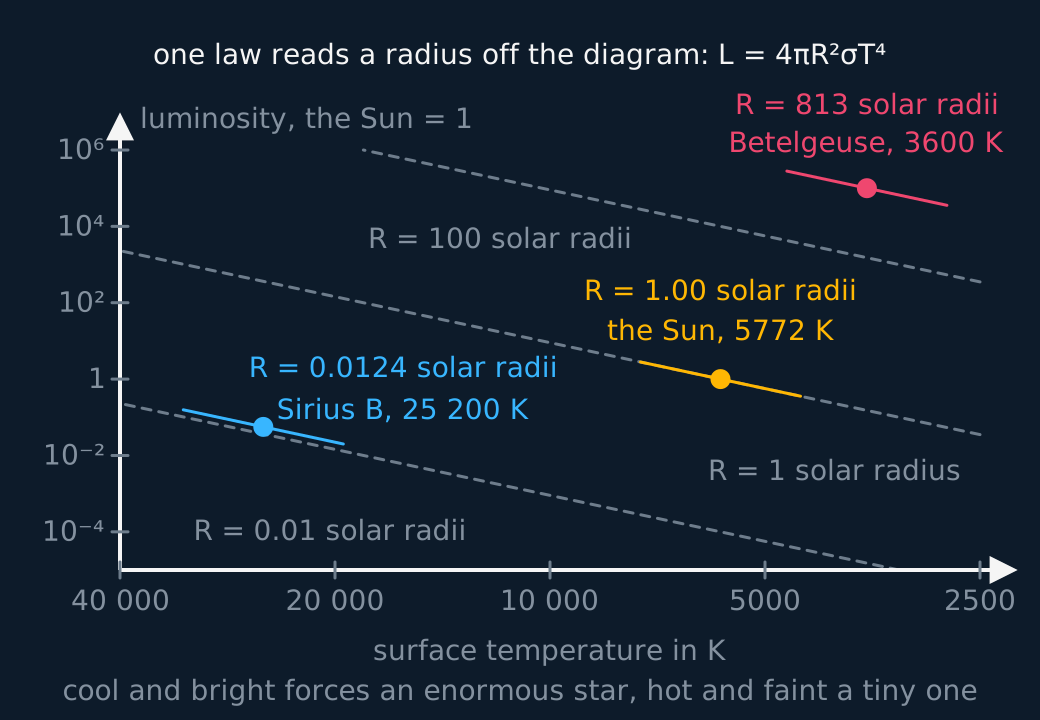
The HR diagram with luminosity in solar units up the side and surface temperature running hot to cool across it, carrying three dashed lines of constant radius a hundredfold apart, each straight because L goes as R squared times T to the fourth. The Sun sits exactly on the one solar radius line. Betelgeuse, cool at 3600 K but a hundred thousand times as luminous, sits far above the hundred solar radius line, and the radius computed beside it from its own luminosity and temperature is 813 solar radii. Sirius B, hot at 25 200 K but a twentieth as luminous as the Sun, sits down near the hundredth of a solar radius line at a computed 0.0124, about one and a third Earth radii. The sizes are not facts to memorise: Stefan's law reads them straight off the axes.
The life of a Sun-like star
Every star begins as a nebula, a cloud of gas and dust collapsing under its own gravity. The collapse heats the core, now a protostar, until hydrogen fusion lights. The star then settles where the outward push of radiation and gas pressure balances gravity, and that equilibrium is what the main sequence is.
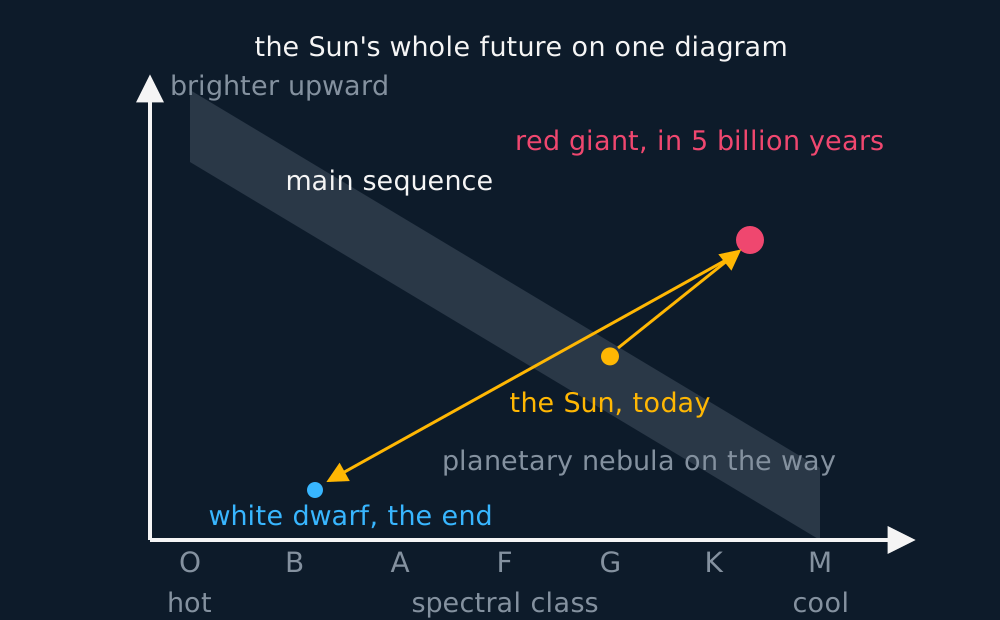
A star spends most of its life at one position on the main sequence, fusing core hydrogen. When the core hydrogen runs low, the balance breaks. The core contracts and heats, fusion moves outward into a shell, and the outer layers swell colossally while their surface cools towards red. On the diagram the star leaves the main sequence and climbs up and to the right, becoming a red giant. The Sun will do this in about five billion years, swelling past the orbits of Mercury and Venus.
A star of the Sun's modest mass cannot ignite much beyond helium. The bloated outer layers drift away as a glowing shell called a planetary nebula, lit by the hot core it has just uncovered. The name is a two-hundred-year-old misunderstanding, kept out of habit: in a small telescope those shells looked like the discs of planets, and there are no planets involved. What the shell leaves behind is the exposed core, a white dwarf, no longer fusing, roughly Earth-sized and doomed only to cool.
With fusion gone, what holds it up is electron degeneracy pressure, a quantum refusal of electrons to be squeezed into the same state. That support has a ceiling, the Chandrasekhar limit of about 1.4 solar masses, and a core heavier than that cannot end as a white dwarf. On the diagram the star drops down and to the left into the white dwarf region and fades. That is the Sun's whole future. Supernovae are reserved for far heavier stars.
Describe the drawing
HR axes with the grey main-sequence band running diagonally. The Sun sits on the band at class G. One amber arrow climbs up and to the right to a red giant marked for five billion years' time; a second crosses back down and to the left, past the note that the outer layers leave as a planetary nebula, to a white dwarf below the band on the hot side: cooler but brighter first, then hotter but dimmer for good.
OCR astronomical definitions
OCR opens its astrophysics with six terms and asks for each one defined by name. No other board examines the list, so read this section only if OCR A is your specification. The six climb in scale, and defining them in that order is the easiest way to keep them apart.
A planet is a body in orbit around a star, massive enough that its own gravity has pulled it into a nearly spherical shape and massive enough to have swept its orbital neighbourhood clear of other bodies. In visible light it shines chiefly by reflection, though like any warm body it also emits its own thermal radiation, mostly infrared; nothing fuses inside it. A planetary satellite is a body in orbit around a planet rather than around the star directly, which covers natural moons and the artificial satellites of the gravitational fields unit alike.
A comet is a small body of ice, dust and rock orbiting a star on a highly elliptical path. Far out it is inert. Close in, the Sun's heat drives the ice straight to vapour, and radiation pressure and the solar wind blow the released gas and dust into a tail that always points away from the Sun, whichever way the comet happens to be travelling.
A solar system is a star together with everything gravitationally bound to it, meaning its planets, their satellites, and the asteroids, comets and dust between them. Ours takes the capital letters. A galaxy is a gravitationally bound collection of stars, gas, dust and dark matter, anything from millions to hundreds of billions of stars, usually with a supermassive black hole at its centre. The universe is everything that exists: all matter and radiation, and the space and time they occupy. The ladder runs satellite, planet, solar system, galaxy, universe, with each rung contained in the one above it.
Supernovae and the standard candle has moved to the next part of this lesson.
Neutron stars and black holes has moved to the next part of this lesson.
ASSESSMENT FOCUS
- Label the axes first when sketching the HR diagram. Absolute magnitude +15 to −10 upward, or luminosity in solar units on a log scale, and temperature 50 000 K to 2500 K left to right, or OBAFGKM. Temperature runs backwards, and so does a magnitude scale; a luminosity axis climbs upward perfectly normally. Label whichever you draw, and if a paper gives you a luminosity axis, only the label changes: brighter is higher either way.
- Place the four populations and the Sun. Main sequence on the diagonal, red giants top right, supergiants in a band right across the top with the red supergiants at its cool end, white dwarfs bottom left, Sun on the main sequence at class G, about +4.8.
- The Sun-like evolution answer is a path, so describe it on the diagram. Main sequence, then up and right to red giant as shells fuse and the surface cools, then the outer layers off as a planetary nebula, then down and left to white dwarf.
- OCR asks for the six terms as definitions, so give each one its distinguishing clause rather than an example. Orbits a star and has cleared its orbit for a planet, orbits a planet for a planetary satellite, ice on a highly elliptical orbit with a tail pointing away from the Sun for a comet, a star plus everything bound to it for a solar system, and gravitationally bound stars, gas and dust for a galaxy. No other board sets this list.
CHECK YOURSELF
Describe the future of the Sun as a track on the HR diagram, naming each stage, and explain in one sentence why the Sun will not become a supernova.
Show a hint
Three stages on the diagram, then mass for the final sentence.
Show the answer
The Sun sits on the main sequence now. When core hydrogen runs low it swells and cools, moving up and to the right as a red giant. After shedding its outer layers the remnant drops down and left as a white dwarf, then cools and fades.
It will not go supernova, because its mass is far below what core collapse requires, so a white dwarf is the endpoint.
The HR diagram maps brightness against temperature, hot on the left; only a magnitude scale runs backwards.
Sun-like stars end as white dwarfs, held up by electron degeneracy pressure below 1.4 solar masses.
WORKBOOK
Printable practice for this topic: original exam-style questions with room to work, and a fully worked answer book. Free to use; please do not redistribute or sell.
Or read them with their mark schemes on the HR diagram and the life of Sun-like stars questions page.
CHECK YOUR PROGRESS
Rate how confident you feel with each objective for this lesson. Ratings are saved in this browser, on this device, unless you sign in.
- Sketch the HR diagram with temperature running hot-left to cool-right, the vertical axis read as luminosity increasing upward or as the reversed absolute-magnitude scale, and label the main sequence, red giants, supergiants and white dwarfs.
- Describe the evolution of a Sun-like star as a path across the diagram, through the red giant and planetary nebula stages to a white dwarf.
Open the full revision checklist to track your progress across the whole unit.