Biology › Animal transport and cardiovascular biology › The heart and cardiac cycle
The heart and cardiac cycle
The cardiac cycle is the sequence of atrial and ventricular contraction and relaxation. Changes in pressure open and close the atrioventricular and semilunar valves, producing one-way blood flow and the characteristic heart sounds. Pressure-time graphs show these changes through one heartbeat.
Before this Surface area to volume ratio and diffusion distance · Muscle as a tissue that shortens when stimulated
COMMON MISCONCEPTION
Valves open and close because muscle pulls them open and shut.
No muscle opens or shuts a valve. The papillary muscles only keep the tendinous cords taut so the AV flaps cannot turn inside out. A valve moves when the blood on one side pushes harder than the blood on the other, so every valve movement follows a pressure difference.
What you should be able to do
- Explain why a large, active animal needs a mass transport system when a flatworm does not.
- Say what double circulation gives a mammal that single circulation cannot.
- Label the mammalian heart and account for the thickness of the left ventricle wall in terms of the pressure it generates.
- Describe the three stages of the cardiac cycle, giving the pressure change responsible for every valve movement.
- Read a pressure-against-time graph: identify each curve and mark where each valve opens and shuts.
- Calculate cardiac output, stroke volume or heart rate from the other two.
- Trace an impulse from the SAN to the ventricle walls and explain why the delay at the AVN matters.
- Say what an electrocardiogram measures, and state which part of the conduction pathway each of the P wave, QRS complex and T wave records.
- Calculate a heart rate from the interval between R peaks on a trace, and identify tachycardia, bradycardia, atrial fibrillation and an ectopic beat from what the trace looks like.
- Explain how chemoreceptors and pressure receptors, the medulla and the autonomic nerves change heart rate, as a negative feedback loop.
Why large active animals need mass transport
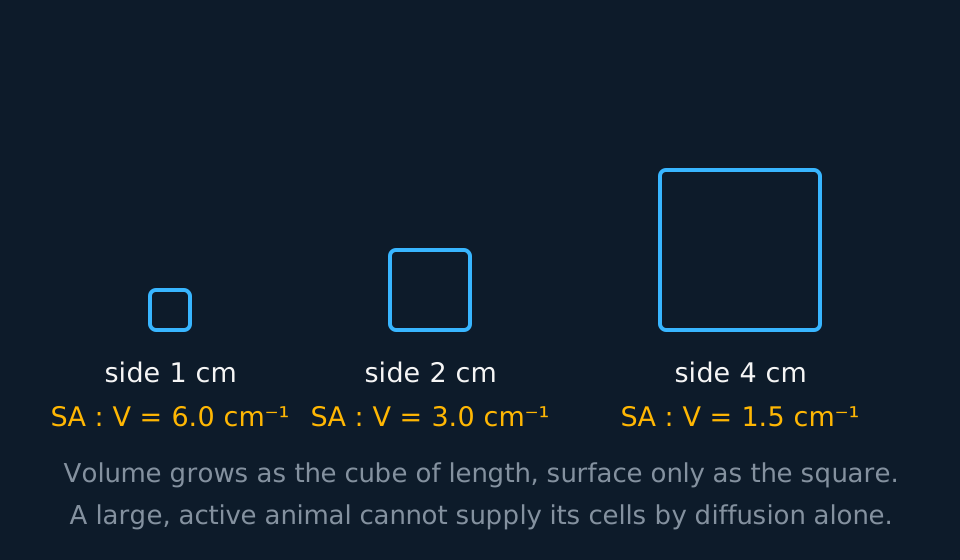
A flatworm has no heart, no blood and no vessels. It is flat and thin, no cell in it lies more than a fraction of a millimetre from the surface, and diffusion supplies oxygen to every cell. Increasing the size of such an animal creates two separate problems.
Describe the drawing
Three cubes drawn side by side with sides of one, two and four centimetres, each labelled with its surface area to volume ratio: six, three and one point five per centimetre. The cubes get larger from left to right while the ratio falls, showing that a bigger body has proportionally less surface across which to exchange materials.
The first is the surface area to volume ratio. Volume rises with the cube of length while surface area rises only with the square, so a big animal has proportionally far less exchange surface per gram of tissue than a small one. The second problem is the diffusion distance. Doubling the distance does not double the time taken; it roughly quadruples it. Over a few micrometres diffusion is effectively instantaneous; over a few centimetres it takes days.
A third factor applies to mammals and birds. They are endothermic and have a high metabolic rate, so their demand for oxygen and glucose per gram of tissue is high and their production of carbon dioxide is correspondingly high. Large size, high activity and endothermy together make a mass transport system necessary.
- Mass transport system
- A system in which substances are moved in bulk, in a fluid driven by a pump, over distances too great for diffusion to serve.
- Surface area to volume ratio
- The exchange surface available per unit of volume; it falls as an object gets larger.
- Metabolic rate
- The rate at which an organism uses energy, and so the rate at which it must be supplied with oxygen and relieved of carbon dioxide.
Single and double circulation
A fish has a two-chambered heart and a single circulation: blood is pumped from the heart to the gills, and from the gills it passes directly to the body before returning. Passage through the gill capillaries causes a large drop in pressure, so blood leaves the gills at low pressure and circulates slowly through the rest of the fish. The arrangement is adequate because a fish's oxygen demand per unit mass is comparatively low; not maintaining a body temperature above the surroundings is part, but not the whole, of the explanation.
In a double circulation the blood returns to the heart between the two circuits. The right side sends it to the lungs and it returns to the left side, which pumps it out again at a pressure the gas exchange surface does not have to withstand. Each circuit therefore operates at the pressure suited to it.
| Single circulation (fish) | Double circulation (mammal) | |
|---|---|---|
| Times through the heart per circuit | Once | Twice |
| Pressure reaching the body | Low: already spent in the gills | High: re-pressurised by the left ventricle |
| Rate of delivery | Slower | Faster, so a higher metabolic rate is possible |
| Pressure at the gas exchange surface | The full output of the heart | Only about a fifth of it, so the capillaries survive |
Keep the two circuits straight by name. The pulmonary circuit runs right ventricle → lungs → left atrium and works at roughly 24/8 mmHg. The systemic circuit runs left ventricle → body → right atrium at roughly 120/80 mmHg. Five times the pressure, on the same volume of blood per minute.
Within the systemic circuit the organs are supplied in parallel: most receive their own branch of the aorta and drain back into the vena cava. Learn the names of the vessels serving the heart, lungs and kidneys. The renal artery carries blood from the aorta to each kidney and the renal vein returns it to the vena cava. The lungs are supplied by the pulmonary artery and drained by the pulmonary veins, and the heart muscle is supplied by the coronary arteries, the first branches of the aorta.
The structure of the mammalian heart
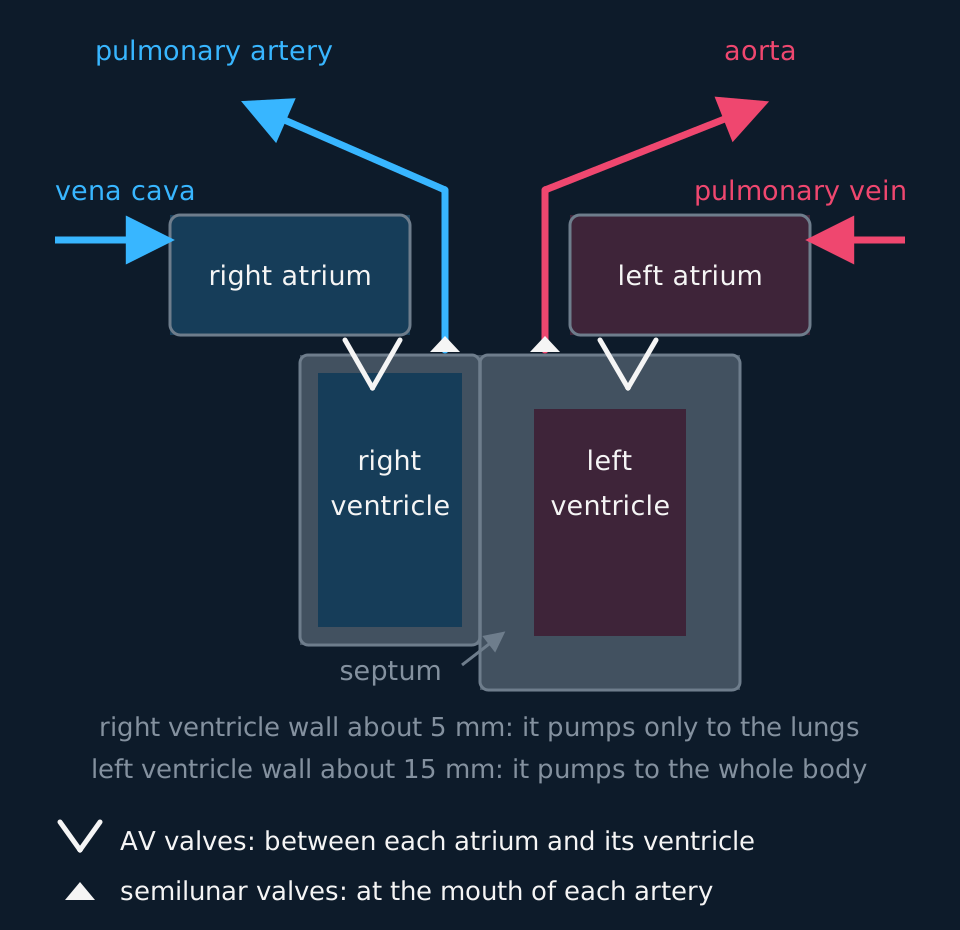
The heart is two pumps side by side, sharing a wall and contracting together. The right side receives blood returning from the body and pumps it to the lungs; the left side receives blood returning from the lungs and pumps it to the rest of the body. The septum between them keeps oxygenated and deoxygenated blood from mixing, which matters because mixed blood would deliver less oxygen per unit volume.
Describe the drawing
A vertical section through the heart seen from the front, so the left side of the heart is drawn on the right. Deoxygenated blood arrives from the vena cava into the right atrium, passes an atrioventricular valve into the thin-walled right ventricle and leaves by the pulmonary artery. Oxygenated blood returns by the pulmonary vein into the left atrium, passes the left atrioventricular valve into the left ventricle, whose wall is drawn three times thicker, and leaves by the aorta. Semilunar valves are drawn at the base of both arteries and a septum separates the two sides.
Trace the route of the blood. Vena cava → right atrium → atrioventricular valve → right ventricle → semilunar valve → pulmonary artery → lungs → pulmonary vein → left atrium → atrioventricular valve → left ventricle → semilunar valve → aorta. Learn that sequence in full: questions about septal defects, faulty valves and blocked coronary arteries all depend on it.
Two vessels are named against the usual pattern. The pulmonary artery carries deoxygenated blood and the pulmonary vein carries oxygenated blood. An artery is a vessel carrying blood away from the heart and a vein one carrying it back; oxygenation is not part of the definition.
The wall thicknesses relate directly to the pressures generated. Atria have thin walls: they push blood a few centimetres into a ventricle that is already relaxed and filling. The right ventricle wall is around 5 mm thick and generates about 24 mmHg, sufficient to drive blood through the lungs. A higher pressure would force fluid out of the thin-walled alveolar capillaries. The left ventricle wall is around 15 mm, three times as thick, with far more cardiac muscle, and generates about 120 mmHg, which is required to drive blood around the whole systemic circuit.
- Atrioventricular valves
- The valves between each atrium and its ventricle; tricuspid on the right, bicuspid or mitral on the left.
- Semilunar valves
- The valves at the base of the aorta and the pulmonary artery, preventing backflow into the ventricles.
- Tendinous cords
- Inelastic strands running from the atrioventricular valve flaps to papillary muscles projecting from the ventricle wall. The muscles tense as the ventricle contracts, so ventricular pressure cannot turn the flaps inside out; the pressure does the opening and shutting, the cords only stop the flaps going too far.
- Coronary arteries
- The vessels branching from the base of the aorta that supply the heart muscle itself with oxygenated blood.
One beat, three stages
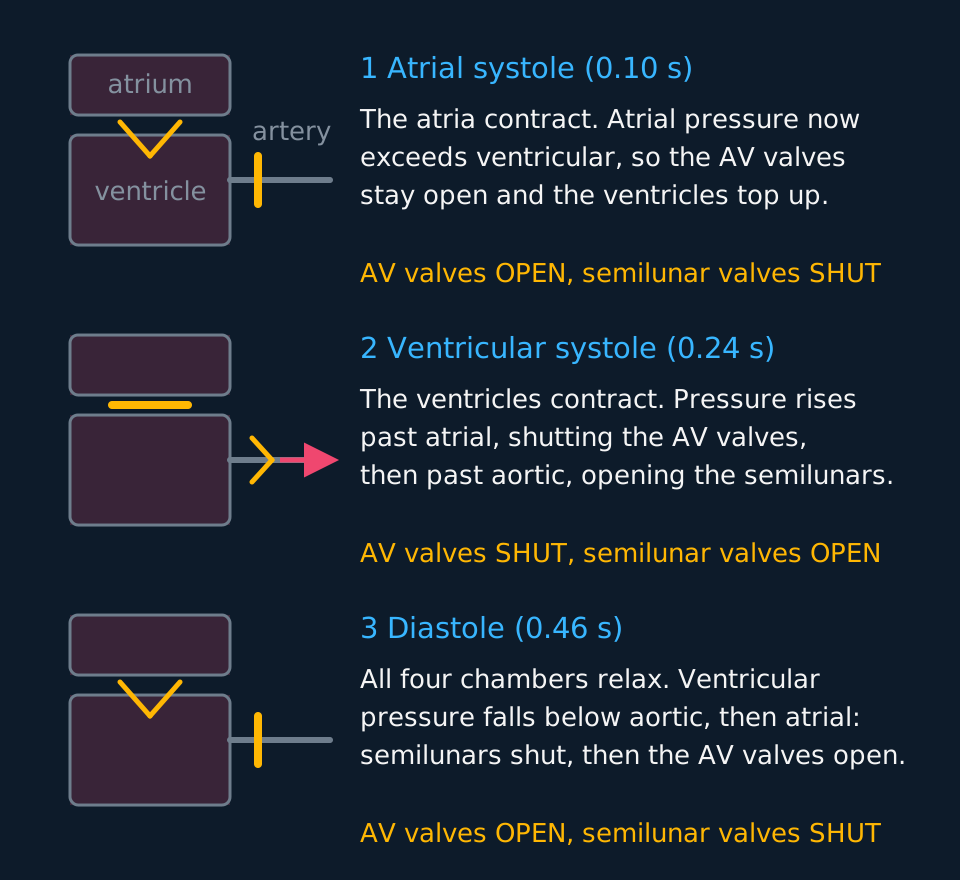
At rest a cycle takes about 0.8 s, which is 75 beats a minute. Systole means a chamber is contracting; diastole means it is relaxing. The stages below are described by what the pressure is doing, because that is what the valves respond to.
Describe the drawing
Three rows, one for each stage of the cardiac cycle. Each row draws an atrium above a ventricle with an artery leaving to the right, and the valves are drawn open or shut. In atrial systole the atrioventricular valve hangs open and the semilunar valve is a closed bar. In ventricular systole the atrioventricular valve is a closed bar and the semilunar valve is open with blood leaving. In diastole the atrioventricular valve is open again and the semilunar valve shut. Beside each drawing is the pressure change that moves those valves.
In atrial systole the atria contract, atrial pressure rises above ventricular, and the atrioventricular valves, already open, stay open while the last 20 to 30 per cent of the ventricles' filling is completed. Ventricular pressure is nowhere near aortic, so the semilunar valves stay shut. This stage lasts about 0.1 s.
In ventricular systole the ventricles contract from the apex upwards. Ventricular pressure shoots past atrial pressure and forces the atrioventricular valves shut, which is the first heart sound. For a moment both sets of valves are closed and the blood has nowhere to go, so the pressure rises without any change in volume. The instant ventricular pressure passes aortic pressure the semilunar valves are forced open and blood is ejected. About 0.24 s, measured from the first heart sound to the second.
In diastole the ventricles relax and their pressure falls. As soon as it drops below aortic pressure, blood in the aorta pushes back on the semilunar valves and shuts them: the second heart sound. Pressure keeps falling until it is below atrial pressure, at which point the atrioventricular valves open and blood flows in from the veins through the relaxed atria and straight into the ventricles. Roughly 70 per cent of ventricular filling happens here, before the atria contract. About 0.46 s, so the ventricles spend more of every cycle relaxed than contracting, which allows cardiac muscle to be perfused between contractions.
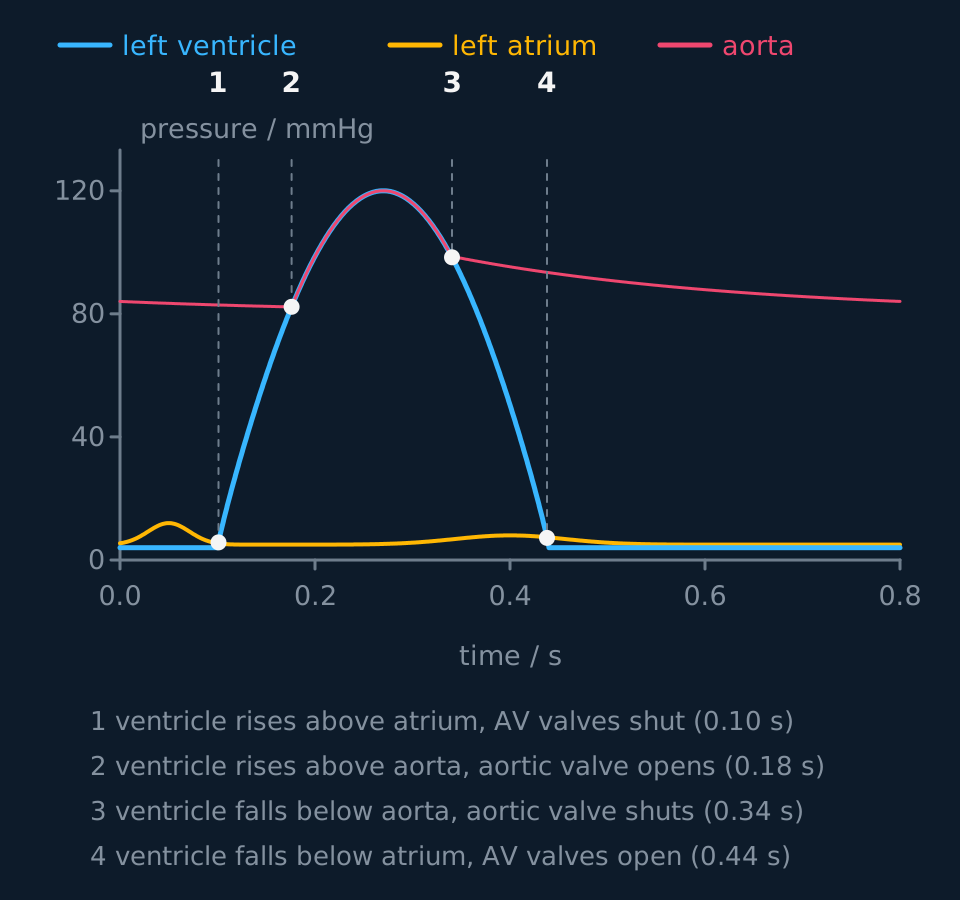
Those three intervals total the 0.8 s of the whole cycle. They need not be memorised: the end of atrial systole and the end of ventricular systole can be read from the pressure graph as the points where two curves cross, at 0.10 s and 0.34 s.
Reading the pressure-time graph
The graph shows three curves, and the first step is to identify each of them from its shape.
Describe the drawing
A graph of pressure in millimetres of mercury against time in seconds for one heartbeat. The left ventricle curve starts low, rises steeply to a peak of 120, then falls back. The aorta curve never drops below about 80 and rides with the ventricle while blood is being ejected. The left atrium curve stays under 15 throughout. Four points are ringed where the curves cross, numbered one to four, and each is the moment a valve opens or shuts.
The ventricle is the curve with the largest range: near zero, up to about 120 mmHg, and back to near zero. The aorta is the curve that never falls below about 80 mmHg, because elastic recoil in the arterial walls holds pressure up between beats. The atrium is the low, flat curve, never above about 15 mmHg. Identify all three before answering.
The four valve events follow in order, each at a crossing of two curves:
| Time | What crosses what | Consequence |
|---|---|---|
| ≈ 0.10 s | Ventricular rises above atrial | Atrioventricular valves shut (first heart sound) |
| ≈ 0.18 s | Ventricular rises above aortic | Aortic valve opens; ejection begins |
| ≈ 0.34 s | Ventricular falls below aortic | Aortic valve shuts (second heart sound) |
| ≈ 0.44 s | Ventricular falls below atrial | Atrioventricular valves open; filling begins |
Between 0.10 s and 0.18 s the ventricle is contracting while both valves are closed, so no blood leaves it. Pressure rises and volume is unchanged.
A ventricular volume curve follows from the same four events. Volume rises through diastole as blood flows in through the open atrioventricular valves, and a little more in atrial systole, to about 130 cm³ when those valves shut at 0.10 s. It stays level until the aortic valve opens at 0.18 s, falls to about 60 cm³ during ejection, and is level again from 0.34 s to 0.44 s, while every valve is shut and the ventricle relaxes. The fall between the two level sections is the stroke volume, about 70 cm³.
TRY IT: Justifying a valve event from the graph
Using the graph above, state the time at which the aortic (semilunar) valve opens, and explain how the graph shows this.
Check your answer
About 0.18 s.
Up to that moment the pressure in the aorta is higher than the pressure in the ventricle, so blood in the aorta presses back on the valve and holds it shut. At 0.18 s the two curves cross: ventricular pressure becomes the greater of the two, the pressure difference reverses, and the valve is pushed open from below.
Name the crossing of the two curves rather than only reading a value from the axis. 'The valve opens because the ventricle contracts' is insufficient: the ventricle has been contracting since 0.10 s without blood leaving it.
Cardiac output
Two quantities describe the output of the heart. Stroke volume is the volume pushed out by one ventricle in one beat, about 70 cm³ at rest. Heart rate is beats per minute, about 75 at rest for an adult, which corresponds to a 0.8 s cycle. The product of the two gives the volume leaving one ventricle each minute.
cardiac output = stroke volume × heart ratecm³ min⁻¹ = cm³ × min⁻¹; check the units before substituting
At rest that gives roughly 70 × 75 = 5250 cm³ min⁻¹, or 5.25 dm³ per minute, which is approximately the whole blood volume once a minute. A trained athlete at full effort can reach 30 dm³ min⁻¹ or more, partly by raising heart rate towards 190 and partly by raising stroke volume well beyond 100 cm³. Endurance training raises resting stroke volume, which is why a very fit person can have a resting heart rate in the forties and still deliver the same 5 dm³.
A calculation with a unit conversion buried in it
A student's stroke volume is 74 cm³ and her heart rate is 68 min⁻¹. Calculate her cardiac output in dm³ min⁻¹. During exercise her cardiac output reaches 19.0 dm³ min⁻¹ at a heart rate of 165 min⁻¹; calculate her stroke volume then.
Show the working
First part: 74 × 68 = 5032 cm³ min⁻¹. The answer is wanted in dm³ min⁻¹, and 1 dm³ = 1000 cm³, so divide: 5.03 dm³ min⁻¹.
Second part: rearrange to stroke volume = cardiac output ÷ heart rate. Convert first, since 19.0 dm³ min⁻¹ is 19 000 cm³ min⁻¹, then 19 000 ÷ 165 = 115 cm³ to three significant figures.
So her heart rate rose by a factor of 2.4 and her stroke volume by a factor of 1.6, and the two together gave her nearly four times the output. Most marks lost on this question are lost on the conversion, not the biology.
Myogenic control and the conduction pathway
An isolated heart continues to beat for a period, which shows that the impulse originates within the cardiac muscle rather than in the brain. Cardiac muscle is myogenic. Nerves from the medulla and hormones such as adrenaline change the rate, but they do not create the beat.
The sinoatrial node (SAN) in the wall of the right atrium depolarises spontaneously about 75 times a minute and is the pacemaker. The wave of depolarisation spreads across both atria through the muscle itself, so both atria contract together, top down.
Between the atria and the ventricles is a band of connective tissue that will not conduct. The only way through is the atrioventricular node (AVN), and the AVN holds the impulse for roughly 0.13 s before passing it on. That delay allows the atria to finish emptying before the ventricles contract. Without it, atria and ventricles would contract simultaneously and ventricular filling would be incomplete.
From the AVN the impulse runs down the bundle of His through the septum to the apex of the heart, then out into the Purkyne fibres that carry it up through the ventricle walls. Because contraction begins at the apex, the ventricles contract from the apex upwards, so blood is driven towards the arteries leaving the top of the heart.
- Myogenic
- Contracting from within the muscle itself, without needing a nerve impulse to initiate the beat.
- Sinoatrial node
- The patch of tissue in the right atrium wall that sets the rhythm of the heart.
- Atrioventricular node
- The only electrical connection between atria and ventricles; it delays the impulse so the atria empty first.
- Purkyne fibres
- Conducting fibres running from the bundle of His up through the ventricle walls, so contraction begins at the apex.
Reading an electrocardiogram
That wave of depolarisation is an electrical event, and electrical events in a large mass of muscle produce small currents that spread through the tissues and reach the skin. Put electrodes on the skin, measure the potential difference between them, and plot it against time, and the result is an electrocardiogram. State what the trace records: the electrical activity of the heart muscle, not the movement of the walls, the pressure in a chamber or the flow of blood. Contraction follows each deflection a fraction of a second later. Because the trace records electrical activity only, it can appear close to normal in a heart with impaired pumping.
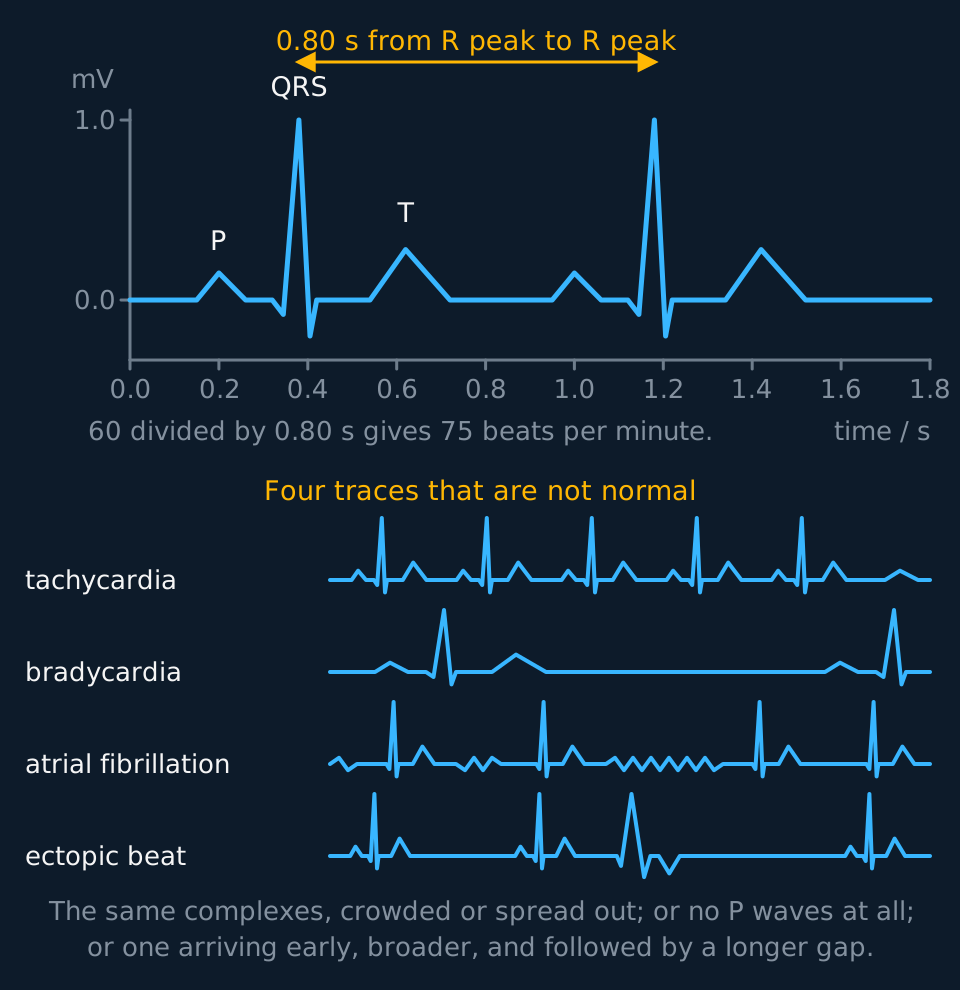
Describe the drawing
A normal electrocardiogram drawn twice over on axes of potential difference in millivolts against time in seconds. Each beat shows a small P wave, a tall narrow QRS complex reaching one millivolt, and a broader T wave, and the gap between the two R peaks is marked as nought point eight zero seconds. Below it, four further traces: tachycardia with the beats crowded together, bradycardia with only two beats in the same time, atrial fibrillation with an unsteady baseline, no P waves and unevenly spaced QRS complexes, and an ectopic beat, where an otherwise regular rhythm is broken by a third complex that arrives early, has no P wave in front of it, is broader than the others and has a T wave pointing the other way, and is followed by a gap longer than the regular interval before the rhythm resumes.
One beat gives three deflections, and each one is a piece of the conduction pathway from the previous section. The P wave is the depolarisation of the atria, spreading out from the SAN, and atrial contraction follows it. The QRS complex is the depolarisation of the ventricles, carried down the bundle of His and out along the Purkyne fibres, and ventricular contraction follows it. It is much the largest deflection because there is far more muscle in the ventricle walls than in the atria, so far more tissue depolarises at once. The T wave is the repolarisation of the ventricles, the muscle returning to its resting state before the next beat. There is no separate wave for atrial repolarisation; it happens underneath the QRS complex and is hidden by it.
The flat section between the end of the P wave and the start of the QRS complex corresponds to the AVN delay. No large mass of muscle is depolarising during it, because the impulse is held at the node while the atria finish emptying.
- Electrocardiogram
- A recording of the potential difference measured at the skin against time, produced by the wave of depolarisation spreading through the heart muscle.
- P wave
- The deflection produced by depolarisation of the atria, which atrial contraction follows.
- QRS complex
- The large deflection produced by depolarisation of the ventricles, large because the ventricle walls hold most of the heart's muscle.
- T wave
- The deflection produced by repolarisation of the ventricles.
Obtain a heart rate from a trace by measurement rather than by counting. Find two R peaks, which are the easiest points to locate because they are the tallest and the narrowest. Read the time of each off the horizontal axis and subtract, giving the interval between beats in seconds. Then heart rate in beats per minute is 60 divided by that interval. In the figure the R peaks are 0.80 s apart, so the rate is 60 ÷ 0.80 = 75 beats per minute. Measure across several intervals and divide rather than taking one, because a millimetre's error in reading one peak matters much less when it is spread over four intervals than over one.
Four abnormal traces are named on the specifications, and each is recognised by one feature.
| Trace | What you see | What it means |
|---|---|---|
| Normal | P, QRS and T in that order, one P for every QRS, evenly spaced | Between 60 and 100 beats per minute at rest |
| Tachycardia | The same complexes, closer together | Faster than 100 beats per minute at rest |
| Bradycardia | The same complexes, further apart | Slower than 60 beats per minute; normal in a trained athlete |
| Atrial fibrillation | No recognisable P waves, an unsteady baseline, and QRS complexes at irregular intervals | The atria are not contracting as a unit, so ventricular filling is poor and the rhythm is irregular |
| Ectopic beat | One extra QRS arriving early and out of the rhythm, often oddly shaped, usually followed by a longer than usual gap | A patch of muscle outside the SAN has depolarised on its own; an occasional one is harmless |
Distinguish two of those carefully. Bradycardia is a slow but regular rhythm: the intervals are long and equal, and every QRS complex is preceded by a P wave. Atrial fibrillation is irregular rather than slow: the intervals differ from beat to beat, and the P waves are absent, because the atrial muscle depolarises in an uncoordinated way rather than as one wave. When distinguishing two traces, name the feature used.
The interpretation of a bradycardia depends on the individual. A resting rate of 45 beats per minute in an endurance athlete is a sign of a large stroke volume, not of disease: the same cardiac output is being delivered in fewer, bigger beats. The same rate in someone untrained who is dizzy on standing is a different matter.
Control of heart rate
Myogenic means the heart does not require a nerve impulse to initiate a beat. It does not mean the rate is fixed. Nothing outside the heart initiates a beat, but nervous and hormonal signals from outside it adjust the frequency.
Heart rate is controlled from the cardiac centre in the medulla oblongata (the cardiovascular control centre in some specifications), which acts on the SAN through the autonomic nervous system. Two nerves reach the node with opposite effects. Impulses along the sympathetic nerve raise the rate; impulses along the parasympathetic branch of the vagus nerve lower it. At the node, sympathetic nerve endings release noradrenaline and vagus nerve endings release acetylcholine. Both operate continuously at some level, so the rate at any moment is set by the balance between them rather than by one of them being switched on.
The medulla receives input from two kinds of receptor, which detect different changes.
Chemoreceptors, in the carotid bodies and the aortic body and the medulla itself, monitor the pH of the blood. Exercise makes muscle respire faster, carbon dioxide concentration rises, more carbonic acid forms and pH falls. The chemoreceptors detect the fall and the medulla increases sympathetic impulses to the SAN, so heart rate rises, so carbon dioxide is carried to the lungs and removed faster, so pH returns towards normal and the frequency of impulses from the receptors falls. Set that out as a negative feedback loop rather than as a list of separate statements.
Pressure receptors, also called baroreceptors, sit in the walls of the carotid sinus and the aorta and monitor blood pressure. High pressure means more parasympathetic impulses and a slower, weaker beat, which brings the pressure down; low pressure means more sympathetic impulses and a faster, stronger beat, which brings it up. State the direction carefully: the receptor that detects a rise in pressure triggers a fall in cardiac output, not an increase.
- Chemoreceptor
- A receptor that detects a chemical change; those controlling heart rate detect the fall in blood pH caused by dissolved carbon dioxide.
- Pressure receptor
- A receptor in an artery wall that detects a change in blood pressure; also called a baroreceptor.
- Medulla oblongata
- The region of the brain that receives impulses from the chemoreceptors and pressure receptors and adjusts heart rate through the autonomic nervous system.
In the exam
- Explain each valve movement by comparing the pressure on its two sides. For example: "When ventricular pressure exceeds aortic pressure, the semilunar valve opens."
- Do not write that a valve contracts, relaxes, pulls or is pulled. Valves are flaps moved by the blood on either side of them.
- On a pressure graph, identify the curves first: the curve with the largest range is the ventricle, the one that never drops below about 80 mmHg is the aorta, and the low flat one is the atrium.
- Check the units in cardiac output questions. 1 dm³ = 1000 cm³, and 'per minute' requires the heart rate in beats per minute.
- For the AVN delay, state what it achieves: the atria finish emptying before the ventricles contract.
- The pulmonary artery carries deoxygenated blood and the pulmonary vein carries oxygenated blood. Define artery and vein by direction of travel.
- An electrocardiogram records electrical activity, not movement. State that the QRS complex is depolarisation of the ventricles, with contraction following it.
- To obtain a rate from a trace, measure R peak to R peak in seconds and divide 60 by that interval. State which two peaks were used and read the time axis rather than counting complexes by eye.
- Name the feature used to identify an abnormal trace: 'irregular intervals and no P waves, so atrial fibrillation', rather than a general statement that the trace is abnormal.
Check yourself
The wall of the left ventricle is about three times thicker than the wall of the right. Explain why, and suggest what would go wrong if the right ventricle wall were as thick as the left.
Answer
Both ventricles push out the same volume of blood per beat, roughly 70 cm³, but they push it to very different places. The right ventricle sends blood to the lungs, which are a few centimetres away and offer little resistance, so about 24 mmHg is enough. The left ventricle sends blood through the aorta to the whole body, against far greater resistance and over a far greater distance, and needs about 120 mmHg.
A thicker wall contains more cardiac muscle, so more force is generated when it contracts, so the pressure developed inside the chamber is greater. Structure follows the pressure required.
If the right ventricle generated 120 mmHg, that pressure would arrive at the pulmonary capillaries, whose walls are one cell thick. The high hydrostatic pressure would force far more fluid out of them than could be drawn back or drained away, and fluid would collect in the alveoli, which is pulmonary oedema. Gas exchange would be impaired by the extra diffusion distance, and the person would become breathless.
Each pump is matched to its circuit, and a double circulation keeps the gas exchange surface below systemic pressure.
Questions
Question 15 marks
Describe the pressure changes responsible for every valve movement in one cardiac cycle, starting at the beginning of ventricular systole.
Mark scheme
- B1 ventricular pressure rises above atrial pressure, so the atrioventricular valves are pushed shut, which is the first heart sound
- B1 for a short period both sets of valves are shut, so ventricular pressure climbs with no blood moving and no change in volume
- B1 ventricular pressure rises above aortic pressure, so the semilunar valves are forced open and blood is ejected
- B1 as the ventricles relax their pressure falls below aortic pressure, so blood in the aorta pushes the semilunar valves shut, which is the second heart sound
- A1 ventricular pressure keeps falling until it is below atrial pressure, at which point the atrioventricular valves open and the ventricles begin to fill again
Question 24 marks
At rest an adult has a stroke volume of 70 cm³ and a cardiac cycle lasting 0.80 s. Calculate her heart rate in beats per minute and her cardiac output in dm³ min⁻¹.
Mark scheme
- M1 heart rate = 60 ÷ 0.80, converting the time for one cycle into beats per minute
- A1 75 beats per minute
- M1 cardiac output = stroke volume × heart rate = 70 × 75 = 5250 cm³ min⁻¹
- A1 5.3 dm³ min⁻¹ (5.25 unrounded) after dividing by 1000, with the unit given
Question 34 marks
A heart removed from the body goes on beating for a while. Explain why it does so, and explain what the delay at the atrioventricular node achieves.
Mark scheme
- B1 cardiac muscle is myogenic, so the beat originates within the muscle itself and needs no nerve impulse to start it
- B1 the sinoatrial node in the wall of the right atrium depolarises spontaneously about 75 times a minute and acts as the pacemaker, while nerves and hormones only alter the rate
- B1 a band of connective tissue between atria and ventricles will not conduct, so the atrioventricular node is the only route through and it holds the impulse for about 0.13 s
- A1 that pause lets the atria finish emptying before the ventricles contract, so the ventricles are properly filled; without it both would contract together and the ventricles would fill badly
Question 44 marks
An electrocardiogram is recorded from electrodes placed on a patient's skin. Describe what the trace measures, and state which event in the heart produces each of the P wave, the QRS complex and the T wave.
Mark scheme
- B1 it measures the potential difference between the electrodes against time, produced by the wave of depolarisation spreading through the heart muscle, so it records electrical activity rather than movement of the walls or pressure in the chambers
- B1 the P wave is produced by depolarisation of the atria, spreading out from the sinoatrial node, and atrial contraction follows it
- B1 the QRS complex is produced by depolarisation of the ventricles, and it is the largest deflection because the ventricle walls contain far more muscle than the atria
- A1 the T wave is produced by repolarisation of the ventricles, returning the muscle to its resting state
Question 54 marks
On an electrocardiogram the first R peak is at 0.32 s and the fifth R peak is at 2.32 s. Calculate the patient's heart rate in beats per minute, and state whether the trace shows tachycardia, bradycardia or neither.
Mark scheme
- M1 four intervals separate the first and the fifth peak, so the mean interval is (2.32 − 0.32) ÷ 4
- A1 2.00 ÷ 4 = 0.50 s between beats
- M1 heart rate = 60 ÷ the interval in seconds
- A1 60 ÷ 0.50 = 120 beats per minute, which is above 100, so the trace shows tachycardia
Question 64 marks
A flatworm has no heart, no blood and no vessels, and relies on diffusion to supply oxygen to every cell. Explain why a large, active mammal could not rely on diffusion alone.
Mark scheme
- B1 as an animal's size increases, its volume rises with the cube of its length while its surface area rises only with the square, so its surface area to volume ratio falls
- B1 a large animal therefore has far less exchange surface available per gram of tissue than a small one such as a flatworm
- B1 doubling the diffusion distance across a large body does not double the time diffusion takes, it roughly quadruples it, so diffusion alone is far too slow over centimetres
- A1 a large, active, endothermic mammal also has a high metabolic rate and so a high demand for oxygen and glucose, which makes a mass transport system, rather than diffusion, necessary to meet that demand
Question 74 marks
At rest a man's cardiac output is 5.25 dm³ min⁻¹ with a heart rate of 75 min⁻¹. During exercise his heart rate rises to 150 min⁻¹ and his stroke volume rises to 105 cm³. Calculate his cardiac output during exercise in dm³ min⁻¹, and calculate the factor by which it has increased compared with rest.
Mark scheme
- M1 cardiac output = stroke volume × heart rate = 105 × 150
- A1 15 750 cm³ min⁻¹, which is 15.75 dm³ min⁻¹ (accept 15.8)
- M1 factor increase = exercise cardiac output ÷ resting cardiac output = 15.75 ÷ 5.25
- A1 3.0 times (three-fold) higher during exercise than at rest
Question 83 marks
Compare the single circulation of a fish with the double circulation of a mammal.
Mark scheme
- B1 blood passes through the heart once per circuit in a fish but twice per circuit in a mammal
- B1 in a fish blood travels straight from the gill capillaries to the body and so reaches it at low pressure, whereas in a mammal it returns to the heart and is re-pressurised by the left ventricle
- A1 delivery is therefore faster in the mammal, which supports a higher metabolic rate, while its gas exchange surface sees only about a fifth of the systemic pressure rather than the full pressure of the ventricle
Question 93 marks
A baby is born with a hole in the septum between the two ventricles. Suggest why the baby becomes breathless and tires easily.
Mark scheme
- B1 the septum normally keeps oxygenated and deoxygenated blood apart, and a hole lets the two mix
- B1 the left ventricle generates about 120 mmHg against the right ventricle's 24 mmHg, so blood is pushed from left to right and oxygenated blood is sent back to the lungs instead of to the body
- A1 less oxygenated blood therefore reaches the body, so less oxygen is delivered to respiring tissue and the heart has to work harder to compensate
Question 103 marks
Two traces are recorded from different patients. In the first the complexes are evenly spaced and every QRS is preceded by a P wave. In the second the baseline is unsteady, no P waves can be found and the QRS complexes are unevenly spaced. Explain what the second trace shows and why the patient's ventricles fill less well than normal.
Mark scheme
- B1 the second trace shows atrial fibrillation, identified by the absence of P waves and by the irregular intervals between QRS complexes
- B1 the atrial muscle is depolarising chaotically rather than in one organised wave from the sinoatrial node, so there is no single deflection to record and the atria do not contract as a unit
- A1 atrial systole normally tops the ventricles up before they contract, so without it the ventricles are less full at the start of ventricular systole and stroke volume falls
Question 113 marks
The atrioventricular valves are held by tendinous cords running to papillary muscles in the ventricle wall. Suggest what would happen to blood flow through the heart if these cords were torn.
Mark scheme
- B1 the tendinous cords are inelastic strands that normally stop the valve flaps being pushed too far when ventricular pressure rises
- B1 papillary muscles tense as the ventricle contracts, so the cords stay taut and hold the flaps in place at the moment ventricular pressure is highest
- A1 if the cords were torn, rising ventricular pressure would turn the flaps inside out into the atrium instead of holding them shut, so blood would leak backwards into the atrium during ventricular systole
Question 123 marks
During exercise, a rise in blood carbon dioxide concentration leads to an increase in heart rate. Explain the sequence of events linking the two, as a negative feedback loop.
Mark scheme
- B1 more carbon dioxide dissolves in the blood and forms carbonic acid, so blood pH falls
- B1 chemoreceptors in the carotid bodies, the aortic body and the medulla itself detect this fall in pH, and the medulla responds by increasing sympathetic impulses to the sinoatrial node, raising heart rate
- A1 the faster heart rate carries carbon dioxide to the lungs and removes it faster, so blood pH returns towards normal and the frequency of impulses from the chemoreceptors falls again, completing the negative feedback loop
Question 133 marks
Explain how pressure receptors in the carotid sinus and the aorta respond to a rise in blood pressure, and explain how their response brings the pressure back down.
Mark scheme
- B1 a rise in blood pressure increases the frequency of impulses from the pressure receptors to the medulla
- B1 the medulla responds by increasing parasympathetic impulses to the sinoatrial node, and reducing sympathetic impulses
- A1 this produces a slower, weaker heartbeat, which reduces cardiac output and brings the blood pressure back down towards normal
Question 142 marks
State why a resting heart rate of 45 beats per minute is not a sign of disease in a trained endurance athlete, although it might be in someone else.
Mark scheme
- B1 in the athlete a large stroke volume delivers the same cardiac output in fewer, bigger beats, so the low rate is normal for them
- B1 in someone untrained, the same low rate would not be compensated by an unusually large stroke volume, so it might indicate reduced cardiac output and be a sign of disease
Question 151 mark
State what causes a valve in the heart to open or to shut.
Mark scheme
- B1 a difference in pressure across the valve, with blood pushing harder on one face than on the other
Worth remembering
- Every valve movement in the heart is caused by a pressure difference, never by muscle pulling on the valve.
- A valve is open when the chamber behind it holds the higher pressure, and shut when it does not.
- Artery means away from the heart, vein means towards it; the pulmonary pair are the exception to the oxygenation you expect.
- Cardiac output = stroke volume × heart rate; at rest about 70 cm³ × 75 min⁻¹ ≈ 5.25 dm³ min⁻¹.
- SAN → atria → AVN (delay ≈ 0.13 s) → bundle of His → apex → Purkyne fibres → ventricles contract from the bottom up.
- Myogenic means nothing outside starts the beat. The medulla still sets the rate, through sympathetic (faster) and parasympathetic (slower) nerves.
- Chemoreceptors watch pH, pressure receptors watch pressure, and both loops answer a rise with the response that produces a fall.
- P wave, atria depolarise; QRS complex, ventricles depolarise; T wave, ventricles repolarise. The QRS is biggest because the ventricles hold the most muscle.
- Heart rate from a trace = 60 ÷ the interval between two R peaks in seconds.
- Tachycardia is fast and regular, bradycardia is slow and regular, atrial fibrillation is irregular with no P waves, and an ectopic beat is one early complex in an otherwise regular rhythm.
CHECK YOUR PROGRESS
Rate how confident you are with each objective for this lesson. Ratings are saved in this browser, on this device, unless you sign in.
- Explain why a large, active animal needs a mass transport system when a flatworm does not.
- Say what double circulation gives a mammal that single circulation cannot.
- Label the mammalian heart and account for the thickness of the left ventricle wall in terms of the pressure it generates.
- Describe the three stages of the cardiac cycle, giving the pressure change responsible for every valve movement.
- Read a pressure-against-time graph: identify each curve and mark where each valve opens and shuts.
- Calculate cardiac output, stroke volume or heart rate from the other two.
- Trace an impulse from the SAN to the ventricle walls and explain why the delay at the AVN matters.
- Say what an electrocardiogram measures, and state which part of the conduction pathway each of the P wave, QRS complex and T wave records.
- Calculate a heart rate from the interval between R peaks on a trace, and identify tachycardia, bradycardia, atrial fibrillation and an ectopic beat from what the trace looks like.
- Explain how chemoreceptors and pressure receptors, the medulla and the autonomic nerves change heart rate, as a negative feedback loop.
Open the full revision checklist to see every objective in the curriculum in one place.
Practise this lesson
Practise the heart and cardiac cycle with 15 original questions and point-by-point mark schemes
WORKBOOK
The written questions from this topic, on paper with room to work, and a separate book of mark schemes. The 3 questions that are set on a diagram stay on this page, where the diagram can be drawn. Free to use; please do not redistribute or sell.