Biology › Nutrition, digestion and health evidence › Diet, energy and how to read a health claim
Diet, energy and how to read a health claim
Daily energy expenditure includes basal metabolism, physical activity and the energy used in digestion. Dietary health claims must also be evaluated from the study design, control of confounding variables, measurement method, effect size, absolute risk and replication.
Before this Carbohydrates, lipids and proteins as molecules · Correlation and causation, confounding variables and randomisation · Mean, spread and what a statistical test does
COMMON MISCONCEPTION
This study followed half a million people, so the result is reliable, because a sample that large settles the question.
A large sample reduces sampling uncertainty and can narrow a confidence interval. It does not remove systematic measurement error, selection bias or confounding, so sample size alone does not establish a causal result.
What you should be able to do
- Define basal metabolic rate and state what a person's BMR mostly depends on.
- Calculate an energy balance and explain why a small daily surplus does not extrapolate.
- State what a diet must supply beyond energy, and give a named consequence of each shortfall.
- Distinguish a cohort study, a case-control study and a randomised controlled trial by what each starts with.
- Name the confounder, the reverse causation or the measurement problem in a given dietary study.
- Convert a relative risk into an absolute risk, and say which one a reader needs.
- Weigh two studies that disagree by their design, sample size and selection, control of confounding, measurement and funding, and say what would resolve the conflict.
- Measure the vitamin C content of a food or drink with DCPIP against a standard of known concentration, and calculate it from the volumes.
Energy balance and basal metabolic rate
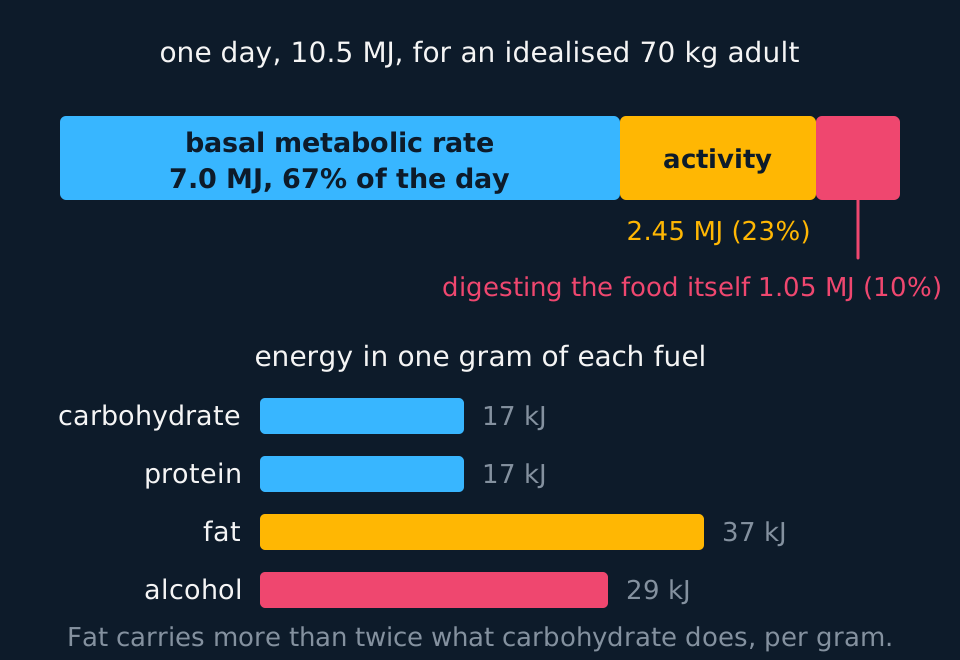
Energy balance is the difference between the chemical energy absorbed from food and the energy the body expends. Expenditure has three components: basal metabolism, physical activity and the energy used in digestion.
Describe the drawing
A single horizontal bar divided into three parts to scale: a large cyan section for basal metabolic rate at seven megajoules or two thirds of the day, an amber section for physical activity, and a small coral section for the energy spent digesting food. Below it four horizontal bars drawn to a common scale compare the energy in one gram of carbohydrate, protein, fat and alcohol, with fat by far the longest bar at thirty-seven kilojoules per gram.
Basal metabolic rate is the rate at which energy is expended by a person at complete rest, awake, at a comfortable temperature, twelve hours or more after a meal. It pays for the sodium-potassium pumps in every cell, protein synthesis, the beating heart, the kidneys and the brain, which takes something like a fifth of it. What sets it, more than anything else, is lean body mass: muscle, liver, kidney and brain are expensive and adipose tissue is cheap.
BMR is measured by indirect calorimetry: oxygen consumption is measured and converted to an energy expenditure, because oxidising a known mass of substrate consumes a known volume of oxygen.
energy balance = energy absorbed − energy expendedpositive means storage, negative means mobilisation
A small surplus, and what it does not do
A person's intake exceeds their expenditure by 0.4 MJ per day, about the energy in one biscuit. Adipose tissue stores about 29 MJ per kilogram. Calculate the mass they would gain in a year if nothing else changed, and explain why the real gain is much smaller. The figures are idealised.
Show the working
Over a year the surplus is 0.4 × 365 = 146 MJ. At 29 MJ per kilogram of adipose tissue that is 146 ÷ 29 = 5.0 kg, and on this arithmetic the gain continues at 5 kg every year indefinitely.
It does not, and the reason is in the phrase 'if nothing else changed'. A heavier body has more tissue to maintain and costs more to move, so both the basal rate and the cost of any activity rise as mass is gained, and the surplus closes itself. Mass rises until expenditure matches the new intake and then stops: for a surplus of this size, energy-balance modelling of the kind published by Hall and colleagues in 2011, the model behind the US National Institutes of Health body-weight planner, puts the eventual gain at around 4 to 5 kg in total, about half of it in the first year.
A linear extrapolation of a physiological quantity is unreliable, because the system responds to the change. Multiplying a daily surplus by 3650 to give a ten-year gain ignores that response.
What a diet has to supply
Energy is necessary and nowhere near sufficient. A diet has to provide specific molecules the body cannot make, in quantities that range over six orders of magnitude.
| Component | What it is needed for | What a shortfall causes |
|---|---|---|
| Carbohydrate | The main respiratory substrate | Protein and lipid broken down for energy instead |
| Protein | Amino acids for every protein you build | Loss of muscle mass; poor growth and repair |
| Lipid | Membrane phospholipid, steroid precursors, fat-soluble vitamin carriage | Essential fatty acid deficiency |
| Fibre | Bulk for the large intestine to work on | Constipation; associated with higher bowel disease risk |
| Vitamins | Coenzymes and regulators, in milligram or microgram amounts | Named deficiency diseases: scurvy, rickets, beriberi |
| Minerals | Iron in haemoglobin, calcium in bone, iodine in thyroxine | Anaemia, poor bone mineralisation, goitre |
| Water | The solvent everything else happens in | Rapid and total failure |
Nine of the twenty amino acids are essential in an adult: the body has no pathway to make them, so they have to arrive in food, while the rest can be made by transamination. Two fatty acids, linoleic and alpha-linolenic, are essential for the same kind of reason: human enzymes cannot introduce a double bond beyond a certain point in the chain. 'Essential' means 'we cannot synthesise it', not 'it matters more'.
The UK reference intake for protein is about 0.75 g per kilogram of body mass per day, so a 70 kg adult needs around 52 g. Vitamin C is needed at a few tens of milligrams a day, and its absence causes scurvy because vitamin C is required to hydroxylate proline in collagen, and unhydroxylated collagen cannot form a stable triple helix.
Malnutrition means any imbalance between what a diet supplies and what the body needs, and that includes excess. An adult who is obese and simultaneously deficient in iron and vitamin D is malnourished twice over, and this pattern is now common in high-income countries.
Body mass index and its limitations
A man has a mass of 82 kg and a height of 1.78 m. Calculate his body mass index, state which category it falls in, and give two reasons the figure might mislead a clinician.
Show the working
BMI is mass divided by the square of height. Height squared is 1.78² = 3.1684 m², so BMI = 82 ÷ 3.1684 = 25.9 kg m⁻², which falls in the 25.0 to 29.9 band conventionally labelled overweight.
First reason: BMI cannot distinguish adipose tissue from muscle. A trained rower and a sedentary man of the same height and mass have the same BMI and very different bodies.
Second reason: it says nothing about where the tissue is. Adipose tissue around the abdominal organs is associated with much higher cardiovascular and metabolic risk than the same mass under the skin of the hips, and BMI is blind to the difference. Waist measurement captures some of what BMI misses, and so does the waist-to-hip ratio, waist circumference divided by hip circumference: values above about 0.90 in men or 0.85 in women indicate abdominal obesity. The ratio of waist to height is used in the same way.
Study designs and what each can show
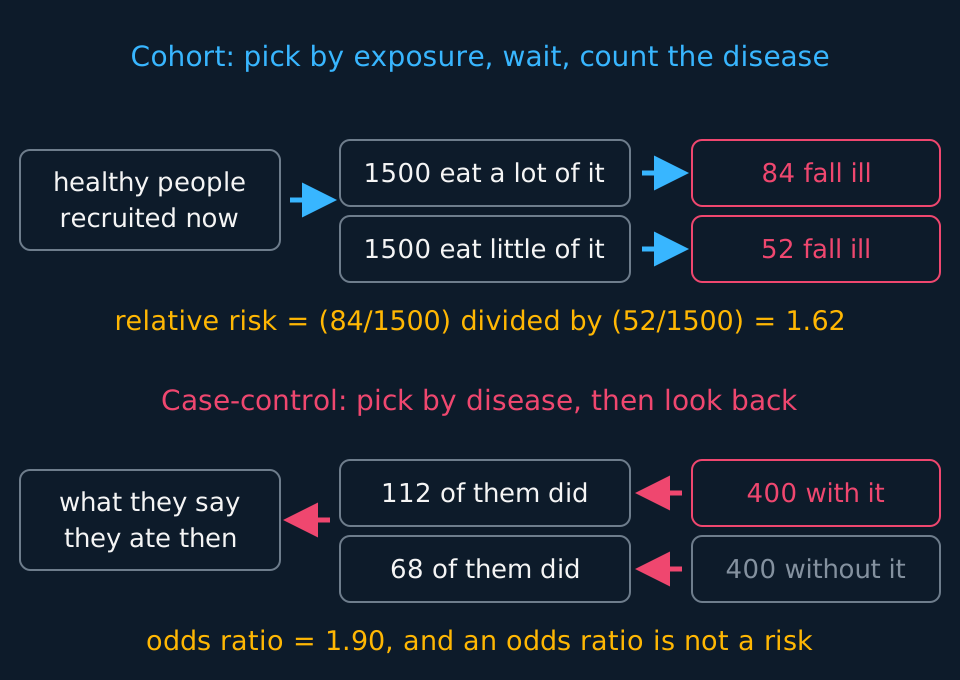
Almost every claim about food and health comes from one of four kinds of study, and the design determines what the finding can support.
Describe the drawing
Two panels, each a row of boxes joined by arrows. In the upper panel the arrows run left to right: healthy people recruited now, split into fifteen hundred who eat a lot of something and fifteen hundred who eat little, followed forward until eighty-four and fifty-two of them respectively fall ill, giving a relative risk of 1.62. In the lower panel the arrows run right to left: four hundred people who already have the disease and four hundred who do not are asked what they ate, and the resulting odds ratio of 1.90 is flagged as not being a risk.
- Cohort study
- A group of people free of the disease is recruited, their exposure is recorded, and they are followed forward in time to see who develops it. Gives incidence and relative risk directly, and gets the time order right by construction.
- Case-control study
- People who already have the disease are compared with matched people who do not, and both groups are asked about past exposure. Fast and efficient for rare diseases; yields an odds ratio, not a risk.
- Randomised controlled trial
- Participants are allocated to an intervention group or a control group, often given a placebo, and the outcomes are compared. Allocation is by chance, so the groups tend to be balanced on every variable, including the ones nobody thought to measure.
- Relative risk
- The risk in the exposed group divided by the risk in the unexposed group; 1 means no association.
Randomisation is the only device that deals with confounders you have not thought of, which is why a trial outranks the rest. Dietary trials are nonetheless hard, and the difficulties are examinable in their own right: participants cannot usually be blinded to what they are eating, adherence drifts over years so the two groups' diets converge, cardiovascular outcomes take decades to accumulate, and a lifetime diet cannot be assigned at random.
Most of what is known about diet therefore comes from cohort studies, and the largest are highly informative. The British Doctors Study recruited over 34,000 male doctors in 1951 and followed them for fifty years, which is how the link between smoking and lung cancer was settled without a single randomised trial. Confounding could not be ruled out by design; the findings were strong and consistent enough that the confounding explanation stopped being credible.
| Design | Starts with | Gives you | Its weakness |
|---|---|---|---|
| Randomised trial | Volunteers, allocated by chance | A causal answer for the people studied | Short, expensive, hard to blind for diet |
| Cohort | People without the disease | Incidence, relative risk, correct time order | Confounding; needs huge numbers and years |
| Case-control | People with the disease | An odds ratio, quickly, for rare diseases | Recall bias; choosing fair controls |
| Cross-sectional | A population at one moment | Prevalence and associations | Cannot tell which came first |
Confounding, recall and reverse causation
A confounding variable is one that is associated with the exposure and independently affects the outcome. In nutrition they are everywhere, because eating habits travel in packs with everything else about a life: people who eat more wholegrain also smoke less, exercise more, are richer and go to the doctor sooner. That bundle is the healthy-user effect, and it is large enough to manufacture a respectable-looking association out of nothing.
Statistical adjustment can subtract the effect of a confounder, but only one that was measured, and only as accurately as it was measured. Adjusting for 'smoking: yes or no' leaves behind all the difference between two a day and forty. What is left over is residual confounding, and it is the standard explanation for a relative risk close to 1 that appears and disappears between studies.
The measurement of diet is a substantial source of error. Dietary intake in large cohorts is usually recorded with a food frequency questionnaire asking how often someone ate around a hundred foods over the past year. Against objective methods, adults under-report their energy intake by something like a fifth to a third, and the size of the under-reporting is related to body mass, so the error is not noise that averages out. It is bias pointing one way.
Reverse causation is the third standard alternative. Undiagnosed disease changes appetite and diet years before a diagnosis, so a study can find that people who ate less of something went on to be diagnosed with the illness that was already quietly changing what they ate. Careful cohorts discard the first few years of follow-up and re-run the analysis; if the association survives, reverse causation is a weaker explanation.
TRY IT: Naming the alternative explanation
A cohort study of 90,000 adults reports that people in the highest quintile of coffee consumption had a 15% lower risk of death over 12 years than those in the lowest, after adjustment for age, sex and smoking status. A newspaper reports that coffee makes you live longer. Evaluate that conclusion.
Give three specific reasons for caution and say, for each, what would reduce it.
Check your answer
The study is observational: nobody assigned the coffee, so the groups differ in many ways at once and the comparison is between kinds of people, not between treatments.
First, confounding, though smoking is the wrong suspect. Heavy smokers drink more coffee, so smoking recorded only as yes or no leaves residual confounding that pushes the result towards harm, and it cannot explain a lower risk. A confounder that could has to be more common among heavy coffee drinkers and lower the death rate in its own right, such as a higher income if the groups differ in it. Measuring variables like that and adjusting for them would test it.
Second, reverse causation. People already unwell often give up coffee, loading the lowest-consumption group with people who were ill at the start. Excluding deaths in the first four years would test it.
Third, the size of the effect. A relative risk of 0.85 from observational data is small enough to be produced by residual confounding alone.
What would strengthen the claim: a dose-response across the quintiles, and the same result in populations where coffee drinking is not associated with smoking.
Relative risk, absolute risk, and the missing denominator
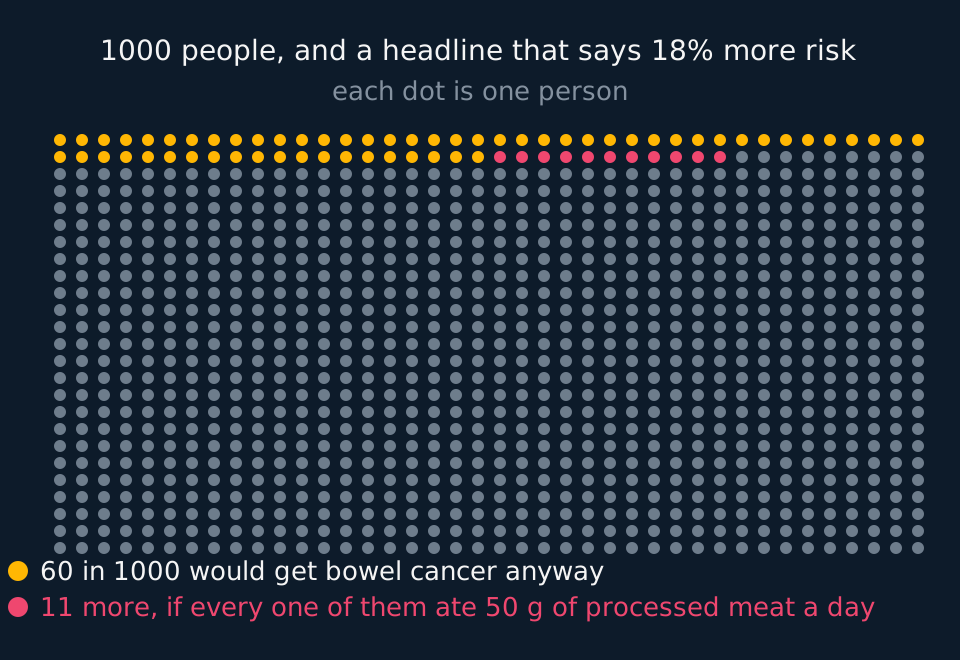
A headline stating that a food raises risk by 18% is quoting a relative risk, which cannot be interpreted without the baseline risk it applies to.
Describe the drawing
A grid of one thousand small dots arranged in forty columns and twenty-five rows. Sixty of them, filling the first row and a half, are amber for the people who would develop bowel cancer anyway at the ordinary lifetime risk of about six in a hundred. Eleven immediately after them are coral for the additional cases an eighteen per cent relative increase would produce. The remaining nine hundred and twenty-nine dots are grey.
Turning a relative risk into people
About 6 in every 100 people in the UK develop bowel cancer at some point in their lives. Eating 50 g of processed meat a day is associated with an 18% higher relative risk. Calculate the absolute risk for someone eating that much, the increase in absolute terms, and the number of people who would have to eat that way for one extra case to arise.
Show the working
The baseline absolute risk is 6.0%. Raising it by 18% gives 6.0 × 1.18 = 7.08%, so about 7 people in every 100 rather than 6.
The increase in absolute risk is 7.08 − 6.00 = 1.08 percentage points, or about 11 extra cases per 1000 people.
The number who would have to be exposed for one extra case is 1 ÷ 0.0108 = 93 people. That is the figure a reader deciding what to have for breakfast actually needs.
Both numbers are correct and they are not interchangeable. Relative risk is the right measure for asking whether an exposure does anything; absolute risk is the right measure for asking whether it matters to you.
The same confusion runs through the way carcinogens are classified. When processed meat was placed in the highest group in 2015, alongside tobacco smoking, the classification was a statement about the strength of the evidence that it causes cancer in humans, not about the size of the risk. Both bodies of evidence are considered sufficient; the risks differ by more than a factor of ten.
One more distinction, because papers use both words. A relative risk can only be calculated where the risk in each group is known, so it comes from cohorts and trials. A case-control study cannot know the risk, because the investigator chose how many cases and controls to recruit, so it reports an odds ratio. For a rare disease the two are close; for a common one the odds ratio sits further from 1, so quoting it as a risk overstates the finding.
How large a risk feels often differs from how large it is. People tend to underestimate risks that are familiar, chosen and slow to show, such as the heart-disease risk of a diet high in saturated fat or of years without exercise, because the harm comes decades later and no single meal seems to matter; most people also judge their own risk to be below average. They overestimate risks that are rare, dramatic, new or imposed on them, such as a contaminant in food that makes the news, particularly when it is reported only as a relative risk.
Evaluating a dietary health claim
A headline may report that an exposure is associated with a percentage change in disease risk. Before interpreting the claim, identify the study design, compare relative and absolute risk, check how diet and outcomes were measured, consider confounding and reverse causation, and look for replication and a plausible mechanism.
| Ask | Stronger evidence | Limitation to consider |
|---|---|---|
| What design? | Randomised trial, or several cohorts agreeing | One cross-sectional survey |
| How big is the relative risk? | Well above 2, with a dose-response | 1.1 to 1.3, adjusted heavily |
| What is the absolute risk? | Stated, with a denominator | Not mentioned anywhere |
| How was the exposure measured? | Weighed, or biochemically | Recalled over the past year |
| Is there a mechanism? | Tested in cells or animals | Proposed afterwards to fit |
| Is it new? | Replicated in other populations | First report, single group |
| Does the claim match the peer-reviewed study? | The reported finding matches the paper | The claim comes from a press release or a product advertisement |
That last row is supported by evidence of its own. Work published in 2014 compared health stories in the UK press with the university press releases they came from, and found that most of the exaggeration was already present in the press release: turning correlation into causation, turning animal work into human advice. The journalists were largely reproducing what scientists' own institutions had sent them.
None of this is a reason to reject nutritional science. Some dietary findings are as well established as any in medicine: that vitamin C prevents scurvy, that folate before conception reduces neural tube defects, that iodine deficiency causes goitre. Each has a mechanism, a dose-response, an effect too large for confounding to explain, and evidence from more than one kind of study.
A complete evaluation is short. Name the design, name the specific alternative explanation, say what evidence would test it, and give a denominator for any risk quoted. Stating only that correlation does not imply causation is true of every observational study and says nothing about the one in question.
When two studies disagree
Studies of the same question often disagree. Pearson Edexcel Biology A asks you to recognise conflicting evidence, and AQA to evaluate it: weigh the studies rather than pick the result you prefer or split the difference. Check first that the two studies really conflict. If they used different populations, different doses or different outcomes, both results can be correct.
| Ask of each study | Why the answer matters |
|---|---|
| What was the design? | For a question about cause, a randomised trial outweighs a cohort, and a cohort outweighs a case-control or cross-sectional study |
| How large was the sample, and how was it chosen? | A larger sample gives a more precise estimate. A sample of volunteers, one sex or one age group may not represent the population, and no increase in size repairs that |
| Which confounders were measured and adjusted for? | A study that adjusted for smoking, income and activity is harder to explain away than one that adjusted for age and sex only |
| How were exposure and outcome measured? | Weighed food and diagnoses from medical records beat a recalled diet and a self-reported illness |
| Was it large enough to find an effect? | A small study that finds nothing has not shown there is nothing; a real but modest effect may be too small for it to detect |
| Who paid for it? | Funding from a company with an interest in the answer does not make a result wrong, but it is a reason to check the design and whether the analysis was planned before the data were seen |
| Has it been repeated? | A result reproduced by independent groups in other populations carries more weight than a single report |
- Conflict of interest
- A financial or personal interest that could influence how a study is designed, analysed or reported. Journals require authors to declare them.
- Publication bias
- The tendency for studies with positive or striking results to be published more often than studies that found nothing, so the published literature overstates effects.
- Meta-analysis
- A statistical combination of the results of several studies of the same question into one estimate, with larger and more precise studies given more weight.
Beta-carotene and lung cancer is a documented case. Cohort studies found that people who ate more fruit and vegetables rich in beta-carotene, or had more of it in their blood, developed lung cancer less often. Two large randomised trials then gave beta-carotene supplements: one to about 29,000 male smokers in Finland, reported in 1994, and one in the United States, with vitamin A added, to smokers, former smokers and workers exposed to asbestos, stopped early in 1996. In both, lung cancer was more common in the groups given beta-carotene than in the groups given a placebo.
The conflict resolves once each study is asked what it tested. The cohorts measured a diet, and people who eat a lot of vegetables differ from those who do not in smoking, income and much else, so beta-carotene in the blood may have been a marker of a healthier life rather than its cause. The trials tested high-dose supplements and allocated them at random, so confounding is very unlikely to explain their result. On the causal question the trials win. Both findings can stand: a diet rich in vegetables goes with lower risk, and high-dose beta-carotene supplements do not protect smokers.
TRY IT: Weighing two studies
Two studies of eggs and heart attacks are described below. Both are invented for this exercise.
Study A, a case-control study, compared 250 people who had had a heart attack with 250 people who had not, matched for age and sex. Diet over the previous five years was recalled in an interview. People who said they ate an egg most days had an odds ratio of 1.6.
Study B, a cohort study funded by an egg producers' association, recruited 60,000 adults free of heart disease, recorded their diet by questionnaire, adjusted for smoking, blood pressure, income and physical activity, and followed them for 12 years. The relative risk for eating an egg most days was 1.02.
Evaluate the two studies and say which carries more weight.
Check your answer
Study B carries more weight on design. A cohort recorded diet before anyone had a heart attack, so the time order is right and recall cannot have been coloured by the diagnosis. Study A asked people afterwards, and people who have had a heart attack may remember their diet differently.
Study B is far larger, so its estimate is more precise, and it adjusted for the main confounders. Study A matched only for age and sex, and frequent egg eaters may differ in other ways that affect the heart.
Study B's weaknesses: diet was measured once by questionnaire, so error in the exposure tends to pull the relative risk towards 1, and the funder had an interest in a null result. The funding is a reason to check that the analysis was registered in advance and that the methods are sound, not a reason to discard the study.
Judgement: on this evidence there is little or no association between eating an egg most days and heart attack, with the case-control result best explained by recall bias and confounding. What would settle it is replication in other cohorts by independent groups, combined in a meta-analysis.
Core practical 2: investigate the vitamin C content of food and drink
optional
Pearson Edexcel Biology A (9BN0) sets this as Core Practical 2: Investigate the vitamin C content of food and drink. The other boards do not name it.
Vitamin C, ascorbic acid, is a reducing agent. DCPIP (dichlorophenolindophenol) is a blue dye that becomes colourless when it is reduced. A solution containing vitamin C is added to a fixed volume of DCPIP a little at a time, and the blue fades until all the DCPIP has been reduced and the colour has gone. That is the end point. The more vitamin C a sample contains, the smaller the volume of it needed to reach the end point. In an acidic fruit juice the dye can turn pink before it clears; the end point is still the loss of colour.
The apparatus: DCPIP solution, all from one batch; a standard solution of vitamin C of known concentration, for example 1.00 mg cm⁻³, made up on the day; the drinks to be tested; test tubes in a rack in front of a white tile; a graduated pipette or syringe for the DCPIP; and a burette, or a 1 cm³ graduated pipette or syringe, for adding each sample. A solid food is blended with a measured volume of distilled water and filtered, so that the result can be given per gram of food.
| Step | What to do | Why |
|---|---|---|
| 1 | Put 1.0 cm³ of DCPIP into a clean test tube | Every sample is measured against the same amount of dye |
| 2 | Add the vitamin C standard from the burette or syringe one drop at a time, shaking the tube gently after each drop | Mixing lets each drop react before the next is added, so the end point is not overshot |
| 3 | Stop as soon as the blue has gone and does not come back on shaking, and record the volume added | This volume of standard contains just enough vitamin C to reduce 1.0 cm³ of the DCPIP |
| 4 | Repeat steps 1 to 3 until three volumes agree closely, and take their mean | A single reading cannot show whether the end point was judged well |
| 5 | Rinse the burette or syringe, then repeat steps 1 to 4 with each drink or food extract | Each sample is now compared with the standard measured the same way on the same day |
The independent variable is the food or drink, or a treatment applied to one, such as the time a juice is boiled or how long a carton has been open. The dependent variable is the volume of sample needed to decolourise the DCPIP. Control the volume and concentration of DCPIP, the way the end point is judged (against a white tile, beside a tube of DCPIP already decolourised), the temperature, and the time between preparing a sample and testing it, because vitamin C is oxidised by air, and faster when it is warm or in light. The standard is what turns a volume into a mass, so it is run with the same DCPIP on the same day.
vitamin C concentration of sample = (volume of standard × concentration of standard) ÷ volume of sampleBoth volumes are the volumes that decolourised 1.0 cm³ of the same DCPIP solution, so the volume of standard times its concentration is the mass of vitamin C that reduces that much dye
Fresh juice against juice left open
These results are invented to show the calculation. 1.0 cm³ of DCPIP was decolourised by 0.50, 0.48 and 0.52 cm³ of a 1.00 mg cm⁻³ vitamin C standard; by 1.30, 1.20 and 1.25 cm³ of freshly opened orange juice; and by 2.05, 1.95 and 2.00 cm³ of the same juice after three days open in a warm room. Calculate the vitamin C content of each juice in mg per 100 cm³, and the percentage lost.
Show the working
Mean volumes: standard 0.50 cm³, fresh juice 1.25 cm³, stored juice 2.00 cm³.
Mass of vitamin C that reduces 1.0 cm³ of the DCPIP = 0.50 × 1.00 = 0.50 mg.
Fresh juice: 0.50 ÷ 1.25 = 0.40 mg cm⁻³, which is 40 mg per 100 cm³. Stored juice: 0.50 ÷ 2.00 = 0.25 mg cm⁻³, which is 25 mg per 100 cm³.
Percentage lost = (40 − 25) ÷ 40 × 100 = 38%. The stored juice needed more volume to reach the end point because some of its vitamin C had been oxidised.
| Source of error | Effect | Improvement |
|---|---|---|
| The end point is judged by eye, and a strongly coloured juice hides it | Too much sample is added, so the vitamin C content is underestimated | Compare with a tube of decolourised DCPIP; dilute a coloured juice by a known factor; or follow the colour with a colorimeter |
| One drop is a large fraction of a small volume | The volume is imprecise | Use a burette or a finer syringe, or a larger volume of DCPIP so that the volume of sample needed is larger |
| Vitamin C is oxidised while samples stand | The content of the sample falls before it is measured | Make the standard fresh, test each sample promptly, and keep solutions covered and cool |
| Other reducing substances in the food also decolourise DCPIP | The vitamin C content is overestimated | A limitation of the method to state; a laboratory method that separates vitamin C from the rest, such as high-performance liquid chromatography, avoids it |
Risk assessment. DCPIP stains skin and clothing; check the CLEAPSS Hazcard and your school's risk assessment for it and for any other solution used, and wear eye protection, since fruit acid and the reagents both sting the eyes. Food and drink brought into the laboratory are never eaten or drunk there. A blender for solid foods is used only as the risk assessment directs, and unplugged before its blades are touched. Glass syringes and burettes break: clamp a burette, and fill it below eye level.
- DCPIP
- Dichlorophenolindophenol, a blue dye that becomes colourless when it is reduced. Vitamin C reduces it, so the volume of a sample needed to decolourise a fixed volume of DCPIP measures the sample's vitamin C content.
- End point
- The point in a titration at which the reaction is just complete, seen as a change that does not reverse, such as the last of the blue of DCPIP disappearing.
In the exam
- Define BMR with its conditions: at rest, awake, at a comfortable temperature and well after a meal.
- Where a relative risk is given with a baseline, calculate the absolute risk and state which measure is being quoted.
- Name the confounding variable specifically, as in 'people who ate more oily fish were also wealthier, and income affects health independently', rather than referring to other factors in general.
- For a study design question, the discriminator is what the investigators started with: healthy people (cohort), people with the disease (case-control), or volunteers allocated by chance (trial).
- Energy calculations: 1 kcal is 4.184 kJ, and a food label's 'calories' are kilocalories. Check the units before the arithmetic, because both appear on the same packet.
- In the vitamin C practical, a larger volume of sample needed to decolourise the DCPIP means less vitamin C in the sample, not more.
Check yourself
A case-control study of 600 people with type 2 diabetes and 600 matched controls finds that the cases drank sugar-sweetened drinks more often, with an odds ratio of 1.7. Explain what this study can and cannot establish, and describe the study you would want next.
Answer
It establishes an association between recalled consumption of sugar-sweetened drinks and having a diagnosis of type 2 diabetes, measured as an odds ratio of 1.7. Because the investigators chose how many cases and controls to recruit, this is not a risk and should not be reported as a 70% higher risk.
It cannot establish the time order. Both groups were asked after diagnosis, so the drinking may have preceded the disease or followed it, and people who have been told they have diabetes may also recall their past differently from people who have not; that recall bias inflates the finding.
It cannot rule out confounding. Sugary drink consumption is associated with total energy intake, body mass, income and physical activity, each of which affects diabetes risk independently, and matching controls on age and sex does nothing about any of them.
What comes next is a prospective cohort: recruit people without diabetes, measure consumption at the start and repeatedly afterwards, follow them for a decade or more, and record who is diagnosed. That fixes the time order, gives a genuine relative risk and allows a dose-response to be looked for. A randomised trial of an intermediate outcome, such as insulin sensitivity over a year, would test the mechanism directly even though it could not run long enough to count cases.
Questions
Question 16 marks
The table gives the results of a randomised controlled trial of a dietary supplement, constructed for this question rather than measured. Discuss what this trial does establish about the supplement, and what it does not.
| Group | Number of participants | Number with a cardiovascular event in five years | Percentage with an event |
|---|---|---|---|
| Given the supplement | 5000 | 200 | 4.0 |
| Given a placebo | 5000 | 250 | 5.0 |
Mark scheme
- B1 the participants were allocated by chance, so the two groups tend to be balanced on every variable including the ones nobody thought to measure, and the difference between them can be attributed to the supplement rather than to the kind of person who chooses to take one
- B1 the comparison group took a placebo, so participants and investigators can be blinded and the difference cannot be put down to expectation or to the treated group changing other habits once they knew
- B1 the effect is 200 events in 5000 against 250 in 5000, a relative risk of 4.0 ÷ 5.0 = 0.80, so a fifth fewer events in the treated group
- B1 in absolute terms that is a fall of 1.0 percentage point, so about 100 people would have to take the supplement for five years for one event to be avoided
- B1 it does not establish that the result applies to everyone: the participants volunteered and are not a random sample of the population, and five years is short against a disease that takes decades to develop, so the trial cannot say whether the benefit persists, grows or fades over a lifetime
- B1 it does not establish a net benefit, because the table records one outcome only: adverse effects and death from any cause are not shown, and a supplement that lowers one disease while raising another has not been shown to help
Question 26 marks
The table describes two studies of daily salt intake and stroke, constructed for this question rather than measured. A website quotes Study P as evidence that salt does not raise the risk of stroke. Evaluate the two studies and the website's claim.
| Feature | Study P | Study Q |
|---|---|---|
| Design | Cross-sectional survey | Cohort study |
| Participants | 800 volunteers recruited at a gym | 24,000 adults from general practice lists |
| How salt intake was measured | Questionnaire on one occasion | Sodium in 24-hour urine samples, twice |
| Adjusted for | Age and sex | Age, sex, smoking, body mass index and alcohol |
| Funded by | A manufacturer of salted snacks | A national research council |
| Result | No association between salt intake and stroke | Relative risk of stroke 1.3 in the highest salt group against the lowest |
Mark scheme
- B1 Study P is cross-sectional, measuring salt and stroke at one moment, so it cannot show which came first; Study Q measured intake before strokes occurred
- B1 Study P is small and its gym volunteers are not representative: they are likely to be fitter and healthier, with few strokes, so a real effect could be missed; Study Q's larger sample from practice lists represents the population better and gives a more precise estimate
- B1 salt intake recalled once by questionnaire is measured with much more error than sodium in repeated 24-hour urine samples, and error in the exposure tends to hide an association
- B1 Study Q adjusted for more confounders, so its association is harder to explain by smoking, body mass or alcohol, although residual confounding remains possible in any observational study
- B1 Study P was funded by a company with an interest in the result, which does not make it wrong but is a reason to check its design and analysis closely
- B1 judgement: the website's claim is not supported. Study Q carries more weight and suggests that higher salt intake is associated with a higher risk of stroke; a finding of no association in a small, unrepresentative study does not show that there is no effect
Question 35 marks
A cross-sectional survey of 40 000 adults reports that those taking a vitamin supplement have a 12 per cent lower rate of heart disease than those who do not. A newspaper concludes that the supplement protects the heart. Evaluate that conclusion.
Mark scheme
- B1 in support: the sample is large, so random error is small and the association is unlikely to have arisen by chance alone
- B1 in support: an association of this kind is a reasonable hypothesis to generate, and it can be tested directly by a design that settles the question
- B1 against: the design is cross-sectional, measuring a population at one moment, so it cannot say which came first. People already diagnosed may have started or stopped taking supplements because of the diagnosis
- B1 against: nobody allocated the supplement, so the two groups differ in many ways at once; people who take supplements tend to smoke less, exercise more and earn more, and a prevalence ratio of 0.88 is close enough to 1 to be produced by residual confounding alone
- B1 judgement: the conclusion is not supported by this study, which reports an association as though it were a cause; what would settle it is a randomised controlled trial of the supplement against a placebo, since randomisation balances the confounders nobody measured
Question 44 marks
In a population, 4 people in every 100 develop a particular cancer during their lifetime. A cohort study reports a relative risk of 1.25 for that cancer in people with a high intake of one food. Calculate the absolute lifetime risk for those people, calculate the increase in absolute risk in percentage points, and calculate how many people would have to eat that way for one extra case to arise.
Mark scheme
- M1 the absolute risk in the exposed group is the baseline absolute risk multiplied by the relative risk
- A1 4.0 × 1.25 = 5.0 per cent, so about 5 people in every 100 rather than 4
- M1 the increase in absolute risk is 5.0 − 4.0 = 1.0 percentage point, and the number needed for one extra case is one divided by that increase
- A1 1 ÷ 0.010 = 100 people
Question 54 marks
Compare a cohort study with a case-control study, referring to who is recruited, what measure each produces, and the main weakness of each.
Mark scheme
- B1 a cohort recruits people who are free of the disease and follows them forward in time, whereas a case-control starts with people who already have the disease and compares them with matched people who do not
- B1 a cohort records exposure before the disease appears, so the time order is right by construction, whereas a case-control asks both groups about past exposure and cannot establish which came first
- B1 a cohort gives incidence and a relative risk, whereas a case-control gives an odds ratio, because the investigator chose how many cases and controls to recruit and so cannot know the risk in either group
- B1 a cohort needs very large numbers and many years and is still open to confounding, whereas a case-control is quick and efficient for a rare disease but is open to recall bias and to unfair choice of controls
Question 64 marks
A cohort study finds that adults who reported eating the least fruit were later diagnosed with cancer more often than those who reported eating the most. Suggest two explanations for this association other than a protective effect of fruit, and suggest for each what the investigators could do to test it.
Mark scheme
- B1 confounding: people who eat more fruit also tend to smoke less, exercise more and be wealthier, and each of those affects cancer risk independently
- B1 that could be tested by adjusting for cigarettes smoked per day rather than for smoking as a yes-or-no variable, and by repeating the analysis in people who have never smoked
- B1 reverse causation: undiagnosed disease changes appetite and diet years before a diagnosis, so people who were already ill may have eaten less fruit because of the illness rather than the other way round
- B1 that could be tested by discarding the first few years of follow-up and re-running the analysis; if the association survives, reverse causation is a weaker explanation
Question 74 marks
A woman has a basal metabolic rate of 6.8 MJ per day and a physical activity level of 1.5, so her total daily energy expenditure is her basal metabolic rate multiplied by that figure. She takes in 2800 kcal per day. Taking 1 kcal as 4.184 kJ and adipose tissue as storing 29 MJ per kilogram, calculate her daily energy surplus and calculate the mass she would gain over 30 days if nothing else changed.
Mark scheme
- M1 total energy expenditure = basal metabolic rate × physical activity level = 6.8 × 1.5 = 10.2 MJ per day
- M1 energy taken in = 2800 × 4.184 = 11 715 kJ per day, which is 11.7 MJ per day
- A1 surplus = 11.7 − 10.2 = 1.5 MJ per day
- A1 over 30 days that is 45 MJ, and 45 ÷ 29 = 1.6 kg gained; the real gain would be smaller, because expenditure rises as mass rises
Question 84 marks
The table gives what one adult's food supplied in a day against the reference intake for that person, constructed for this question rather than measured. Identify the components that fall short, give a named consequence of each shortfall, and identify one reason this person could be called malnourished although the diet supplies enough energy.
| Component | Supplied in the day's food | Reference intake |
|---|---|---|
| Energy | 9.6 MJ | 9.5 MJ |
| Protein | 58 g | 52 g |
| Iron | 5 mg | 15 mg |
| Vitamin C | 8 mg | 40 mg |
| Calcium | 760 mg | 700 mg |
| Fibre | 12 g | 30 g |
Mark scheme
- B1 iron, at 5 mg against a reference intake of 15 mg: iron is needed for the haem group of haemoglobin, so a shortfall causes anaemia and less oxygen is carried
- B1 vitamin C, at 8 mg against 40 mg: vitamin C is needed to hydroxylate proline in collagen, and unhydroxylated collagen cannot form a stable triple helix, which is scurvy
- B1 fibre, at 12 g against 30 g: fibre is the bulk the large intestine works on, so a shortfall causes constipation and is associated with a higher risk of bowel disease
- B1 malnutrition means any mismatch between what a diet supplies and what the body needs, in either direction, so a person taking in enough energy and protein while short of three other components is malnourished
Question 94 marks
A woman has a mass of 68 kg and a height of 1.65 m. Calculate her body mass index to three significant figures, and calculate how many kilograms she would need to lose to bring her body mass index down to exactly 24.0 kg m⁻², assuming her height stays the same.
Mark scheme
- M1 BMI = mass ÷ height², so height² = 1.65² = 2.7225 m²
- A1 BMI = 68 ÷ 2.7225 = 25.0 kg m⁻², to three significant figures
- M1 mass at BMI 24.0 = 24.0 × 2.7225 = 65.34 kg
- A1 mass to lose = 68 − 65.34 = 2.7 kg, to two significant figures
Question 104 marks
Using a reference intake of 0.75 g of protein per kilogram of body mass per day, calculate the daily protein requirement of a 58 kg adult, and calculate what percentage of a diet supplying 1900 kcal per day that protein requirement represents, taking the energy value of protein as 17 kJ per gram and 1 kcal as 4.184 kJ.
Mark scheme
- B1 protein requirement = 0.75 × 58 = 43.5 g per day
- M1 energy from that protein = 43.5 × 17 = 739.5 kJ per day; total diet energy = 1900 × 4.184 = 7949.6 kJ per day
- M1 percentage = 739.5 ÷ 7949.6 × 100
- A1 9.3 per cent, to two significant figures
Question 114 marks
Explain what is meant by the 'healthy-user effect', and explain why it makes a small relative risk from an observational dietary study hard to interpret.
Mark scheme
- B1 people who choose to adopt one healthy behaviour, such as eating more wholegrain food, also tend to smoke less, exercise more, be wealthier and see a doctor sooner, and this whole bundle of associated behaviours is the healthy-user effect
- B1 because all of these differences travel together, a study comparing people who do and do not eat wholegrain food is really comparing two different kinds of people in many ways at once, not just in their wholegrain intake
- B1 adjusting statistically for one or two of these factors, such as smoking status, cannot remove the effect of all the others, especially ones that were never measured at all
- B1 a relative risk close to 1, such as 1.1 or 1.2, is small enough that this leftover, unmeasured confounding could produce it on its own, so such a finding cannot safely be read as evidence that the food itself is protective
Question 123 marks
An essential amino acid is one the body cannot make, so it must be supplied in the diet. The protein in maize contains very little of the essential amino acids lysine and tryptophan. Explain why a person whose only source of protein is maize may be unable to make enough of some of their own proteins, even when they eat plenty of maize.
Mark scheme
- B1 each protein has a fixed primary structure coded by its gene, so it can be made only if every amino acid in its sequence is available, including lysine and tryptophan
- B1 the body cannot make lysine or tryptophan, so when the small dietary supply runs out, synthesis of any protein containing them stops at that point
- B1 the amount of these proteins made is therefore limited by the essential amino acid in shortest supply, however much of the other amino acids is eaten
Question 133 marks
An essential amino acid is one the body cannot make, so it must be supplied in the diet; a non-essential amino acid can be made in the body from other molecules. Explain why calling an amino acid 'essential' does not mean that it matters more to the body than a 'non-essential' one.
Mark scheme
- B1 a protein's primary structure is fixed by its gene, so to make it the cell needs every amino acid in the sequence, whichever kind it is
- B1 if any amino acid, essential or not, is unavailable when it is needed, the polypeptide cannot be completed, so a non-essential one is just as necessary to the proteins that contain it
- B1 the term therefore describes where the amino acid comes from, the diet or the body's own synthesis, and not how important it is
Question 143 marks
Dietary intake in large cohort studies is often recorded using a food frequency questionnaire, and adults are known to under-report their energy intake by roughly a fifth to a third compared with objective measurements, and the shortfall is larger in people with a higher body mass. Suggest why this kind of error is more damaging to a study's conclusions than random error of the same average size.
Mark scheme
- B1 the size of the under-reporting is related to a person's body mass, so it is not the same for everyone: it does not simply add noise that averages out across the study
- B1 this kind of error is a bias, meaning it pushes results in a particular direction rather than scattering them randomly around the true value
- B1 a study that adjusts for reported energy intake, or that compares groups by what they report eating, can therefore reach a systematically wrong conclusion in a specific direction, even with a very large sample size, since a bigger sample only reduces random error and does nothing to a bias present in every participant
Question 153 marks
In 2015 the International Agency for Research on Cancer placed processed meat in Group 1, 'carcinogenic to humans', the group that also holds tobacco smoking. Explain why this classification does not mean that eating processed meat is as dangerous as smoking.
Mark scheme
- B1 the classification is a statement about the strength of the evidence that a substance causes cancer in humans at all, not about the size of the risk it causes
- B1 both processed meat and tobacco smoke were judged to have sufficient evidence of causing cancer, which is why they share the same category
- B1 the size of the risk each carries differs enormously, by more than a factor of ten
Question 163 marks
Cohort studies found that people with more beta-carotene in their diet or blood developed lung cancer less often. Randomised trials that gave smokers beta-carotene supplements found more lung cancer in the supplemented groups than in the placebo groups. Explain why the trials are given more weight on the question of cause, and explain how both findings can be correct.
Mark scheme
- B1 the trials allocated the supplement at random, so the groups were balanced on confounders, including ones nobody measured, and confounding is very unlikely to explain their result
- B1 in the cohorts, people eating more vegetables also tend to smoke less, earn more and live more healthily, so beta-carotene may have been a marker of a healthier life rather than the cause of lower risk
- B1 the studies tested different exposures: a diet rich in vegetables can go with lower risk while high-dose supplements given to smokers do not protect them
Question 173 marks
In an investigation of the vitamin C content of apple juice, 1.0 cm³ of DCPIP solution was decolourised by a mean of 0.60 cm³ of a vitamin C standard containing 1.0 mg cm⁻³, and by a mean of 2.40 cm³ of apple juice; the results are invented for this question. Calculate the vitamin C content of the apple juice in mg per 100 cm³.
Mark scheme
- M1 mass of vitamin C that decolourises 1.0 cm³ of DCPIP = 0.60 × 1.0 = 0.60 mg
- M1 concentration in the juice = 0.60 ÷ 2.40 = 0.25 mg cm⁻³
- A1 25 mg per 100 cm³
Question 182 marks
State the conditions under which basal metabolic rate is measured, and state what a person's basal metabolic rate mostly depends on.
Mark scheme
- B1 at complete rest, awake, at a comfortable temperature and twelve hours or more after a meal
- B1 lean body mass: muscle, liver, kidney and brain are metabolically expensive tissues while adipose tissue is cheap
Question 192 marks
Explain why publication bias can make a dietary supplement appear more effective than it is.
Mark scheme
- B1 studies that find a positive or striking effect are more likely to be published than studies that find no effect
- B1 so the published studies, and any review or meta-analysis built only from them, overstate the average effect of the supplement
Question 202 marks
A student used DCPIP to measure the vitamin C content of a fruit juice. Suggest one reason why the value obtained might be higher than the true vitamin C content of the juice, and one reason why it might be lower.
Mark scheme
- B1 higher: other reducing substances in the juice also decolourise DCPIP, so less juice is needed to reach the end point
- B1 lower: vitamin C in the juice was oxidised by air, warmth or light before it was tested; or the colour of the juice hid the end point so too much juice was added
Worth remembering
- Basal metabolism is roughly two thirds of a day's energy expenditure, and lean mass is what mostly sets it.
- A daily surplus does not extrapolate, because expenditure rises as mass rises until the two match again.
- Cohort starts with healthy people and looks forward; case-control starts with the disease and looks back; only randomisation balances the confounders nobody measured.
- A relative risk without an absolute risk is unreadable, and an odds ratio is not a risk at all.
- Sample size fixes precision, not bias. A bigger study of a badly measured exposure is a more precise wrong answer.
CHECK YOUR PROGRESS
Rate how confident you are with each objective for this lesson. Ratings are saved in this browser, on this device, unless you sign in.
- Define basal metabolic rate and state what a person's BMR mostly depends on.
- Calculate an energy balance and explain why a small daily surplus does not extrapolate.
- State what a diet must supply beyond energy, and give a named consequence of each shortfall.
- Distinguish a cohort study, a case-control study and a randomised controlled trial by what each starts with.
- Name the confounder, the reverse causation or the measurement problem in a given dietary study.
- Convert a relative risk into an absolute risk, and say which one a reader needs.
- Weigh two studies that disagree by their design, sample size and selection, control of confounding, measurement and funding, and say what would resolve the conflict.
- Measure the vitamin C content of a food or drink with DCPIP against a standard of known concentration, and calculate it from the volumes.
Open the full revision checklist to see every objective in the curriculum in one place.
Practise this lesson
WORKBOOK
The written questions from this topic, on paper with room to work, and a separate book of mark schemes. The 3 questions that are set on a diagram stay on this page, where the diagram can be drawn. Free to use; please do not redistribute or sell.