Biology › Practicals › Required practical 1: enzyme rate with trypsin and milk
Required practical 1: enzyme rate with trypsin and milk
Milk powder in water is cloudy because of its protein, casein. Trypsin hydrolyses casein to soluble peptides, so the suspension clears as the reaction runs, and a colorimeter turns that clearing into a falling absorbance. The gradient at the start of the curve is the initial rate, and repeating the run at several temperatures shows the rate rising to an optimum and collapsing above it.
The capability this develops
This guide is one investigation under capability P05: Measuring the rate of an enzyme-controlled reaction, which sets out the techniques the investigation belongs to, the calculations it carries and the errors that cost marks in all of them. The notes behind the biology are in Enzymes and metabolic control.
Where this sits on the specifications
This library maps a qualification to its own specification one numbered heading at a time, against a document whose sha256 is recorded, and publishes the result as a route map. These are the headings whose practical work this investigation serves, on four of the five qualifications mapped so far. Each links to the route map the row belongs to.
| Qualification | Heading |
|---|---|
| OCR H020/H420 | 2.1.4 Enzymes |
| Cambridge International 9700 | 3.2 Factors that affect enzyme action |
| Pearson Edexcel Biology A (Salters-Nuffield) 8BN0/9BN0 | 2.10 Enzyme action, specificity and location |
| Pearson Edexcel Biology A (Salters-Nuffield) 8BN0/9BN0 | 5.16 Temperature, enzyme rate and its impact on organisms |
| Pearson Edexcel Biology B 8BI0/9BI0 | 1.5 iv Enzymes |
Some boards number their practical activities, and those lists were read here from the same specifications as the headings above. This investigation is numbered on them as:
- AQA 7401/7402 required practical 1
- OCR Biology A H020/H420 PAG 4
- Pearson Edexcel Biology A (Salters-Nuffield) 8BN0/9BN0 core practical 4
- Pearson Edexcel Biology A (Salters-Nuffield) 8BN0/9BN0 core practical 12
- Pearson Edexcel Biology B 8BI0/9BI0 core practical 1
The other qualifications above are matched by specification heading only, because none of them numbers an activity that is this investigation. Use your awarding organisation’s current specification and its practical handbook as the authority on which activities your course requires and how they are assessed.
The principle
Casein makes a milk-powder suspension cloudy. Trypsin hydrolyses it to soluble peptides, so the suspension clears and its absorbance falls.
Trypsin is a protease: it catalyses the hydrolysis of peptide bonds inside a polypeptide chain. The colorimeter shines light of one colour through the cuvette and reports how much fails to reach the detector. The cloudier the suspension, the higher the reading, so the gradient of absorbance against time measures how fast casein is being broken down. Absorbance has no unit, so the rate is in s⁻¹.
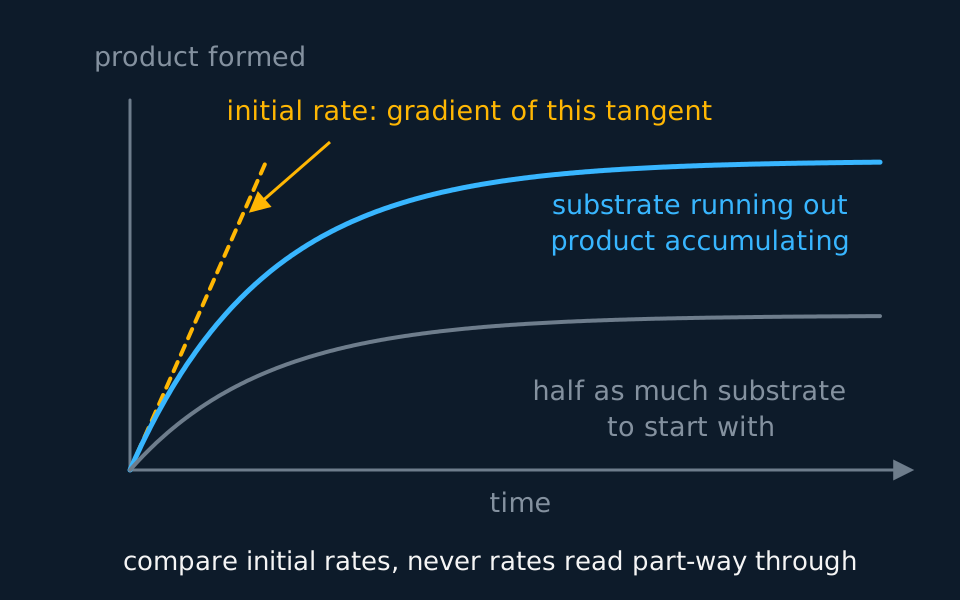
The gradient falls throughout a run, because the casein is being used up. Only the gradient at t = 0, the initial rate, reflects the conditions that were set. A gradient taken later also reflects how much substrate happened to be left.
Temperature acts on the rate in two opposite directions. Warmer molecules move faster, so trypsin and casein collide more often and more enzyme–substrate complexes form each second. Above the optimum, the hydrogen and ionic bonds that hold the tertiary structure break, the active site changes shape, and the enzyme is denatured. The first effect is gradual and the second is fast, which is why the curve rises slowly and falls steeply.
- Initial rate
- The rate of a reaction at the moment it starts, found as the gradient of the tangent to the progress curve at t = 0.
- Temperature coefficient, Q10
- The rate at a temperature 10 °C higher divided by the rate at the lower temperature.
- Denaturation
- A permanent change in the tertiary structure of a protein, which in an enzyme changes the shape of the active site.
Apparatus
- Skimmed milk powder suspension in pH 8 buffer, made up as one batch for the whole session
- Trypsin solution, 1%, and the same pH 8 buffer for diluting it
- A colorimeter, cuvettes with lids or film to cover them, and one filter used for every reading
- Water baths at 20, 25, 30, 35, 40, 50 and 60 °C, or one bath reset between runs, and a thermometer
- Syringes or graduated pipettes, 1 cm³ and 5 cm³
- Test tubes, a rack and a stopwatch
- A boiling water bath for the boiled-trypsin control
- Eye protection
Safety
Risk assessment. Enzymes can cause allergic reactions, especially as powders: avoid raising dust and wash off splashes. Anyone allergic to milk says so beforehand. Iodine solution stains skin and clothing. Wear eye protection, lift tubes from a hot bath with a holder, and keep cables clear of the water. Check the CLEAPSS Hazcard for each substance and your school's risk assessment before starting; where they differ from this page, follow them.
Variables
Independent variable
Temperature, set by the water bath and checked with a thermometer in a tube of water standing beside the reaction tubes. Seven values: 20, 25, 30, 35, 40, 50 and 60 °C. The 25 °C and 35 °C runs are there so that Q10 can be calculated from a pair 10 °C apart below the optimum.
Dependent variable
The initial rate of hydrolysis: the gradient of the tangent to the absorbance–time curve at t = 0, with the minus sign dropped, since absorbance falls and the rate is how fast it falls. The unit is s⁻¹, or absorbance units per second.
Control variables
- The volumes. 2.0 cm³ of milk suspension and 2.0 cm³ of trypsin solution in every run, measured by syringe.
- The concentrations. One stock of trypsin, diluted once to 0.5%, and one batch of milk suspension, stirred before each volume is drawn.
- pH. Both made up in the same pH 8 buffer, because hydrolysis can change the pH and the rate depends on it.
- The time in the bath. Ten minutes for every pair of tubes, at every temperature, because above the optimum the enzyme denatures while it waits.
- The colorimeter. One filter, and the instrument zeroed on the same blank, for every reading.
Method
Preparing the solutions and the colorimeter
- Make the milk suspension and the trypsin solution in the same buffer, for example pH 8. Hydrolysis can change the pH; the buffer holds it constant.
- Make the trypsin 0.5% by diluting 5 cm³ of the 1% stock to 10 cm³ with buffer, and make enough of it, and of the milk, for every run in the session.
- Zero the colorimeter with buffer and trypsin but no milk, and keep one filter throughout. The reading is then the cloudiness of the milk alone.
- Boil 3 cm³ of the trypsin in a water bath for 5 minutes and cool it to the test temperature. Set aside a tube of buffer to use in place of trypsin as well.
- Boiled trypsin, cooled to the test temperature, shows that clearing needs active enzyme. Buffer in place of trypsin shows whether the milk clears or settles by itself.
Running one temperature
- Stand the milk and the trypsin in separate tubes in the water bath for 10 minutes, and check each with a thermometer. Both start at the test temperature, so the reaction does too.
- Mix fixed volumes by syringe, start the stopwatch as they mix, and read the absorbance every 30 s for 5 minutes. Close early readings fix the shape of the curve near t = 0, where the tangent is drawn.
- Cover the cuvette and invert it once before each reading, so that settled milk does not pass for hydrolysed milk, and stand it back in the bath between readings.
- Run the boiled-trypsin tube and the buffer-only tube in the same way at the same temperature.
Describe the drawing
A graph of product formed against time. The upper cyan curve rises steeply from the origin, bends over and flattens into a plateau. A dashed amber straight line touches it at the origin and runs above it everywhere else, marking the initial rate. A lower grey curve made with half the substrate has the same shape but levels off at a lower plateau.
The other temperatures, and the rate from each curve
- Repeat the run three times at each temperature, with fresh solutions each time. Work through the temperatures in a random order, not from cold to hot, so that anything drifting through the session is not mistaken for the effect of temperature.
- Plot absorbance against time for each run, draw a smooth curve, rule the tangent at t = 0 and take its gradient.
- Take the mean of the repeats at each value. A repeat far from the others is an anomaly: look for a cause, such as a late start, leave it out of the mean and say so.
- Without a colorimeter, keep the tube in the bath in front of a card marked with a cross, and time until the cross can be seen through the mixture.
Sample data
The rates below are idealised. They were computed from a model of the relationship rather than measured, so that the analysis can be worked without scatter in the way, and the 25 °C and 35 °C values are the ones the lesson works. Real readings scatter, and each value stands for the mean of three runs. None of it is a record of an experiment.
| Temperature / °C | Initial rate / 10⁻³ s⁻¹ | Q10, from this temperature to 10 °C above it |
|---|---|---|
| 20 | 1.5 | 2.1 |
| 25 | 2.1 | 2.1 |
| 30 | 3.1 | 1.9 |
| 35 | 4.5 | not run at 45 °C |
| 40 | 5.9 | 0.66 |
| 50 | 3.9 | 0.13 |
| 60 | 0.5 | not run at 70 °C |
The 35 °C row comes from one curve. The absorbance fell from 0.80 at mixing to 0.68 at 30 s, 0.59 at 60 s, 0.47 at 120 s and 0.33 at 300 s. A tangent ruled at t = 0 passes through (0, 0.80) and (100, 0.35).
Gradient = (0.35 − 0.80) ÷ 100 = −0.0045 s⁻¹.
So the initial rate is 0.0045 s⁻¹, which is 4.5 × 10⁻³ s⁻¹ in the table. The mean rate over the whole run is (0.80 − 0.33) ÷ 300 = 0.0016 s⁻¹, about a third of the initial rate, because casein was being used up from the first second.
Q10 from 25 °C to 35 °C is 4.5 ÷ 2.1 = 2.1, and from 20 °C to 30 °C it is 3.1 ÷ 1.5 = 2.1. From 30 °C to 40 °C it is 5.9 ÷ 3.1 = 1.9.
The boiled-trypsin tube held its absorbance at 0.80 for the whole 5 minutes. The buffer-only tube fell by 0.02 as the milk settled, which is small beside the fall of 0.47 at 35 °C but is the reason the cuvette is inverted before each reading.
Reading the graph
Plot the initial rate on the vertical axis against temperature on the horizontal axis, and join the points with a smooth curve rather than straight lines. No temperature between two points was run, and a curve is the better estimate of what happens there.
The rise. From 20 °C to 40 °C the rate rises, roughly doubling for each 10 °C: Q10 is 2.1 over the two lower ranges. More kinetic energy means more frequent collisions between trypsin and casein, so more enzyme–substrate complexes form each second.
The optimum. The highest rate measured is at 40 °C. The true optimum lies between 35 °C and 50 °C, and these readings cannot place it more closely, because nothing between 40 °C and 50 °C was run. Runs at 42, 44, 46 and 48 °C would narrow it.
The fall. Above the optimum the rate drops from 5.9 × 10⁻³ s⁻¹ at 40 °C to 0.5 × 10⁻³ s⁻¹ at 60 °C. Hydrogen and ionic bonds holding the tertiary structure break, the active site changes shape and fewer complexes can form. Draw the curve asymmetric, with a gradual rise and a steep fall.
Q10 and where to take it. Q10 falls from 2.1 to 1.9 between the lower ranges and the 30 °C to 40 °C range, because some trypsin is already being denatured during the ten minutes at 40 °C. A Q10 is a statement about the kinetic effect alone, so it is taken from a pair of temperatures below the optimum.
Use temperatures below the optimum, where denaturation during the run is negligible.
Evaluation
Each of these is a real source of error in this investigation, and the middle column is the part an answer earns marks for: what it does to the result, and in which direction.
| Source of error | What it does to the result | What to do about it |
|---|---|---|
| A tangent ruled by eye | Two people rule different tangents to the same curve, so the initial rate scatters in either direction. The error is largest where the curve bends most sharply near t = 0, which is at the fastest runs. | Read every 10 s for the first minute so the start of the curve is well defined, or fit the curve on a computer and take its gradient at t = 0. |
| Delay between mixing and the first reading | Some casein has gone before the first reading, so the start of the curve is missing and the tangent drawn from what is left is shallower than the true one. The initial rate comes out too low, by most at the fastest runs. | Start timing on mixing; use a data logger |
| The cuvette cools or warms outside the bath | Readings are taken nearer room temperature than bath temperature, so the hot runs read too slow and the cold runs too fast. The curve is flattened and the Q10 calculated from it is too low. | Read quickly, return the tube to the bath between readings, and check the temperature at the end |
| Milk powder settles | The absorbance falls with no hydrolysis, so every rate comes out too high, by the largest share at the slowest runs, where settling is a bigger part of the change. | Invert the cuvette before each reading; the no-enzyme tube shows the size of the effect |
| Trypsin denatures while equilibrating at 50 or 60 °C | Part of the enzyme is denatured before the milk goes in, so the rate measured is below the rate at the moment the mixture reached that temperature, and the fall above the optimum looks steeper than it is. | Equilibrate for the same time at every temperature, and no longer than the mixture needs |
| Cloudiness is not a concentration | The reading measures how much light the suspension stops, not the amount of casein left, so the rate is in absorbance units per second and not in moles per second. Rates compare fairly with each other within one method. | Quote the rate in the unit it was measured in, and compare rates only between runs made with the same milk, filter and colorimeter. |
Questions
Question 1 (2 marks)
Explain why the milk and the trypsin stand in the water bath in separate tubes for 10 minutes before they are mixed.
Check your answer
so that both reach the test temperature before the reaction starts;
if they were mixed first, the reaction would begin at a different temperature, so the initial rate would not be the rate at the temperature recorded.
Question 2 (2 marks)
At 35 °C the tangent to the absorbance–time curve at t = 0 passes through (0, 0.80) and (100, 0.35). Calculate the initial rate and give its unit.
Check your answer
gradient = (0.35 − 0.80) ÷ 100 = −0.0045;
initial rate = 0.0045 s⁻¹ (4.5 × 10⁻³ s⁻¹, or absorbance units per second).
Question 3 (3 marks)
Use the table to calculate Q10 between 30 °C and 40 °C, and explain why it is lower than Q10 between 20 °C and 30 °C.
Check your answer
Q10 = 5.9 ÷ 3.1 = 1.9;
at 40 °C some of the trypsin is denatured while it equilibrates and while the reaction runs;
so the rate at 40 °C is lower than the kinetic effect alone would give, and the ratio is smaller than the 2.1 found between 20 °C and 30 °C.
Question 4 (2 marks)
Explain why the initial rate is used, and not the mean rate over the whole 5 minutes.
Check your answer
the rate falls during the run as casein is used up and its concentration falls;
only the rate at t = 0 reflects the conditions that were set; a mean over the run also depends on how much substrate was left (accept: at 35 °C the mean, 0.0016 s⁻¹, is about a third of the initial rate).
Question 5 (3 marks)
One tube contains trypsin that was boiled and cooled to 35 °C. State what this tube shows, and explain the result expected.
Check your answer
it shows that the clearing needs active enzyme (and is not caused by the conditions alone);
boiling denatures trypsin, so the active site changes shape and no enzyme–substrate complexes form;
so the absorbance stays at its starting value, about 0.80.
Coverage maps are available for AQA 7401/7402, OCR Biology A H020/H420, Cambridge International 9700, Pearson Edexcel Biology A (Salters-Nuffield) 8BN0/9BN0 and Pearson Edexcel Biology B 8BI0/9BI0. Use the relevant route map to check what InkBiology covers, and your awarding organisation’s current specification as the final authority on examinable content.