Biology › Scientific method and quantitative biology › Handling data: units, scales, rates and uncertainty
Handling data: units, scales, rates and uncertainty
Most quantitative work in biology comes down to four habits: carrying the unit through every line, knowing where the significant figures came from, reading a gradient by construction, and stating the uncertainty in a result. All four are worked through here.
Before this Standard form and indices from GCSE mathematics · Plotting a line graph with a suitable scale
COMMON MISCONCEPTION
You give your answer to the same number of decimal places as the numbers in the question.
Significant figures, not decimal places. A leaf measured at 43 mm has two significant figures; written as 0.043 m it has three decimal places and still two significant figures, because changing the unit cannot improve the ruler.
What you should be able to do
- Convert between units across the prefixes biology uses, and write very large and very small quantities in standard form.
- Give an answer to a number of significant figures justified by the measurements it came from.
- Calculate a percentage change and a percentage change relative to a stated reference value, and say which one a question requires.
- Find a rate as a gradient, including by drawing a tangent to a curve, and state its units.
- Explain why a logarithmic scale is used for population size and for pH, and read a value off one.
- Find the percentage uncertainty in a measurement and combine uncertainties through a calculation.
Units, prefixes and the ladder biology lives on
Biology spans about nine factors of ten between a membrane and a person, and it handles that span with prefixes rather than with long strings of zeros. Every prefix is a power of ten and every conversion is a multiplication, so the only thing that can go wrong is the direction.
| Prefix | Symbol | Multiplier | Where you meet it |
|---|---|---|---|
| giga | G | 10⁹ | Base pairs in the human genome, about 3 Gb |
| mega | M | 10⁶ | Base pairs in a bacterial genome |
| kilo | k | 10³ | Kilojoules, kilopascals |
| deci | d | 10⁻¹ | dm³, which is a litre |
| centi | c | 10⁻² | cm³, marked on every syringe |
| milli | m | 10⁻³ | mm, mg, mmol |
| micro | µ | 10⁻⁶ | µm for cells and organelles |
| nano | n | 10⁻⁹ | nm for membranes and ribosomes |
1 mm = 1000 µm 1 µm = 1000 nm 1 dm³ = 1000 cm³three conversions carry most of the marks in this topic
The habit that stops errors is writing the unit on every line of working rather than only on the answer: if the units either side of an equals sign do not match, you have found the mistake before the marker did. It also catches conversions done backwards. A micrometre is smaller than a millimetre, so a length in micrometres is a bigger number, and a conversion that made the number smaller went the wrong way.
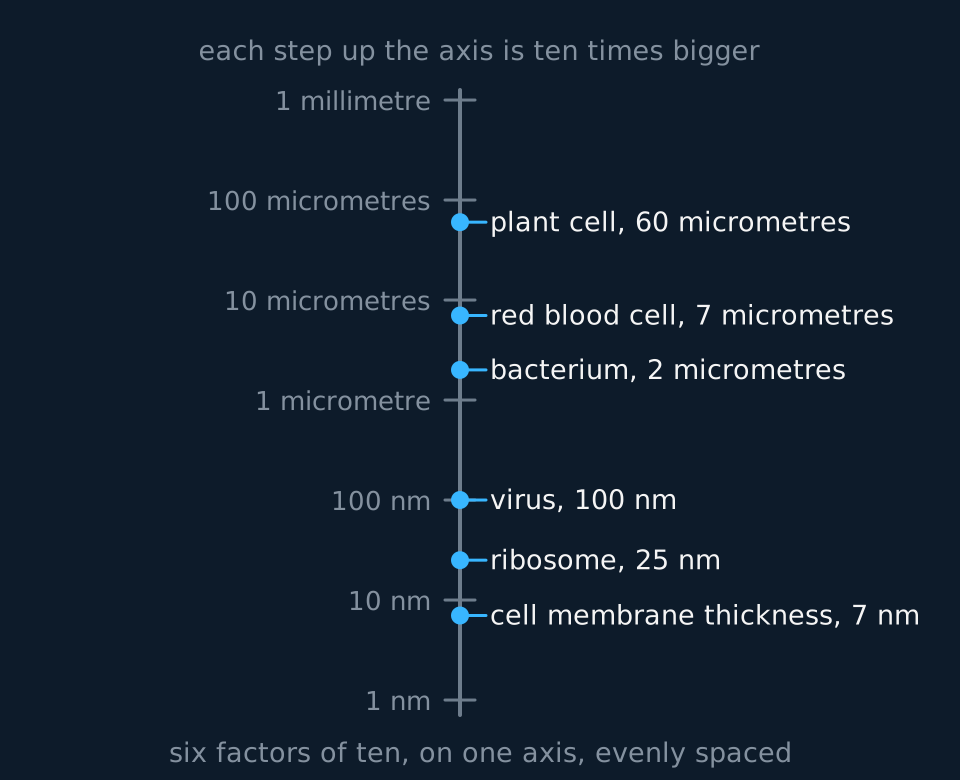
Describe the drawing
A vertical axis marked at seven equally spaced ticks running from one nanometre at the bottom to one millimetre at the top, each tick a factor of ten above the one below it. Six biological structures are marked along it at their own sizes: a membrane, a ribosome, a virus, a bacterium, a red blood cell and a plant palisade cell.
Standard form writes anything very small or very large as a value between 1 and 10 multiplied by a power of ten: 0.000 007 m becomes 7 × 10⁻⁶ m, and 128 000 becomes 1.28 × 10⁵. Two things go wrong with it. The first digit must lie between 1 and 10, so 12 × 10⁴ is the right size and not standard form. And a negative index means a small number, not a negative one. 10⁻⁶ is a millionth.
Getting a length into the unit an answer wants
A ribosome measures 25 nm across. Express this in micrometres, and in metres in standard form.
Show the working
Nanometres to micrometres is a division by 1000, because a micrometre is a thousand times bigger: 25 ÷ 1000 = 0.025 µm. Micrometres to metres is another division by a million, giving 0.000 000 025 m.
In standard form that is 2.5 × 10⁻⁸ m. Count the places the point moved, which is eight, and check the sign: the number is small, so the index is negative.
Then check it against the ladder. A ribosome should land between a molecule at 10⁻⁹ m and a bacterium at 10⁻⁶ m, and it does.
Where significant figures come from
A calculator gives you ten digits. The measurement gave you two or three, and writing down the ten is a claim about your apparatus that is not true. The number of significant figures records how finely you measured.
Start with the instrument. A metre rule reads to the nearest millimetre, so a leaf measured as 43 mm is known to two significant figures and one measured as 143 mm to three. A balance reading 4.20 g has three, and the trailing zero is significant because the balance printed it. Writing 4.2 g throws away information you were given.
- Significant figures
- The digits in a measurement that carry information about its size, counted from the first non-zero digit.
- Leading zeros
- Never significant. 0.0043 has two significant figures, because the zeros only locate the decimal point.
- Trailing zeros after a decimal point
- Always significant. 4.20 has three, and says the hundredths digit was measured.
The rule for multiplying and dividing is that the answer carries the same number of significant figures as the least precise measurement that went into it, so a rate found by dividing a volume known to two figures by a time known to four is known to two. Adding and subtracting follow a different convention: the result keeps the decimal places, or absolute resolution, of the least resolved measurement rather than its significant figures. Round at the end rather than in the middle, because rounding twice drags the answer away from where it belongs. Two things sit outside the rule. Exact numbers impose no limit at all, such as the 100 in a percentage or the number of discs you counted, and an instruction in the question about how many figures to give always wins.
Decimal places are a different count. Measure a leaf at 43 mm with a millimetre rule and you have two significant figures; write the same measurement in metres and it becomes 0.043 m, which has three decimal places and still two significant figures, because moving the point cannot improve the ruler. Significant figures record how well you measured. Decimal places record which unit you happened to use.
Where the figures come from
A student collects 24 cm³ of oxygen in 20 s. Calculate the rate of oxygen production to an appropriate number of significant figures.
Show the working
Rate is volume over time: 24 ÷ 20 = 1.2 cm³ per second. The volume and the time each carry two significant figures, so the answer is entitled to two: 1.2 cm³ s⁻¹.
Had the syringe read 24.0 cm³ and the clock 20.0 s, both would carry three and the answer would be written 1.20 cm³ s⁻¹, the same number making a stronger claim, which is what a significant figure is for.
Ratios, percentages, and telling the two percentages apart
A ratio compares two quantities of the same kind by division, and because the units cancel it has none of its own. That single fact is why magnification is written ×12 000 and never ×12 000 µm, and why an Rf value has no unit either.
magnification = image size ÷ actual sizeboth sizes in the same unit, always, before you divide
A magnification from a scale bar
An electron micrograph carries a scale bar labelled 2 µm. The bar measures 25 mm on the page. A mitochondrion in the same image measures 30 mm along its long axis. Calculate the magnification of the micrograph and the actual length of the mitochondrion.
Show the working
Put both lengths into the same unit first: the scale bar is 25 mm on the page, and 25 mm = 25 000 µm.
The bar is the one object whose real length you know, so use it: magnification = 25 000 ÷ 2 = ×12 500, with no unit after it.
For the mitochondrion, actual = image ÷ magnification. Its image is 30 mm = 30 000 µm, so 30 000 ÷ 12 500 = 2.4 µm.
Under time pressure there is a shortcut. The mitochondrion is 30/25 = 1.2 times as long as the bar, and the bar is 2 µm, so it is 1.2 × 2 = 2.4 µm: the same answer, and one fewer place to drop a factor of a thousand.
The two percentages are different calculations answering different questions.
percentage change = (final − initial) ÷ initial × 100the denominator is where you started, and the sign is part of the answer
percentage change relative to a reference value = (difference between the two) ÷ (the reference value) × 100state which value was used as the reference
Percentage change follows one thing over time. Keep the sign: a chip that loses mass has changed by −10%, and writing 10% throws away the direction the investigation was about.
Comparing two separate values depends on which is used as the denominator. If a treated group has a mean of 24 and a control 20, the treated group is 20% higher than the control while the control is 16.7% lower than the treated group. Both figures are correct and they answer different questions, so state which value was the reference and use the control where there is one. For a symmetric percentage difference between two values, divide the absolute difference by their mean and multiply by 100. If the examination paper supplies a formula, use that convention.
Notice what the percentage adds. A chip going from 4.20 g to 3.78 g lost 0.42 g and a second going from 6.30 g to 5.67 g lost 0.63 g, which looks worse, and yet both changed by −10.0%. The two chips behaved identically, and only the percentage says so.
Rates are gradients
A rate is a change in something divided by the time it took, so its unit always ends in 'per unit time' and its value is always a gradient on a graph of that something against time. Both halves of that sentence are examined.
rate = change in the quantity ÷ time takenunits: cm³ s⁻¹, mg min⁻¹, bubbles per minute, arbitrary units per second
On a straight line the gradient is the rate, and any two points give it. Take them far apart, since a triangle spanning most of the line is read more accurately than a small one, and take the values off the axes rather than counting squares. On a curve the gradient changes from moment to moment and you need a tangent: a straight line touching the curve at the point of interest and running along it rather than cutting across it. The gradient of the tangent is the rate at that instant.

Describe the drawing
The tangent construction built four times on the same curve of oxygen collected against time. First a dashed straight line joins the first and last points, giving an average rate over the whole run. Then a tangent is drawn touching the curve at time zero, with a dashed right-angled triangle beneath it showing a rise of 18 cubic centimetres over a run of 20 seconds, a gradient of 0.90 cubic centimetres per second. The same construction is repeated at 20 seconds and at 50 seconds, where the tangent is visibly shallower and the gradients are 0.49 and 0.20 cubic centimetres per second.
The initial rate matters more than any other in enzyme work, and the reason is worth writing out in an answer. At t = 0 the substrate concentration is the one you chose, the product concentration is zero and nothing the enzyme made has inhibited it yet. Every later gradient reflects the conditions you set and how much substrate has since been used up, so a rate measured at three minutes measures two things at once.
A gradient from a tangent
A tangent drawn to the curve above at t = 0 rises by 18 cm³ over a run of 20 s. Calculate the initial rate and state its units.
Show the working
Gradient is rise over run: 18 ÷ 20 = 0.90 cm³ s⁻¹. Take both from the axes rather than the paper. A run measured in centimetres of graph paper means nothing.
The same construction at t = 50 s gives 4.0 cm³ over 20 s, or 0.20 cm³ s⁻¹, under a quarter of the initial rate because by then most of the substrate is gone. Neither number is wrong; they describe different moments.
There is a second route, used whenever the thing you can measure is a time. Time an amylase reaction until the iodine stops going blue-black, or a catalase-soaked paper disc until it floats, and the rate is 1 ÷ t, in units of per second. It works because the same amount of reaction has happened in every trial, so a shorter time is a faster reaction. Plot 1 ÷ t rather than the time itself: a graph of time against temperature is inverted relative to a graph of rate against temperature, so a graph of time described as a graph of rate states the opposite of what it shows.
Why the axis is sometimes logarithmic
Two quantities in biology span so many factors of ten that a linear axis cannot show them, and both get a logarithmic one. On a logarithmic axis, equal distances represent equal multiplications rather than equal additions, so the steps 1, 10, 100, 1000 are evenly spaced.
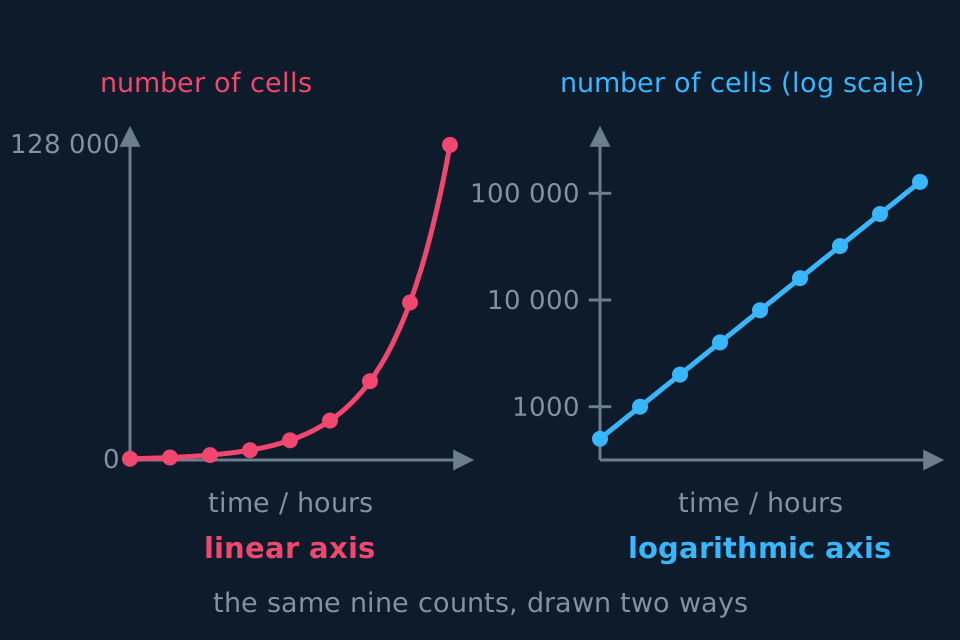
Describe the drawing
Two graphs side by side of the same bacterial counts taken every hour for eight hours. On the left the vertical axis is linear and the plotted points hug the bottom of the graph for five hours before rising almost vertically. On the right the vertical axis is logarithmic and the same points lie on a straight line of constant gradient.
Population growth is the first case. A population doubling every hour from 500 cells reaches 128 000 in eight hours, and on a linear axis the first five hours lie flattened against the baseline where nothing can be read from them. Take the logarithm and the curve becomes a straight line, because each hour multiplies the population by the same factor and so adds the same amount to the logarithm. That the line is straight is itself the evidence that growth was exponential.
pH is the second, and it catches people out because the logarithm has a minus sign in front of it.
pH = −log₁₀[H⁺]so a lower pH means a higher hydrogen ion concentration
Each whole pH unit is a factor of ten in hydrogen ion concentration. Moving a buffer from pH 7 to pH 5 does not double anything; it multiplies the hydrogen ion concentration by a hundred, which is why an enzyme can be untouched at pH 7 and denatured at pH 5, and why describing that change as 'a small change in pH' in an answer is wrong. The stomach at pH 2 holds a hydrogen ion concentration more than a hundred thousand times that of blood plasma at pH 7.4.
TRY IT: Reading a log axis
A culture is plotted with the logarithm to base 10 of the cell count on the vertical axis. The line is straight and rises from 3.0 at 0 hours to 6.0 at 10 hours. State the cell count at the start and at the end, and calculate how many times the population multiplied.
Check your answer
A logarithm of 3.0 means 10³, so the count started at 1000 cells, and 6.0 means 10⁶, so it finished at 1 000 000. The population multiplied 1000 times.
Notice the arithmetic. The logarithm rose by 3, and a rise of 3 on a log scale is a multiplication by 10³: subtracting on a log axis is dividing on the real one, which is the whole reason the axis is worth the trouble.
The line being straight adds something. The growth factor was constant across all ten hours, so nothing limited growth in that period.
Uncertainty, and how it travels through a calculation
Every measurement has an uncertainty: a range within which the true value lies. It is not a mistake.
For a single reading off a scale, the uncertainty is usually taken as half the smallest division, so a millimetre rule gives ±0.5 mm. But a length is two readings, one at each end, so a measured length carries ±1 mm, and the same doubling applies to a thermometer read before and after or a burette read at start and finish. A digital instrument is quoted to its last displayed digit: a balance showing 4.20 g carries ±0.01 g.
percentage uncertainty = uncertainty ÷ measurement × 100which is why the same instrument gives a small percentage uncertainty on a big reading and a large one on a small reading
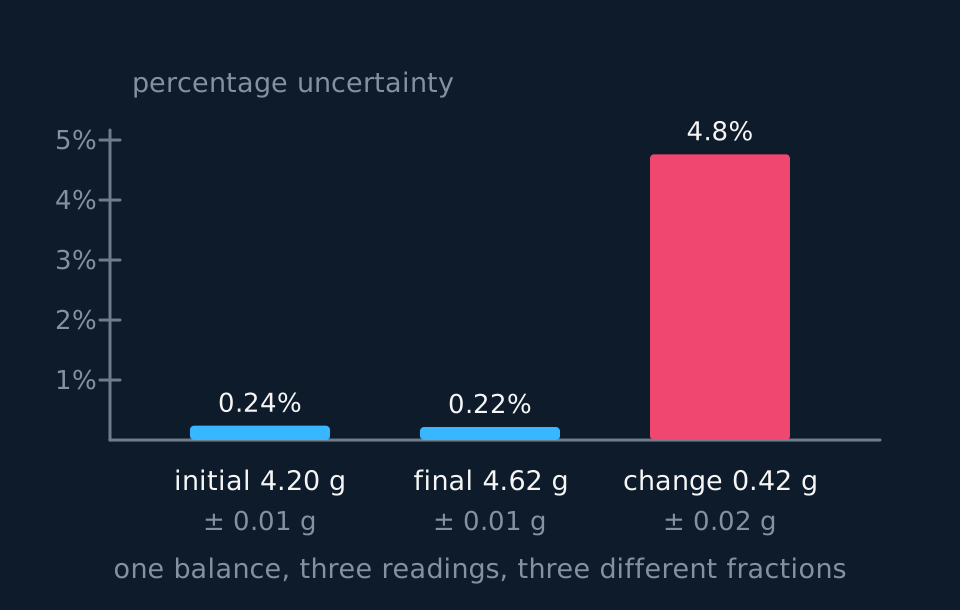
Describe the drawing
A bar chart of three percentage uncertainties against a vertical scale marked from one to five per cent. The bars for the initial and final masses are so short as to be barely visible above the baseline, while the bar for the difference between them rises to nearly five per cent, roughly twenty times as tall.
Combining uncertainties follows two rules, and which one you use depends on the arithmetic you did:
| What you did | What happens to the uncertainty | Example |
|---|---|---|
| Added or subtracted two quantities | Add the absolute uncertainties | 4.62 g ± 0.01 and 4.20 g ± 0.01 give a difference of 0.42 g ± 0.02 |
| Multiplied or divided two quantities | Add the percentage uncertainties | 24 cm³ ± 4.2% divided by 20 s ± 2.5% gives a rate carrying 6.7% |
| Multiplied by an exact number | The percentage uncertainty is unchanged | Doubling a reading doubles its absolute uncertainty and leaves the percentage alone |
The subtraction rule is the one with teeth: subtracting two similar numbers keeps the whole of both uncertainties and throws away most of the value. That is why a percentage change built on a small mass change is far shakier than either weighing was, and why an osmosis investigation is designed with a long enough immersion to produce a change worth measuring.
Carrying an uncertainty through to a percentage change
A potato chip is weighed at 4.20 g and again, after an hour in distilled water, at 4.62 g, on a balance reading to ±0.01 g. Calculate the percentage change in mass and the uncertainty in it.
Show the working
The change is 4.62 − 4.20 = 0.42 g, and the two absolute uncertainties add: ±0.01 + ±0.01 = ±0.02 g. So percentage change = 0.42 ÷ 4.20 × 100 = +10.0%, a gain, so water entered the cells by osmosis.
Now the uncertainties. The change of 0.42 g carries 0.02 ÷ 0.42 × 100 = 4.8%. The initial mass of 4.20 g carries 0.01 ÷ 4.20 × 100 = 0.24%. The two were divided, so the percentages add: 4.8 + 0.24 ≈ 5.0%.
5.0% of 10.0 is 0.5, so the result is +10.0% ± 0.5: a chip that gained between 9.5% and 10.5% of its mass. Two weighings each good to a quarter of one per cent gave an answer good only to five per cent, and the subtraction is where it went.
One last habit. When a calculation is finished, ask whether the answer is the right size for the living thing in the question. A cell 2 mm across, a healthy adult human with a resting heart rate of 400 beats per minute (a shrew's heart genuinely beats that fast; a person's does not), a respiration rate that would consume a mouse's body mass in oxygen every hour. An order-of-magnitude check catches slips like these.
In the exam
- Write the unit on every line of working, not only on the answer. Unit conversions are the commonest source of error by a factor of a thousand, and units in the working reveal them.
- 'An appropriate number of significant figures' means matching the least precise measurement in the question, and you may be asked to justify it.
- For percentage change the denominator is the starting value and the sign is part of the answer; when comparing two separate values, state the reference value used.
- For a tangent, show the construction: the line touching the curve, the triangle marked, and rise and run read off the axes. A number alone does not show the method.
- Rate as 1 ÷ t has units of s⁻¹ or min⁻¹ and its graph is the opposite way up from a graph of the time. Say which you plotted.
- On a log axis a difference of 1 is a factor of 10 and a difference of 3 a factor of 1000. Bacterial growth and pH questions test exactly that.
- Percentage uncertainties add when you multiply or divide; absolute uncertainties add when you add or subtract.
Check yourself
A student measures the length of the coleoptile of ten seedlings with a millimetre rule, before and after three days of growth in the dark. One seedling measures 18 mm at the start and 27 mm at the end. Calculate the percentage change in length, the mean growth rate in mm per day, and the percentage uncertainty in the percentage change. State the answers to a sensible number of significant figures.
Answer
Percentage change: 27 − 18 = 9 mm, and 9 ÷ 18 × 100 = +50%, to two significant figures because both measurements carry two. Growth rate: 9 mm over 3 days = 3.0 mm per day, and the 3 days is counted rather than measured so it imposes no limit on the figures.
Uncertainty: a millimetre rule read at both ends gives ±1 mm on each length, so the difference of 9 mm carries ±2 mm, which is 2 ÷ 9 × 100 = 22%. The initial 18 mm carries 1 ÷ 18 × 100 = 5.6%. The two were divided, so the percentages add to about 28%.
The percentage change is therefore 50% ± 14 percentage points, somewhere between about 36% and 64%. That is a startlingly wide answer from two tidy-looking measurements, and it shows what to change: leaving the seedlings a week rather than three days gives a bigger difference and shrinks the percentage uncertainty without touching the ruler. Taking a mean of ten seedlings helps too, though it does nothing about a rule misread the same way every time.
Questions
Question 14 marks
A potato chip is weighed at 5.00 g, left in a sucrose solution for an hour and weighed again at 4.60 g, on a balance reading to plus or minus 0.01 g. Calculate the percentage change in mass, and calculate the percentage uncertainty in that percentage change.
Mark scheme
- M1 change in mass = 4.60 − 5.00 = −0.40 g, and because the two masses were subtracted the absolute uncertainties add to give plus or minus 0.02 g
- A1 percentage change = −0.40 ÷ 5.00 × 100 = −8.0 per cent, the sign showing that the chip lost mass
- M1 percentage uncertainty in the change = 0.02 ÷ 0.40 × 100 = 5.0 per cent, and in the initial mass = 0.01 ÷ 5.00 × 100 = 0.20 per cent
- A1 the two were divided, so the percentage uncertainties add: about 5.2 per cent
Question 24 marks
A bacterial culture is counted every hour for ten hours and the counts are plotted with the logarithm to base 10 of the count on the vertical axis. Explain why a logarithmic axis is used here, and explain what a straight line on such a plot tells you.
Mark scheme
- B1 a population that multiplies repeatedly spans several factors of ten, so on a linear axis the early counts lie flattened against the baseline where nothing can be read from them
- B1 on a logarithmic axis equal distances represent equal multiplications, so the steps 1, 10, 100 and 1000 are evenly spaced and every hour is as readable as every other
- B1 each hour multiplies the population by the same factor and therefore adds the same amount to the logarithm, so constant growth plots as a straight line
- B1 a straight line is therefore evidence that the growth factor never changed over that period, which is what exponential growth means, and a rise of 3 on the axis is a multiplication of the population by 1000
Question 34 marks
The table shows the time an enzyme-catalysed reaction took to reach a colour change at five temperatures. Calculate the mean time to the colour change at 50 °C, saying what you do with the third reading and why, and then calculate the rate of reaction at 40 °C in s⁻¹.
| Temperature / °C | Repeat 1 / s | Repeat 2 / s | Repeat 3 / s |
|---|---|---|---|
| 20 | 96 | 94 | 95 |
| 30 | 62 | 60 | 61 |
| 40 | 40 | 41 | 39 |
| 50 | 51 | 49 | 122 |
| 60 | 88 | 90 | 89 |
Mark scheme
- M1 identifies 122 s as an anomaly, because it is more than twice either of the other two readings at that temperature while every other set agrees within 2 s
- A1 excludes it and gives the mean of 51 and 49, which is 50 s
- M1 rate = 1 ÷ mean time; the mean at 40 °C is (40 + 41 + 39) ÷ 3 = 40 s
- A1 1 ÷ 40 = 0.025 s⁻¹
Question 44 marks
A treated group of seedlings has a mean height of 24 cm and a control group has a mean height of 20 cm. Calculate the percentage by which the treated group is taller than the control group, and calculate the percentage by which the control group is shorter than the treated group, using each one as its own reference value.
Mark scheme
- M1 difference between the means = 24 − 20 = 4 cm
- A1 treated relative to control: 4 ÷ 20 × 100 = 20% taller
- M1 control relative to treated: 4 ÷ 24 × 100, using a different reference value
- A1 = 17% shorter
Question 54 marks
A student measures an electron micrograph with a ruler. Its scale bar, labelled 500 nm, comes to 20 mm, and a ribosome in the same image comes to 1.0 mm across. Calculate the magnification the image was printed at, and calculate the actual diameter of the ribosome in nanometres.
Mark scheme
- M1 converts the scale bar's page length to the same unit as its labelled length: 20 mm = 20 000 000 nm
- M1 magnification = image size ÷ actual size = 20 000 000 ÷ 500 = ×40 000, with no unit
- M1 converts the ribosome's image size to the same units: 1.0 mm = 1 000 000 nm, then actual = image ÷ magnification
- A1 1 000 000 ÷ 40 000 = 25 nm, matching the expected size of a ribosome
Question 63 marks
A student collects 24 cm³ of gas in 20.0 s and writes the rate as 1.2 cm³ s⁻¹. Explain why the answer is given to two significant figures, and explain why counting the decimal places in the measurements is the wrong guide.
Mark scheme
- B1 an answer carries the same number of significant figures as the least precise measurement that went into it, and the volume of 24 cm³ carries only two
- B1 significant figures record how finely the instrument measured, so writing more digits claims a precision the syringe never had
- B1 decimal places depend only on the unit chosen: 24 cm³ written as 0.024 dm³ has three decimal places and still two significant figures, because changing the unit cannot improve the measurement
Question 73 marks
A tangent is drawn at the start of a curve of volume of oxygen collected against time. The tangent passes through the points (0 s, 0 cm³) and (30 s, 18.0 cm³). Calculate the initial rate of oxygen production and give its unit.
Mark scheme
- M1 the rate is the gradient of the tangent, which is the rise divided by the run, with both values read off the axes rather than counted in squares of paper
- M1 rise = 18.0 − 0 = 18.0 cm³ and run = 30 − 0 = 30 s
- A1 initial rate = 18.0 ÷ 30 = 0.60 cm³ s⁻¹
Question 83 marks
An osmosis investigation reports a percentage change in the mass of a potato chip carrying a percentage uncertainty of over 30 per cent, even though the balance reads to plus or minus 0.01 g. Suggest why the uncertainty is so large, and suggest one change to the method that would reduce it.
Mark scheme
- B1 the percentage change rests on the difference between two similar masses, and subtracting keeps the whole of both absolute uncertainties while leaving only a small value behind
- B1 so the percentage uncertainty in that small difference is large even though each individual weighing was good to a fraction of one per cent
- B1 leaving the chips immersed for longer, or using a solution further from the potato's own water potential, produces a larger change in mass and shrinks the percentage uncertainty without changing the balance
Question 93 marks
An enzyme-catalysed reaction is timed to a colour change at five temperatures, three repeats each; one repeat at 50 °C (122 s, against 51 s and 49 s) was left out of the mean as anomalous. The times fall from 20 °C to 40 °C and then rise again by 60 °C. Explain what this shows about the rate of the reaction, explain how the rate column is obtained from the times and why its unit is s⁻¹, and explain why the anomalous reading should be repeated rather than simply deleted.
| Temperature / °C | Mean time / s | Rate / s⁻¹ |
|---|---|---|
| 20 | 95 | 0.0105 |
| 30 | 61 | 0.0164 |
| 40 | 40 | 0.0250 |
| 50 | 50 | 0.0200 |
| 60 | 89 | 0.0112 |
Mark scheme
- B1 a shorter time means a faster reaction, so the rate rises to its highest measured value at 40 °C and falls after it, so the optimum lies between 30 °C and 50 °C, probably near 40 °C
- B1 each rate is 1 ÷ the mean time, an amount of change per second, so its unit is s⁻¹: 1 ÷ 40 s = 0.0250 s⁻¹ at 40 °C against 1 ÷ 95 s = 0.0105 s⁻¹ at 20 °C, which is why the rates run the opposite way up from the times
- B1 deleting a reading assumes it was a mistake; repeating it tests that assumption, and if the repeat agrees with the original the result is real and the explanation has to account for it
Question 103 marks
State the number of nanometres in one micrometre, the number of micrometres in one millimetre, and the unit that a ratio, such as a magnification, is given in.
Mark scheme
- B1 1 µm = 1000 nm
- B1 1 mm = 1000 µm
- B1 a ratio has no unit at all, because the units of the two quantities cancel when one is divided by the other
Question 113 marks
A student divides a total colour-change time by exactly 6 replicate tubes to calculate a mean, and wonders whether the 6 limits how many significant figures the mean can be given. Explain why the count of 6 tubes does not limit the significant figures of the mean, and explain what does.
Mark scheme
- B1 6 is an exact, counted number rather than a measurement, so it carries no uncertainty and imposes no limit on the number of significant figures of a result
- B1 the number of significant figures is instead set by the least precise instrument used to take the actual measurements that were averaged, such as the resolution of the stopwatch
- B1 the mean should therefore be rounded to match the significant figures of the timings themselves, not the number of readings that were combined
Question 123 marks
Compare percentage change with the symmetric percentage difference between two separate values, referring to what each is calculated from and the question each one answers.
Mark scheme
- B1 percentage change tracks a single quantity over time and divides by its initial value, keeping the sign of the change, whereas percentage difference compares two separate values measured at the same time and divides by their mean
- B1 percentage change answers 'how much did this one thing change', whereas a percentage difference or comparison answers 'how do these two separate values compare'
- B1 which value is used as the reference must be stated for a comparison between two values, because comparing a treated value to a control gives a different percentage from comparing the control to the treated
Question 133 marks
A student calculates the resting heart rate of a healthy adult human from their data and obtains an answer of 400 beats per minute. Suggest why this result should immediately be recognised as an error, and suggest one likely source of the mistake in the calculation.
Mark scheme
- B1 a healthy adult resting heart rate is around 60 to 100 beats per minute, so 400 is several times too large to be plausible for this organism
- B1 an order-of-magnitude check like this catches an error without redoing the whole calculation
- B1 a likely source is a unit not converted, such as working in seconds where minutes were needed, or a value multiplied where it should have been divided
Question 143 marks
A student times how long it takes a catalase-soaked filter-paper disc to float in hydrogen peroxide solution at five different pH values. Explain how the student should calculate a rate from each time, and explain why the times themselves should not be plotted directly as if they were the rate.
Mark scheme
- B1 rate is calculated as 1 ÷ t, in a unit such as per second, because the same fixed amount of reaction, the disc floating, has happened in every trial, so a shorter time means a faster reaction
- B1 the times themselves are not the rate: plotting time directly gives a graph the wrong way up compared with a graph of rate, since a longer time would appear to mean more when it actually means slower
- B1 the correct graph, of 1/t against pH, rises where the reaction is faster and falls where it is slower, matching how a rate is normally interpreted
Question 152 marks
State what is meant by the resolution of a measuring instrument, and state the uncertainty carried by a single reading taken from a millimetre rule.
Mark scheme
- B1 resolution is the smallest change an instrument can register, such as 1 mm on a metre rule or 0.01 g on a two-decimal-place balance
- B1 a single reading off a scale is taken as half the smallest division, so plus or minus 0.5 mm
Worth remembering
- Carry the unit through every line; the mismatch is the error message.
- Significant figures come from the instrument, and the answer takes the fewest that went into it.
- A ratio has no units, so magnification never has one.
- Percentage change divides by where you started, and keeps its sign.
- A rate is a gradient; on a curve it is the gradient of a tangent, and the initial rate is the tangent at t = 0.
- Equal distances on a log axis mean equal multiplications, and one pH unit is a factor of ten.
- Absolute uncertainties add when you add or subtract; percentage uncertainties add when you multiply or divide.
CHECK YOUR PROGRESS
Rate how confident you are with each objective for this lesson. Ratings are saved in this browser, on this device, unless you sign in.
- Convert between units across the prefixes biology uses, and write very large and very small quantities in standard form.
- Give an answer to a number of significant figures justified by the measurements it came from.
- Calculate a percentage change and a percentage change relative to a stated reference value, and say which one a question requires.
- Find a rate as a gradient, including by drawing a tangent to a curve, and state its units.
- Explain why a logarithmic scale is used for population size and for pH, and read a value off one.
- Find the percentage uncertainty in a measurement and combine uncertainties through a calculation.
Open the full revision checklist to see every objective in the curriculum in one place.
Practise this lesson
WORKBOOK
The written questions from this topic, on paper with room to work, and a separate book of mark schemes. The 2 questions that are set on a diagram stay on this page, where the diagram can be drawn. Free to use; please do not redistribute or sell.
Used later in Microscopy, magnification and resolution