Maths › Decision Mathematics 1 › Float, Gantt charts and scheduling
Float, Gantt charts and scheduling
Once the critical path is known, everything else has room to move. Float measures how much, a Gantt chart shows it, and a resource histogram shows how many workers are needed at each moment. Splitting the float in two says how much of that room is an activity's own and how much of it is borrowed from a neighbour further along the chain.
Builds on Critical path analysis and Algorithms, sorting and bin packing.
IN THIS TOPIC
- Calculate the total float of every activity.
- Find the latest start and earliest finish of an activity, and split its float into the independent and interfering parts.
- Draw a Gantt chart showing floats, and read simultaneous activities from it.
- Draw a resource histogram, find the lower bound on workers, and schedule.
COMMON MISCONCEPTION
If two activities each have three days of float, both can be delayed by three days without affecting the project.
Total float is shared along a chain, so two activities on the same path cannot both spend it: use all of it on the first and none is left for the second. Independent float is the part an activity can spend with nothing else moving, and where two activities sit one behind the other each may show the whole three days while none of it is independent.
How much slack there is
The total float of an activity is its latest finish minus its earliest start minus its duration, which comes to the same thing as the difference between its latest and earliest starts. Critical activities have zero float by definition.
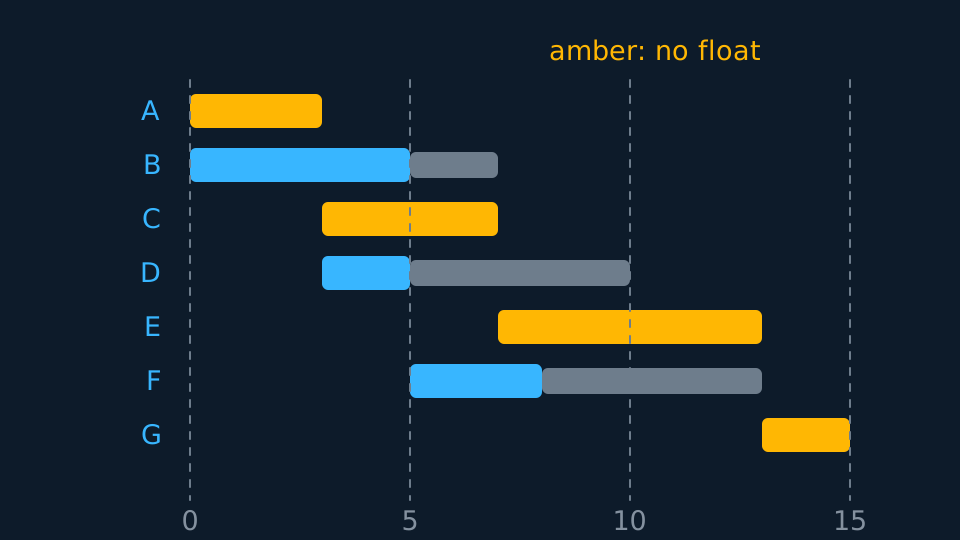
Float is shared along a chain: two activities on the same path may each show three days, but spend all three on the first and there is none left for the second. The floats are not independent, and a Gantt chart is exactly the picture that makes the sharing visible.
WORKED EXAMPLE
Floats for the project
For the seven-activity project, find the total float of each activity.
A, C, E and G are critical, so each has float 0.
B: latest start 2, earliest start 0, so float 2.
D: latest start 8, earliest start 3, so float 5. F: latest start 10, earliest start 5, float 5.
D and F lie on the same chain, so the five days are shared between them, not five each.
Splitting the float in two
Total float measures room in the most generous way available. It assumes the activity starts as early as anything allows and finishes as late as anything allows, which is to say it borrows from both neighbours at once. Splitting it into two parts says how much of that room is the activity's own. Both parts are built from the same four numbers the two passes produced: the earliest and latest times of the event the activity leaves, and the earliest and latest times of the event it arrives at.
Independent float is the room left when the neighbours are given no ground at all: the activity waits for the latest time of its start event and still finishes by the earliest time of its end event. So it is the earliest time at the end minus the latest time at the start minus the duration, and where that comes out negative it is recorded as zero, since a negative amount of room is no room. Spend independent float and nothing else in the project moves.
Interfering float is the rest, so it is the total float minus the independent float. It is real room, but using it pushes a later activity along, which is the sharing the total float of a chain hides. Where two activities sit one behind the other on a chain with five days spare, each shows five days of total float and none of it independent, and that is the arithmetic behind the warning above.
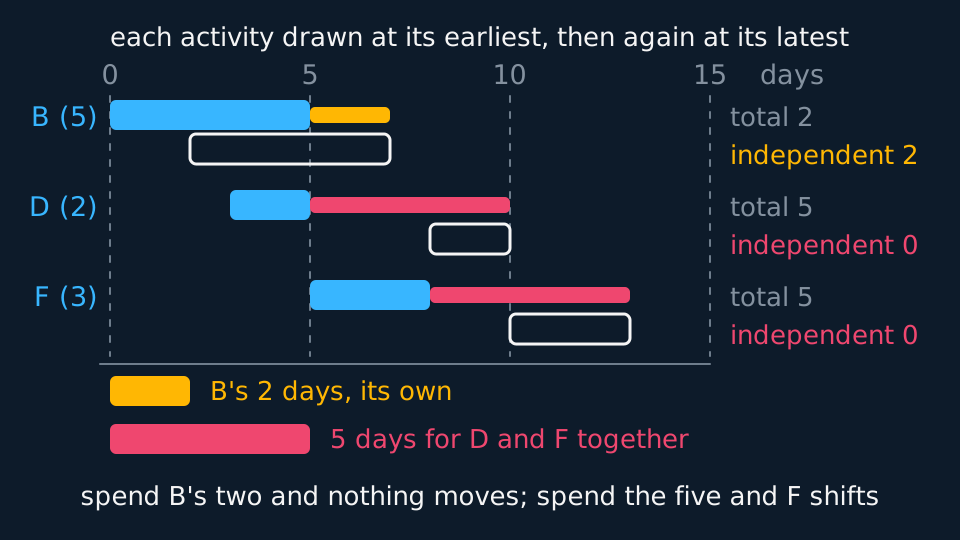
Drawing each of the three floating activities twice, once as early as it will go and once as late, makes the difference plain: B's two days sit in a gap nothing else wants, while D's five and F's five are the same five days seen from either end of a chain.
Describe the drawing
Three time axes, one each for B, D and F, running from day nought to day fifteen. Each activity is drawn as a solid blue bar at its earliest start, with a narrow tail reaching to its latest finish, and beneath it an outlined bar at the latest position it could take. B's tail is two days long and amber; D's and F's are five days each and coral. The two bars at the foot say what those tails are worth: B's two days are a pool of its own, so it may drift by two without disturbing anything, while D and F share a single pool of five days along their chain rather than five days apiece.
The activity times a question asks for alongside the floats come from the same passes. An activity's earliest finish is its earliest start plus its duration; its latest start is its latest finish minus its duration. Those two, with the earliest start and latest finish, are the four numbers a float question is answered from.
WORKED EXAMPLE
Three floats for the project
For the seven-activity project, tabulate the activity times and split each float.
Event times from the two passes: the start event is 0 and 0; the event after A is 3 and 3; the event where B and C merge is 7 and 7; the event after D is 5 and 10; the event where E and F merge is 13 and 13; the end event is 15 and 15.
| Activity | Duration | Earliest start | Earliest finish | Latest start | Latest finish | Total | Independent | Interfering |
|---|---|---|---|---|---|---|---|---|
| A | 3 | 0 | 3 | 0 | 3 | 0 | 0 | 0 |
| B | 5 | 0 | 5 | 2 | 7 | 2 | 2 | 0 |
| C | 4 | 3 | 7 | 3 | 7 | 0 | 0 | 0 |
| D | 2 | 3 | 5 | 8 | 10 | 5 | 0 | 5 |
| E | 6 | 7 | 13 | 7 | 13 | 0 | 0 | 0 |
| F | 3 | 5 | 8 | 10 | 13 | 5 | 0 | 5 |
| G | 2 | 13 | 15 | 13 | 15 | 0 | 0 | 0 |
B: total float 7 − 0 − 5 = 2, and independent float 7 − 0 − 5 = 2 as well, because the event B arrives at is reached at 7 by C in any case. So B's two days are entirely its own and it can drift by two without touching anything.
D: total float 10 − 3 − 2 = 5, but independent float 5 − 3 − 2 = 0. All five days interfere: delaying D by any of them pushes F.
F: total float 13 − 5 − 3 = 5, independent float 13 − 10 − 3 = 0, so again all five days interfere, this time by requiring D to have started early.
The two zeros in D's and F's independent column say what the Gantt chart draws: the five days belong to the chain D then F and are spent once between them, while B's two days are B's alone.
Workers and levelling
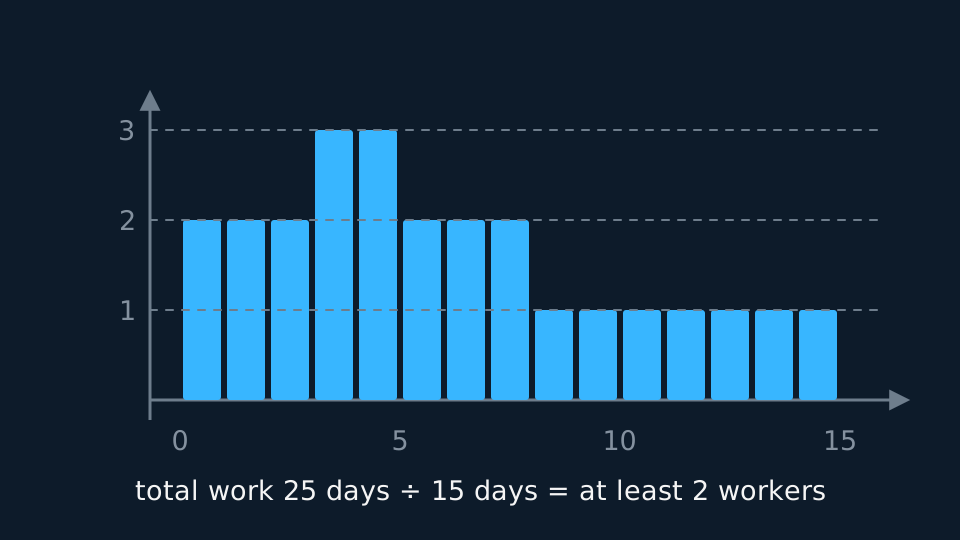
A resource histogram plots how many workers are needed at each moment when every activity starts as early as possible. Its peak is often higher than it needs to be. Shifting non-critical activities within their float, which is called levelling, can flatten it.
The lower bound on the number of workers is the total of all the activity durations divided by the project duration, rounded up. That many workers would have to be busy every single moment. Achieve the bound and the schedule is optimal; fail to achieve it and the question will ask you to explain what prevented it.
GUIDED PRACTICE
How many workers
The seven activities take 3, 5, 4, 2, 6, 3 and 2 days, each needing one worker, and the project lasts 15 days. Find the lower bound on the number of workers and comment on the histogram.
Show the working
Total work = 3 + 5 + 4 + 2 + 6 + 3 + 2 = 25 worker-days.
Lower bound = 25/15 = 1.67, rounded up to 2 workers.
At earliest start times the histogram peaks at 3, between days 3 and 5, when B, C and D all run.
Delay D to start on day 8, which its five days of float allow, and F follows on day 10. The peak disappears and two workers do suffice, so levelling has saved a third worker.
ASSESSMENT FOCUS
- Compute float as latest finish minus earliest start minus duration, and show the subtraction.
- For independent float, swap the two event times over: earliest at the end, latest at the start, and record a negative result as zero.
- Give interfering float as total minus independent rather than computing it afresh, and say which activity the interference falls on.
- Draw the Gantt chart to scale with the critical activities in one unbroken row.
- State the lower bound on workers before attempting a schedule.
- When levelling, say which activity you moved and by how much, and check its float allows it.
CHECK YOURSELF
A project of duration 20 days has activities totalling 62 worker-days. Find the lower bound on the number of workers.
Show a hint
Total work over duration, rounded up.
Show the answer
62/20 = 3.1, so at least 4 workers are needed. Three workers could supply only 60 worker-days in the time available.
Total float is latest finish minus earliest start minus duration; independent float swaps the two event times over and is recorded as zero if negative.
Float is shared along a chain, so two activities on the same path cannot both use it all: that shared part is the interfering float, and total minus independent is what measures it.
The lower bound on workers is total work divided by project duration, rounded up; levelling shifts non-critical activities within their float to reach it.
WORKBOOK
Printable practice for this topic: original exam-style questions with room to work, and a fully worked answer book. Free to use; please do not redistribute or sell.
Or read them with their worked answers on the float, Gantt charts and scheduling questions page.
CHECK YOUR PROGRESS
Rate how confident you feel with each objective for this lesson. Ratings are saved in this browser, on this device, unless you sign in.
- Calculate the total float of every activity.
- Find the latest start and earliest finish of an activity, and split its float into the independent and interfering parts.
- Draw a Gantt chart showing floats, and read simultaneous activities from it.
- Draw a resource histogram, find the lower bound on workers, and schedule.
Open the full revision checklist to see every objective in the course in one place.