Maths › Further Statistics 2 › Non-parametric tests
Non-parametric tests
Not every test needs a named distribution behind it. The sign test and the two Wilcoxon tests work from signs and ranks alone, so they ask about a median rather than a mean. Carry out all three, in single-sample and paired forms where they exist, choose between them from how the data were collected, and use the normal approximations for large samples.
Builds on Tests with the t-distribution and Testing a correlation coefficient.
IN THIS TOPIC
- Say what makes a test non-parametric and when one is worth its loss of power.
- Test a claimed median with a sign test and with a Wilcoxon signed-rank test.
- Run the paired forms of both, and the rank-sum test for two independent samples.
- Choose the test from how the data were collected and what the readings carry.
- Use the normal approximations for T and W, with a continuity correction.
COMMON MISCONCEPTION
A large value of the Wilcoxon statistic T is the evidence against H₀, since a large test statistic means a large departure.
Small values of T are the evidence, so the signed-rank test rejects when T is at or below the critical value. The two totals satisfy T+ + T− = n(n + 1)/2, so a large total on one side is a small total on the other. A two-tailed test takes the smaller total, and a one-tailed test takes whichever total the alternative hypothesis would push down.
What a non-parametric test assumes
Every test so far in this unit asks about μ or σ² of a normal population, and the critical values it reads depend on that population being normal. A non-parametric test, also called distribution-free, assumes no family of distributions for the population at all. Its hypotheses are about a median, or about two populations being the same one, and its arithmetic uses only the signs and the order of the readings. The rank correlation test met earlier is one; the three tests of location below are the rest of the family a Further Statistics paper expects.
The sign test
The sign test is the plainest of them. To test H0: the population median is m, count how many readings exceed m. Under H0 a reading falls above the median with probability ½, and the readings are independent, so that count is B(n, ½) and the p-value is a binomial tail. No table beyond the binomial is needed. A reading exactly equal to m carries no sign. The usual convention is to discard such readings and reduce n accordingly; questions at this level normally supply data containing none.
Because the sizes of the deviations play no part, the sign test works on data that carry direction and nothing else: which of two recipes a taster prefers, whether a patient improved. That is also what it costs. Two readings a hair above m and two a mile above count the same, so evidence is thrown away and the test detects a real shift less often than one that uses the sizes.
WORKED EXAMPLE
A claimed median waiting time
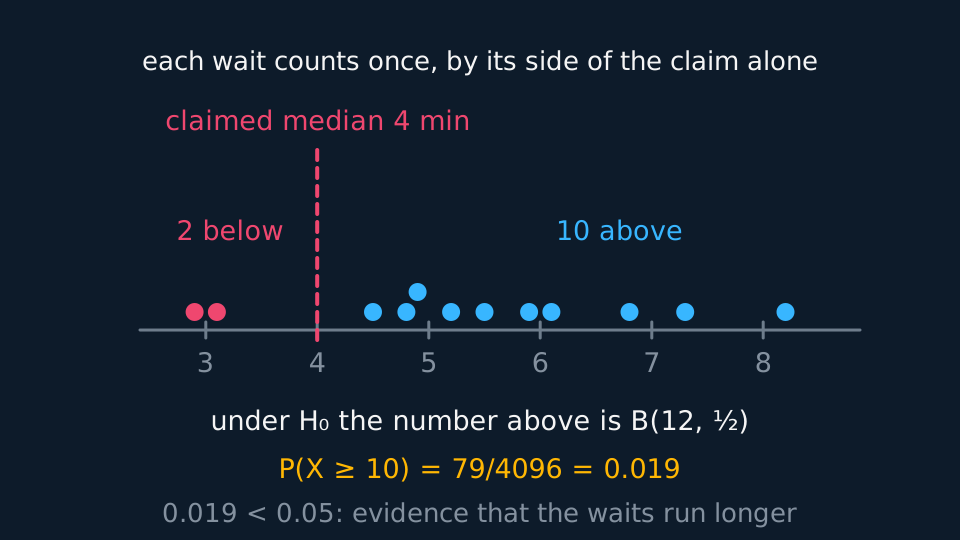
A shop claims the median wait is 4 minutes. Twelve waits are recorded: 5.2, 3.1, 6.8, 4.5, 7.3, 2.9, 5.9, 6.1, 4.8, 5.5, 8.2, 4.9 minutes. Test at 5% whether the median wait is longer than claimed.
H0: median = 4; H1: median > 4. One-tailed at 5%.
Ten waits exceed 4 and two fall below it, with none equal to 4. Under H0 the number above is B(12, ½).
P(X ≥ 10) = (66 + 12 + 1)/4096 = 79/4096 = 0.0193.
Since 0.0193 < 0.05, reject H0. There is evidence at the 5% level that the median wait is longer than 4 minutes. Nothing was assumed about the shape of the distribution of waiting times, which is as well, since waiting times are usually skewed and a test about a mean would have needed an assumption the data would not support.
The Wilcoxon signed-rank test
The signed-rank test recovers some of what the sign test discards. Subtract the hypothesised median from each reading, rank the sizes of the deviations from 1 for the smallest, then hand each rank back the sign of the deviation it came from. Total the ranks carrying a plus to get T+ and those carrying a minus to get T−. The two totals add to 1 + 2 + ... + n, so T+ + T− = n(n + 1)/2, and checking that is the quickest way to catch a misranking. Tied sizes are excluded from the syllabus.
Which total is the test statistic depends on the tail. A two-tailed test takes T as the smaller of the two. A one-tailed test takes the total that H1 would push down: for H1: median > m the deviations should mostly be positive, so it is T− that should come out small. Small values of T are the evidence, so the test rejects when T is at or below the critical value. That reverses the direction used by z, t, chi-squared and F, so state which total you are using and compare it with the critical value in the right direction.
Using the sizes wins power and costs an assumption. The critical values of T are worked out on the footing that the population is symmetric about its median, since only then are a deviation of +3 and a deviation of −3 equally likely. The sign test asks for no such thing, which is the one respect in which it is the safer of the two.
WORKED EXAMPLE
A claimed median lifetime
A maker claims the median lifetime of a cell is 30 hours. Ten cells last 31.4, 29.1, 33.2, 30.8, 28.9, 32.6, 29.7, 34.5, 31.3, 31.9 hours. Test at 5% whether the median exceeds 30. The critical value is 10.
H0: median = 30; H1: median > 30. One-tailed at 5%, n = 10.
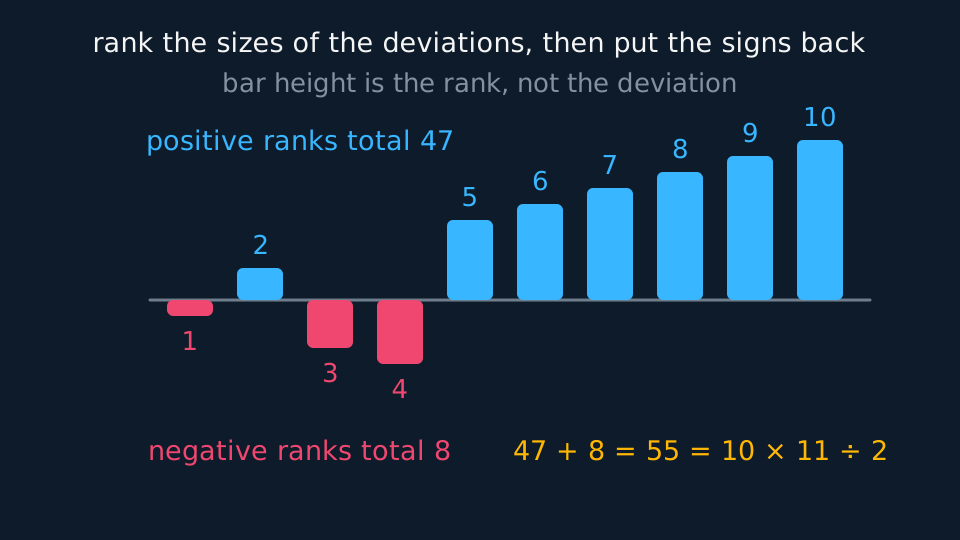
The deviations are +1.4, −0.9, +3.2, +0.8, −1.1, +2.6, −0.3, +4.5, +1.3, +1.9. Ranking their sizes gives 6, 3, 9, 2, 4, 8, 1, 10, 5, 7.
The three negative deviations carry ranks 1, 3 and 4, so T− = 8 and T+ = 47. As a check, 8 + 47 = 55 = 10 × 11/2.
H1 says the deviations run positive, so the statistic is T− = 8. Since 8 ≤ 10, reject H0. There is evidence at the 5% level that the median lifetime exceeds 30 hours.
The sign test on the same data counts 7 above and 3 below, and P(X ≥ 7) = 176/1024 = 0.172 under B(10, ½), nowhere near significant. The three cells that fell short fell short by very little, and the signed-rank test is the one that noticed.
Paired data: the sign and matched-pairs tests
Which design you have is read off the data rather than chosen, and the t lesson settles it: a paired sample arrives with a partner for each reading and two lists of the same length, while an unpaired one is two independent groups whose sizes need not agree. Samples of different sizes rule pairing out; two lists of the same length prove nothing on their own.
Once the data are paired there is nothing new to learn. Subtract within pairs and you hold one sample of differences, H0 becomes the statement that the median difference is zero, and both tests above apply unchanged. Run on differences they are called the paired sign test and the Wilcoxon matched-pairs signed-rank test, and neither is a new procedure. Running an unpaired test on paired data throws the pairing away, as it does with t.
WORKED EXAMPLE
Before and after a revision course
Eight students sit comparable papers before and after a course. Their marks before are 42, 55, 38, 61, 47, 50, 44, 58, and after are 48, 57, 47, 60, 54, 54, 41, 69. Test at 5% whether the course raises marks, first with the paired sign test and then with the matched-pairs signed-rank test, whose critical value is 5.
The differences, after minus before, are +6, +2, +9, −1, +7, +4, −3, +11. H0: the median difference is 0; H1: it is positive. One-tailed at 5%, n = 8 pairs.
Sign test. Six differences are positive and two negative, so P(X ≥ 6) = (28 + 8 + 1)/256 = 37/256 = 0.145. That exceeds 0.05, so this test does not reject H0.
Signed-rank test. Ranking the sizes 6, 2, 9, 1, 7, 4, 3, 11 gives 5, 2, 7, 1, 6, 4, 3, 8. The negatives carry ranks 1 and 3, so T− = 4 and T+ = 32, which add to 36 = 8 × 9/2.
Since 4 ≤ 5, reject H0. There is evidence at the 5% level that the course raises marks.
Two verdicts from eight pairs of marks. The two students who slipped slipped by 1 and 3 marks while six improved by up to 11, and only the test that ranks the sizes can see that. Name the test you used and the reason for choosing it.
The Wilcoxon rank-sum test for two independent samples
With no pairing there is nothing to subtract, so the two samples are ranked together instead. Pool the m + n readings, rank them from 1 for the smallest, and total the ranks belonging to each sample to get W1 and W2. Taking m ≤ n, the statistic W is the total for the smaller sample. The two totals add to (m + n)(m + n + 1)/2, which checks the ranking as it did before. The hypotheses here are about identity: H0 says the two samples are drawn from the same population.
If H0 holds, the m ranks going to the smaller sample are a random selection from 1 to m + n, so W has mean m(m + n + 1)/2. Evidence against H0 is W far from that mean: below it if the smaller sample's population sits lower, above it if higher, and either way for a two-tailed test. The distribution of W is symmetric about its mean, so the two critical values of a two-tailed test add to m(m + n + 1), and a table that prints one lets you work out the other.
The Mann-Whitney U test is this same test with the origin moved: U = W1 − m(m + 1)/2 subtracts the smallest total the m ranks could have had, and what is left counts the pairs, one reading taken from each sample, in which the reading from the sample of n is the smaller. Whichever of the two names a question uses, the ranking is the same.
WORKED EXAMPLE
Two light regimes
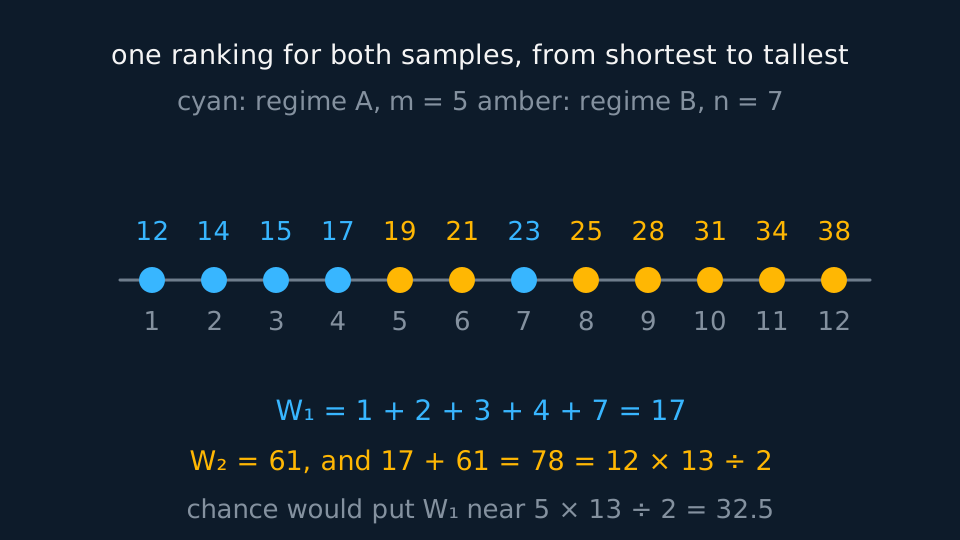
Five seedlings grown under regime A reach 12, 14, 15, 17 and 23 cm; seven under regime B reach 19, 21, 25, 28, 31, 34 and 38 cm. Test at 5% in two tails whether the two regimes give the same distribution of heights. The critical values are 20 and 45.
H0: the heights come from the same population; H1: they do not. The samples differ in size, so they are not paired and the rank-sum test is the one that fits.
Ranked together the twelve heights give A the ranks 1, 2, 3, 4, 7 and B the ranks 5, 6, 8, 9, 10, 11, 12.
A is the smaller sample, so W = 1 + 2 + 3 + 4 + 7 = 17. Checking, W2 = 61 and 17 + 61 = 78 = 12 × 13/2.
Under H0 the mean of W is 5 × 13/2 = 32.5, and 17 falls well below it. Since 17 ≤ 20, reject H0. There is evidence at the 5% level that the two regimes give different height distributions, with regime A the lower.
Choosing the test
Three questions settle it, in this order. First, one sample or two, and if two, paired or independent? That is a property of how the data were collected. A single sample tested against a claimed median, or a paired sample reduced to differences, leads to the sign test or the signed-rank test; two independent samples leave only the rank-sum test, because there is no way to subtract one list from the other.
Second, do the sizes of the deviations mean anything? If the readings are measurements and the population of differences can be taken as symmetric, the signed-rank test uses more of the data and is the stronger. If the record is a direction and no more, a preference or an improvement noted without a scale, the sign test is the one the data support. The revision-course data show what hangs on this: the same eight pairs, one test rejecting and one not.
Third, would a parametric test serve? Where the population really is normal, the t tests for a mean detect a smaller shift from the same n, because they use the actual readings rather than their order. Reach for a non-parametric test when the population is plainly not normal, when the sample is too small for the assumption to be checked, when an extreme value would distort a mean, or when the data arrive as ranks or ordered categories. Name the assumption you are declining to make.
GUIDED PRACTICE
Which test, and why?
Name the test for each, with a reason.
(a) Nine tasters each try both brands of a drink and say which they prefer.
(b) Twelve runners are timed on the same course before and after six weeks of training.
(c) The salaries of 8 graduates from one university and 11 from another are compared for a difference in level.
Show the working
(a) Paired sign test. Each taster supplies a pair, so the data are paired, but the record is a preference with no size attached, so there are no deviations to rank.
(b) Wilcoxon matched-pairs signed-rank test. Each runner supplies a before time and an after time, so the data are paired, and the differences are measured in seconds, so their sizes can be ranked. The sign test would work too and would be the weaker of the two.
(c) Wilcoxon rank-sum test. Two independent groups of unequal size, with no partner for any reading, so pairing is ruled out. Salaries are strongly skewed, which is a reason to test the populations for identity rather than the means for equality. W would be taken from the sample of 8.
Normal approximations for large samples
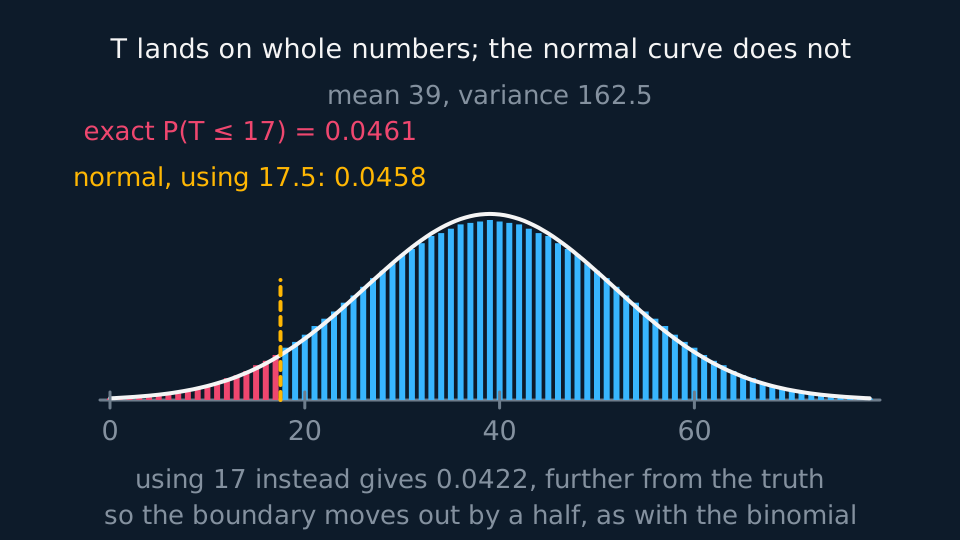
Tables of critical values for T and W run out, and beyond them both statistics are treated as approximately normal. The mean and variance of T come out in two lines. Under H0 each rank r joins T+ with probability ½, independently of the rest, so the mean is half of 1 + 2 + ... + n and the variance is a quarter of 1² + 2² + ... + n², since a rank r included on the toss of a coin contributes r²/4.
That gives T approximately N(n(n + 1)/4, n(n + 1)(2n + 1)/24). For the rank-sum statistic, with samples of sizes m and n and m ≤ n, W is approximately N(m(m + n + 1)/2, mn(m + n + 1)/12).
Both statistics land on whole numbers, so the boundary of the critical region moves out by a half before standardising, the same continuity correction used when a normal stands in for a binomial. For a small T the tail is P(T ≤ t), which becomes the area below t + ½; for a large W it is P(W ≥ w), which becomes the area above w − ½. State that the correction has been applied.
WORKED EXAMPLE
A signed-rank test on thirty differences
Thirty paired differences give T = 130. Test at 5% in two tails whether the median difference is zero.
H0: the median difference is 0; H1: it is not 0. Two tails at 5%, so the critical values are ±1.96.
Mean = 30 × 31/4 = 232.5; variance = 30 × 31 × 61/24 = 56730/24 = 2363.75, so the standard deviation is 48.62.
With the continuity correction, z = (130.5 − 232.5)/48.62 = −102/48.62 = −2.098.
Since 2.098 > 1.96, reject H0. There is evidence at the 5% level of a shift. Leaving the half out gives −2.108 here, the same verdict from a slightly overstated statistic; the correction moves z towards zero, so omitting it tilts the test towards rejecting.
GUIDED PRACTICE
A large rank-sum test
Independent samples of 15 and 18 readings are ranked together and the smaller sample's ranks total 190. Test at 5% in two tails whether the two populations are the same.
Show the working
H0: the samples come from the same population; H1: they do not. Here m = 15 and n = 18, so W = 190 is already the total from the smaller sample.
Mean = 15 × 34/2 = 255; variance = 15 × 18 × 34/12 = 9180/12 = 765, so the standard deviation is 27.66.
W is below the mean, so the correction adds a half: z = (190.5 − 255)/27.66 = −64.5/27.66 = −2.33.
Since 2.33 > 1.96, reject H0. There is evidence at the 5% level that the two populations differ, with the smaller sample drawn from the lower one.
ASSESSMENT FOCUS
- Name the test and give the reason before any arithmetic.
- Write the hypotheses about a population median, or about two populations being the same one, and not about a mean.
- Rank the sizes from 1 upwards, then check: the two signed-rank totals add to n(n + 1)/2, and the two rank totals add to (m + n)(m + n + 1)/2.
- Reject when the signed-rank T is small: it is the one statistic in this unit whose small values are the evidence.
- Judge W by its distance from m(m + n + 1)/2, in whichever tail the alternative names, and in both tails when it names none.
- For a one-tailed signed-rank test, use the total the alternative hypothesis would push down, not automatically the smaller one.
- The sign test needs no table: work the tail of B(n, ½) out and compare it with the significance level.
- Take W from the smaller sample when the two sizes differ, and say which sample it came from.
- Shift the boundary by a half before standardising a large-sample T or W, and say that you have done it.
- Conclude twice, once about H₀ and once in the words of the question.
CHECK YOURSELF
Nine paired differences have their sizes ranked 1 to 9, and the negative differences sit at ranks 2 and 5. Find T+ and T−, and say which is used in a two-tailed test.
Show a hint
Total the ranks of the negatives, then use the sum of all nine.
Show the answer
T− = 2 + 5 = 7, and the nine ranks total 9 × 10/2 = 45, so T+ = 45 − 7 = 38. A two-tailed test uses the smaller, T = 7, and rejects if it is at or below the critical value.
A non-parametric test names no family of distributions for the population: it works from signs and ranks, and asks about a median or about two populations being the same one.
Sign test: the count above the claimed median is B(n, ½). Signed-rank: rank the sizes, total them by sign to T+ and T−, and reject when the relevant total is at or below the critical value.
Rank two independent samples together and take W from the smaller one; for large samples T is about N(n(n + 1)/4, n(n + 1)(2n + 1)/24) and W about N(m(m + n + 1)/2, mn(m + n + 1)/12), each with a continuity correction.
WORKBOOK
Printable practice for this topic: original exam-style questions with room to work, and a fully worked answer book. Free to use; please do not redistribute or sell.
Or read them with their worked answers on the non-parametric tests questions page.
CHECK YOUR PROGRESS
Rate how confident you feel with each objective for this lesson. Ratings are saved in this browser, on this device, unless you sign in.
- Say what makes a test non-parametric and when one is worth its loss of power.
- Test a claimed median with a sign test and with a Wilcoxon signed-rank test.
- Run the paired forms of both, and the rank-sum test for two independent samples.
- Choose the test from how the data were collected and what the readings carry.
- Use the normal approximations for T and W, with a continuity correction.
Open the full revision checklist to see every objective in the course in one place.