Maths › Further Statistics 2 › Testing a correlation coefficient
Testing a correlation coefficient
A sample correlation is almost never exactly zero, even when the population one is. Tables of critical values give the threshold beyond which it counts as evidence of correlation in the population, and that threshold depends on the sample size.
Builds on Correlation coefficients and Hypothesis testing: correlation.
IN THIS TOPIC
- State hypotheses about a population correlation coefficient correctly.
- Read a critical value from the tables and reach a conclusion in context.
- Explain the condition the product moment test needs and why the rank test avoids it.
- Say what makes a test non-parametric, and weigh the assumption it drops against the power it costs.
COMMON MISCONCEPTION
A sample correlation of 0.5 is moderately strong, so it is significant evidence of a real relationship.
Significance depends on the sample size, so a coefficient carries no verdict without the n it came from. A test of H₀: ρ = 0 compares r with a critical value that falls as n grows, and 0.5 falls short of the 5% one-tailed value at n = 10 while lying inside the critical region at n = 30. The product moment test also assumes the pairs come from a bivariate normal population.
Hypotheses about the population
The sample coefficient r estimates a population coefficient, written ρ for the product moment version and ρs for the rank version. The null hypothesis is always that the population value is zero. The alternative is one-tailed or two-tailed according to what the question asks. Write the hypotheses in terms of ρ and never in terms of r, because the sample value is what you measured, not what you are testing.
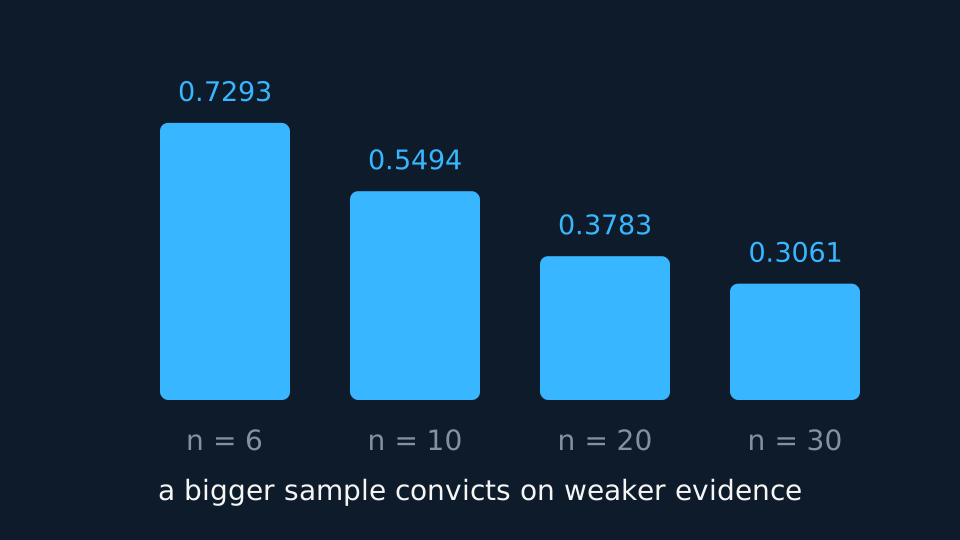
Whether a given r counts as evidence depends on the sample size. With n = 10 a coefficient of 0.5 falls short of the 5% critical value; with n = 30 the same 0.5 lies inside the critical region. A coefficient therefore cannot be interpreted as evidence without the sample size it came from.
WORKED EXAMPLE
A one-tailed test
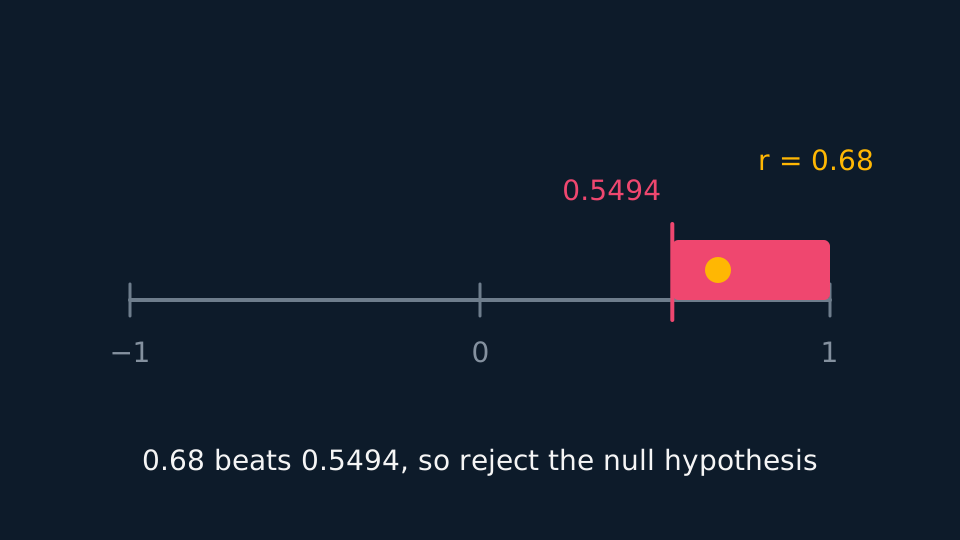
A sample of 10 pairs gives r = 0.68. Test at the 5% level whether there is positive correlation in the population.
H0: ρ = 0; H1: ρ > 0. One-tailed, 5%, n = 10.
From the tables the critical value is 0.5494.
Since 0.68 > 0.5494 the result lies in the critical region, so reject H0. There is evidence at the 5% level of positive correlation between the two variables.
Critical values and sample size
Critical values fall as n grows, because a large sample makes a correlation of a given size less likely to arise by chance. At 5% in one tail the threshold drops from about 0.73 at n = 6 to about 0.31 at n = 30. A large coefficient from five points is therefore weak evidence, and a smaller one from thirty may be significant.
The product moment test carries a condition. Its critical values are computed on the assumption that the pairs come from a bivariate normal population, which in practice means both variables are approximately normal and the scatter is elliptical. Formal checking is not required, but the condition should be stated. Spearman's test does not require a bivariate normal population, because it uses only the ranks, but it still requires independent paired observations and it tests for monotonic association rather than linear association. That makes it the appropriate test for skewed data, or for a small sample containing an extreme value.
A test that assumes no particular family of distributions for the population is called non-parametric, or distribution-free. Spearman's is one. It replaces the readings by their ranks, so its critical values hold whatever the shape of the population, provided the paired observations are independent, and its hypotheses are about the association itself rather than about the parameters of a named distribution. The product moment test is the parametric partner: its hypotheses are about ρ, and its critical values are computed on the bivariate normal assumption above.
Prefer the distribution-free version when the population is plainly not normal, when the sample is too small for that condition to be worth checking, when an extreme value would distort a product moment coefficient, or when the data arrive as ranks or ordered categories, as judges' placings do. The cost is power: where the parametric condition does hold, the test built on it detects a real effect more often from the same n, because it uses the sizes of the readings and not their order alone. The choice therefore rests on which assumption is defensible, and an answer should name that assumption.
GUIDED PRACTICE
A rank test
Two judges rank eight competitors and Spearman's coefficient is 0.905. Test at the 5% level whether there is positive agreement, given a critical value of 0.6429.
Show the working
H0: ρs = 0; H1: ρs > 0. One-tailed, 5%, n = 8.
The observed 0.905 exceeds the critical 0.6429, so the result is in the critical region.
Reject H0: there is evidence at the 5% level that the two judges agree in their rankings.
Nothing had to be assumed about the shape of the underlying distributions, since only the orders were used.
ASSESSMENT FOCUS
- Write the hypotheses using ρ or ρs, not r or rs. The sample value belongs in the comparison, not the hypothesis.
- State the tail, the level and the sample size before quoting a critical value.
- Conclude twice, once about the null hypothesis and once about the variables in context.
- For the product moment test, state the bivariate normal condition; for the rank test, state that no distributional assumption is needed but that the paired observations must be independent.
- Justify a non-parametric test by naming the condition its parametric partner would need and saying why the data fail it.
- Significant does not mean large. A significant r of 0.31 from 30 pairs still leaves most of the variation unexplained.
CHECK YOURSELF
A sample of 20 pairs gives r = 0.35. The 5% one-tailed critical value is 0.3783. What do you conclude?
Show a hint
Compare, then say what it means for the variables.
Show the answer
0.35 < 0.3783, so the result is not in the critical region. Do not reject H₀: there is insufficient evidence at the 5% level of positive correlation in the population.
Hypotheses are about the population coefficient ρ or ρs, tested against a critical value that depends on n, the tail and the level.
Critical values fall as n grows; the product moment test assumes a bivariate normal population, while the rank test assumes nothing about shape but still needs independent paired observations and tests for monotonic association.
A non-parametric test names no family of distributions for the population and works from ranks, dropping a condition at the cost of power when that condition would have held.
WORKBOOK
Printable practice for this topic: original exam-style questions with room to work, and a fully worked answer book. Free to use; please do not redistribute or sell.
Or read them with their worked answers on the testing a correlation coefficient questions page.
USED LATER IN
CHECK YOUR PROGRESS
Rate how confident you feel with each objective for this lesson. Ratings are saved in this browser, on this device, unless you sign in.
- State hypotheses about a population correlation coefficient correctly.
- Read a critical value from the tables and reach a conclusion in context.
- Explain the condition the product moment test needs and why the rank test avoids it.
- Say what makes a test non-parametric, and weigh the assumption it drops against the power it costs.
Open the full revision checklist to see every objective in the course in one place.