Physics › Required practicals › Resistivity of a wire
REQUIRED PRACTICAL 5Resistivity of a wire
Finding the resistivity of a wire from its resistance and dimensions, using a micrometer, an ammeter and a voltmeter.
Theory: Resistivity and temperature
What you are trying to do
Determine the resistivity of the metal of a wire from its resistance, length and cross-sectional area.
Apparatus
- A metre of bare resistance wire (nichrome or constantan) taped along a metre rule
- Micrometer screw gauge for the diameter
- Low-voltage supply, ammeter and voltmeter (or a calibrated ohmmeter)
- Crocodile clip to make the moving contact
Variables
- Independent: the length of wire in the circuit
- Dependent: its resistance
- Control: the wire's diameter and temperature: same wire, low current, readings taken briefly
Method
- Measure the diameter at several places along the wire and in two perpendicular directions at each place; take the mean, and check the micrometer's zero error first.
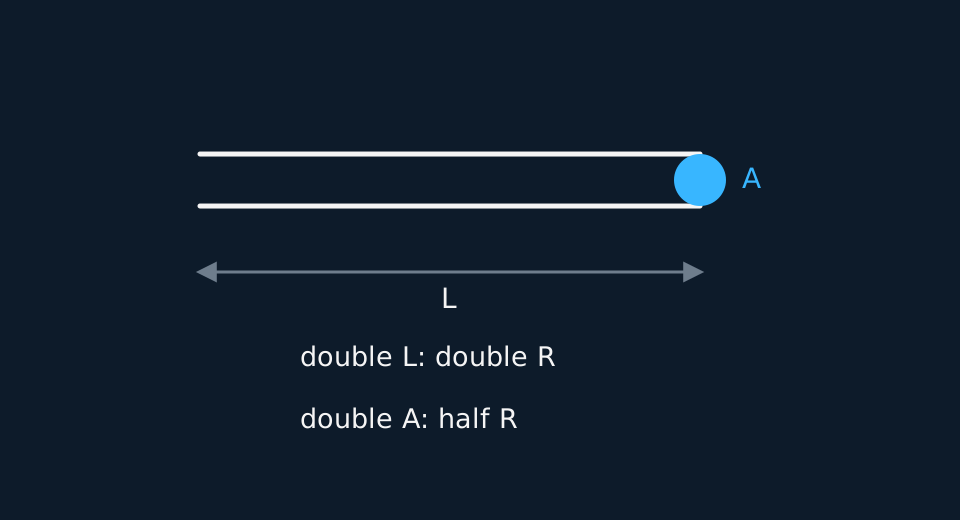
- Clip onto the wire at a series of measured lengths, and record V and I (or R directly) at each. Keep the current small and switch off between readings so the wire does not warm up: resistivity rises with temperature.
Analysis
- R = ρL/A, so R should vary linearly with L. An ideal wire-only measurement passes through the origin; a constant lead or contact resistance produces an intercept. The gradient still gives ρ/A only if that added resistance remains constant as the contact is moved.
- Compute the area from the mean diameter, A = πd²/4, then ρ = gradient × A.
- Test the constant-contact assumption rather than relying on it. Remake the contact at two of the lengths and read again: if the resistance at the same length changes, the contact resistance is not constant, so it does not cancel in the gradient. Clean the wire, remake the contacts, and repeat the affected readings.
- How good an answer this is. The comparison worth making is with the book value for the metal you think you have. Nichrome sits near 1.1 × 10⁻⁶ Ω m and constantan near 4.9 × 10⁻⁷ Ω m, more than a factor of two apart, so even a ten per cent measurement settles which of them is taped to your rule. That is a conclusion your data support. Agreement to within one per cent of a book value is not, unless your own uncertainty is smaller than one per cent.
- What the meters cannot separate. A voltmeter and an ammeter across a clipped length read everything in the loop: the wire, the clip, the leads and the meters themselves. Taking the gradient removes whatever stays constant, which is why a steady intercept does not bias ρ, but nothing in this procedure separates the wire's resistance from the contact's at a single length. The four-terminal arrangement does, with one pair of contacts carrying the current and a separate pair reading the pd, so the clip's resistance never appears in the measurement at all.
A worked set of readings
Nichrome wire of mean diameter 0.36 mm (A = 1.02 × 10⁻⁷ m²):
| L / m | R / Ω |
|---|---|
| 0.200 | 2.16 |
| 0.400 | 4.32 |
| 0.600 | 6.48 |
| 0.800 | 8.65 |
| 1.000 | 10.81 |
Idealised illustrative data, chosen so the working is easy to follow. Real readings scatter about the line rather than sitting on it, and your own graph will have points either side of the best fit.
The gradient of R against L is 10.8 Ω m⁻¹, so ρ = gradient × A = 10.8 × 1.02 × 10⁻⁷ = 1.10 × 10⁻⁶ Ω m, the right value for nichrome.
Evaluating the result
Idealised readings with one clip left dirty. The crocodile clip at 0.600 m was closed over a smear of oxide, adding about 0.45 Ω that has nothing to do with the wire. The third column divides R by L, which the model says is ρ/A and the same at every length.
| L / m | R / Ω | R/L / Ω m⁻¹ |
|---|---|---|
| 0.200 | 2.16 | 10.8 |
| 0.400 | 4.32 | 10.8 |
| 0.600 | 6.93 | 11.6 |
| 0.800 | 8.65 | 10.8 |
Idealised illustrative data, chosen so the working is easy to follow. Real readings scatter about the line rather than sitting on it, and your own graph will have points either side of the best fit.
Three rows return 10.8 Ω m⁻¹ and the remaining one returns 11.6. On the R against L graph it sits above the line while its neighbours sit on it. A poor contact can only add resistance in this series arrangement, so it is one explanation for a high point; a misread length or a warm wire are others, and the reading alone does not choose between them. Reclip at that length, clean the wire if necessary, and read again. If the point returns to the line, record the contact fault and use the repeat; if it does not, keep the reading and report it. Keep the original readings in the table with the reason recorded, even when a point is excluded from the fit.
Where the uncertainty comes from
- Diameter: The dominant term: it is squared in the area, doubling its percentage uncertainty. Multiple readings in two directions catch an oval or tapering wire.
- Temperature: Current heats the wire and raises its resistance mid-experiment; low current, brief readings.
- Contact position: The crocodile clip has width; clip to the same edge each time and read the length at that edge.
- Meter resolution: At short lengths the resistance is small, so the meter's last digit is a larger percentage of it. A least-squares line applies no weighting; what the long lengths give is a smaller percentage uncertainty in R and a longer lever on the gradient, so run the readings out to the full metre.
What earns the marks
✓Marks
- State all four parts of the diameter measurement: several places, two perpendicular directions, mean taken, zero error checked.
- Give the reason for low current: heating changes the resistivity you are trying to measure.
- Use the gradient of R against L, and identify any intercept as lead and contact resistance rather than a property of the wire.
- Combine percentage uncertainties correctly. The diameter's percentage uncertainty counts twice, because the area depends on the square of it.
Safety
!Caution
The wire can get hot enough to burn at careless currents, and cut ends are sharp. Low current, brief readings, and switch off between them.
Method and analysis here follow the standard approach; your school may vary the apparatus. Always follow your teacher’s risk assessment in the lab.