Biology › Classification, biodiversity and conservation › Measuring biodiversity
Measuring biodiversity
Biodiversity is described at the level of habitat, species and genes. Species richness counts species; an index of diversity combines richness with evenness. Two forms of Simpson's index are in use and they run in opposite directions, so the formula must be stated before a value is interpreted.
Before this Random sampling with quadrats and transects · Population genetics and the Hardy-Weinberg principle · Mean and standard deviation
COMMON MISCONCEPTION
The habitat with the most individuals in it is the most diverse.
Abundance is not diversity. A hectare of ryegrass ley holds enormous numbers of organisms belonging to very few species. Diversity is how many species there are and how evenly the individuals are shared between them, which is what an index is built to measure.
What you should be able to do
- Distinguish species richness from species diversity, and say what evenness adds.
- Calculate an index of diversity using the form your board specifies, and state which form you have used.
- Explain why one Simpson form rises with diversity and the other falls, and interpret a value correctly either way.
- Describe how genetic diversity within a species is measured, and why observable characteristics are a poor measure of it.
- Explain how agriculture and monoculture reduce diversity at the habitat, species and genetic levels, and describe measures that offset this.
- Distinguish random sampling from opportunistic, stratified and systematic sampling, and choose the right collecting equipment for small animals.
The three levels of biodiversity
Biodiversity is described at three levels. Habitat diversity is the number of different habitats in an area: a farm with a wood, a pond, hedges and a stream has more than a farm with one enormous field. Species diversity is the number of species in a community and the abundance of each. Genetic diversity is the variety of alleles within a single species.
The three are not independent. Remove hedges and you lose habitat diversity, which takes species diversity with it, and a species reduced to a few isolated populations loses genetic diversity as well.
- Species richness
- The number of different species in a community.
- Species evenness
- How equally the individuals are shared out between the species in a community.
- Species diversity
- Richness and evenness together, usually expressed as an index.
- Genetic diversity
- The number of different alleles present in the gene pool of a population or species.
- Endemism
- Being found naturally in only one place, such as a single island or region, and nowhere else; a species like this is endemic to that place.
Richness on its own is a count. It treats a species represented by one individual in the same way as a species represented by a thousand, so it does not distinguish an evenly shared community from one dominated by a single species. An index of diversity combines richness with evenness in a single number.
An index of diversity does not weight species by their effect on the community. A keystone species is one whose effect on the structure of its community is far larger than its abundance would suggest, so that removing it changes the community out of all proportion. Sea otters are the standard case: they are never numerous, but they eat sea urchins, the urchins graze kelp, and where otters were hunted out the urchin population exploded and the kelp forest was stripped to bare rock, taking the fish and invertebrates that lived there with it. Returning the otters returned the forest. A diversity index calculated the year before the otters went would have given them almost no weight, because an index counts individuals rather than ecological effects. Conservation planning therefore considers which species a community depends on as well as how many species are present.
Describe the drawing
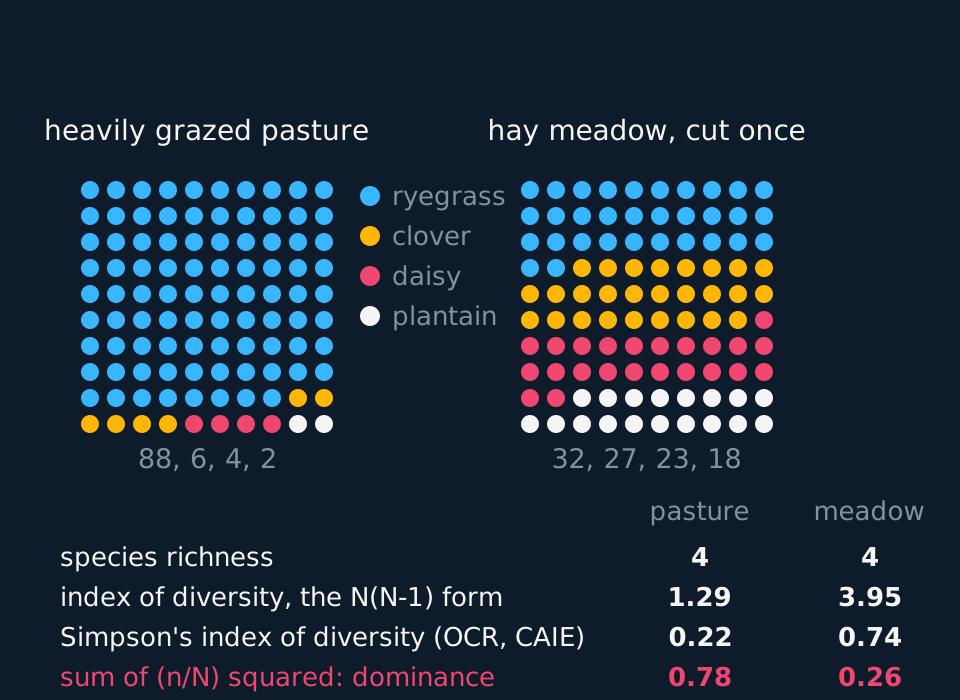
Two grids of a hundred coloured dots side by side, one dot per organism and one colour per plant species. In the grazed pasture eighty-eight dots share a single colour and the other three species are slivers; in the hay meadow the four colours are close to equal. Underneath, a small table gives species richness, the N times N minus one index, Simpson's index of diversity and the raw dominance value for each community, with the dominance row marked out because it moves in the opposite direction.
Simpson's index in its two forms
Simpson's index combines species richness with evenness. Two forms are common. Σ(n ÷ N)² estimates the probability that two individuals selected at random belong to the same species, so a larger value indicates lower diversity. 1 − Σ(n ÷ N)² is Simpson's index of diversity, so a larger value indicates higher diversity. Always state the formula used before interpreting the result.
Simpson's original quantity is the probability that two individuals picked at random from a community belong to the same species. It is called the dominance here and given no letter, because the boards use the letter D for other quantities:
dominance = Σ (n ÷ N)2n is the number of individuals of one species, N the total number of individuals of all species, and Σ means 'add this up across every species'. The squared form assumes sampling with replacement, or a sample large enough that replacement makes no difference; the finite-sample, no-replacement version uses n(n − 1) and N(N − 1) and appears below as the form AQA and Pearson Edexcel use.
That quantity measures dominance. If one species holds most of the individuals, two randomly chosen individuals are likely to be of the same species, so the dominance is close to 1. If the community is evenly shared between many species, it is close to 0. The dominance falls as diversity rises. Conventions vary: some texts call this quantity D and quote it directly, and others quote one of the transformed forms below, so an answer must state the formula used.
Two transformed forms appear on specifications.
Simpson's index of diversity: D = 1 − Σ (n ÷ N)2Used by OCR A and by CAIE 9700. Runs between 0 and 1, and rises with diversity. These boards use the letter D for the subtracted version rather than for the raw sum.
Index of diversity: d = N(N − 1) ÷ Σ n(n − 1)Used by AQA, which writes it d, and by Pearson Edexcel Biology A and B, which write the same formula as D. Has no upper limit, has a minimum value of 1 when every individual belongs to the same species, and rises with diversity.
Both of the second pair rise with diversity, so a bigger answer means a more diverse community in either. They are not on the same scale and cannot be compared with each other. The AQA form uses N(N − 1) and n(n − 1) rather than squares because it treats the sample as a finite population being sampled without replacement, since you cannot draw the same individual twice, and for a large sample its value is close to 1 ÷ Σ(n ÷ N)², the reciprocal of the dominance.
State the form used with the value. 'Index of diversity = 3.95' does not identify which index has been calculated; 'd = N(N − 1) ÷ Σn(n − 1) = 3.95' does.
Both forms, one set of counts
Two grassland plots are sampled and every plant in a hundred-plant sample is identified. The grazed pasture gives ryegrass 88, clover 6, daisy 4, plantain 2. The hay meadow gives ryegrass 32, clover 27, daisy 23, plantain 18. Both totals are 100. Calculate the species richness and both indices for each plot, and say what the numbers show. These counts are idealised; a real sample would not come to a round hundred.
Show the working
Richness. Four species in each plot, so richness does not distinguish the two plots.
Pasture, AQA form. Work out Σn(n − 1) first: 88 × 87 = 7656, 6 × 5 = 30, 4 × 3 = 12, 2 × 1 = 2. The sum is 7700. N(N − 1) = 100 × 99 = 9900. So d = 9900 ÷ 7700 = 1.29.
Meadow, AQA form. 32 × 31 = 992, 27 × 26 = 702, 23 × 22 = 506, 18 × 17 = 306. The sum is 2506. d = 9900 ÷ 2506 = 3.95.
Pasture, the 1 − D form. The proportions are 0.88, 0.06, 0.04 and 0.02. Squaring: 0.7744, 0.0036, 0.0016, 0.0004, which add to 0.78. So D = 1 − 0.78 = 0.22.
Meadow, the 1 − D form. 0.322 = 0.1024, 0.272 = 0.0729, 0.232 = 0.0529, 0.182 = 0.0324, adding to 0.2606. D = 1 − 0.2606 = 0.74.
What the numbers show. Both indices identify the meadow as the more diverse plot, by a large margin: 3.95 against 1.29, or 0.74 against 0.22. Richness gave the two plots the same value. The difference is in evenness. In the pasture, grazing and fertiliser have left one grass with 88 per cent of the sward.
The raw sums point the other way. The intermediate values were 0.78 for the pasture and 0.26 for the meadow. Read as an index of diversity, 0.78 would identify the grazed pasture as the more diverse plot; it is the less diverse plot. State which formula the reported value came from.
A high index is not necessarily a desirable state and a low one is not necessarily an undesirable one. A raised bog and a saltmarsh are species-poor under their natural conditions, and the few species they hold are largely restricted to them; raising their index by adding common generalist species would be a conservation loss.
Sampling design and the validity of an index
An index is only as representative as the sample it is calculated from. The sampling design must match the inference the index is used to support.
Quadrats placed at random coordinates, generated before entering the site, support a claim about the site as a whole. Selecting locations by eye produces a sample biased towards whatever features drew the observer's attention. Describe randomisation as 'the site was divided into a numbered grid, coordinates were generated with a random number generator, and the quadrat was placed at those coordinates'.
Random placement is not the only method, and the alternatives have names OCR asks for. OCR groups them as non-random sampling, which comes in three recognised kinds. Opportunistic sampling uses whatever is conveniently available, such as the organisms along a path you can walk without trampling a crop. It is the quickest and the least trustworthy, because whatever made the sample convenient is very likely also to have made it unrepresentative. Stratified sampling divides the area into groups first, on the basis of something known about it, and then samples each group in proportion to its size: a heath that is one third bare sand and two thirds heather gets a third of its quadrats on the sand, so a small but real part of the site is not missed by chance. Systematic sampling places the samples in a regular pattern, which is what a belt transect or a line of quadrats at fixed intervals is doing, and it is the right choice wherever the question is about a gradient rather than about an average.
The sampling design must match the inference, so state which design was used and why. Random, stratified and systematic designs can all support statistical analysis when used appropriately. Random sampling supports a claim about the site as a whole. Stratified sampling supports the same claim on a site with known internal divisions, and reduces the chance of a small stratum being missed. Systematic sampling supports a claim about how a variable changes across a distance; it is less suitable for estimating a site average, because a regular sampling interval can coincide with a regular feature such as plough furrows. Opportunistic sampling gives no basis for generalisation and should be identified as a limitation in an evaluation.
The kit for small animals is examinable too, and each item exists because of how its animals move. A sweep net is swung through long grass or other vegetation in a figure of eight to collect the insects and spiders living among the stems. A pooter is a jar with two tubes, one to suck on and one to point at the animal, with gauze across the mouth of the sucking tube so nothing ends up in the collector; it lifts small invertebrates off a leaf or out of a tray without damaging them. A pitfall trap is a container sunk level with the soil surface, covered against rain, which catches ground-active animals such as beetles over a period of hours. A Tullgren funnel drives animals out of a soil or leaf litter sample by drying it from above with a lamp, so they move downwards and fall into a preservative. Beating a branch over a white tray collects what lives in a shrub. Each of these gives a biased sample of its own, since a sweep net catches what perches on vegetation and a pitfall trap catches what walks, so a survey of invertebrate diversity uses several methods rather than one.
The number of quadrats is determined from a species-accumulation curve. Plot the running total of species against the number of quadrats placed; the curve rises steeply and then flattens, and sampling stops once it has flattened, because further quadrats add little new information.

Describe the drawing
A square of grassland on the left, filling up with small square quadrats dropped at random positions, beside a graph on the right plotting the running total of species found against the number of quadrats placed. After one quadrat four species are known; after three, seven; after six, ten; after twelve, twelve; and the twenty-fourth quadrat turns up the thirteenth and last species. A dashed line across the graph marks the true total of thirteen, and the curve rises steeply at first and then flattens towards it.
The measure of abundance also affects the index. Percentage cover is the appropriate measure for plants that grow as mats or clumps where individuals cannot be distinguished, and frequency, the proportion of quadrats a species appears in, records presence rather than abundance. Define abundance consistently for an index: counts of individuals are the usual basis, while proportional cover can be used for sessile organisms provided the chosen form of the index and the method are stated. A transect answers a different question: it measures change along a gradient, from the top of a shore to the bottom or outwards from the shade of a wood, and it does not estimate a site average.
Mobile animals are counted differently again, by mark, release and recapture, and the estimate that comes out of it carries assumptions of its own. That belongs with the practical rather than here, but a diversity index built from recapture estimates inherits every one of those assumptions.
Genetic diversity within a species
Two populations of the same species can hold different amounts of genetic variation, and variation is what selection acts on. A population with little allelic variation has fewer variants available if a new disease arrives or conditions change.
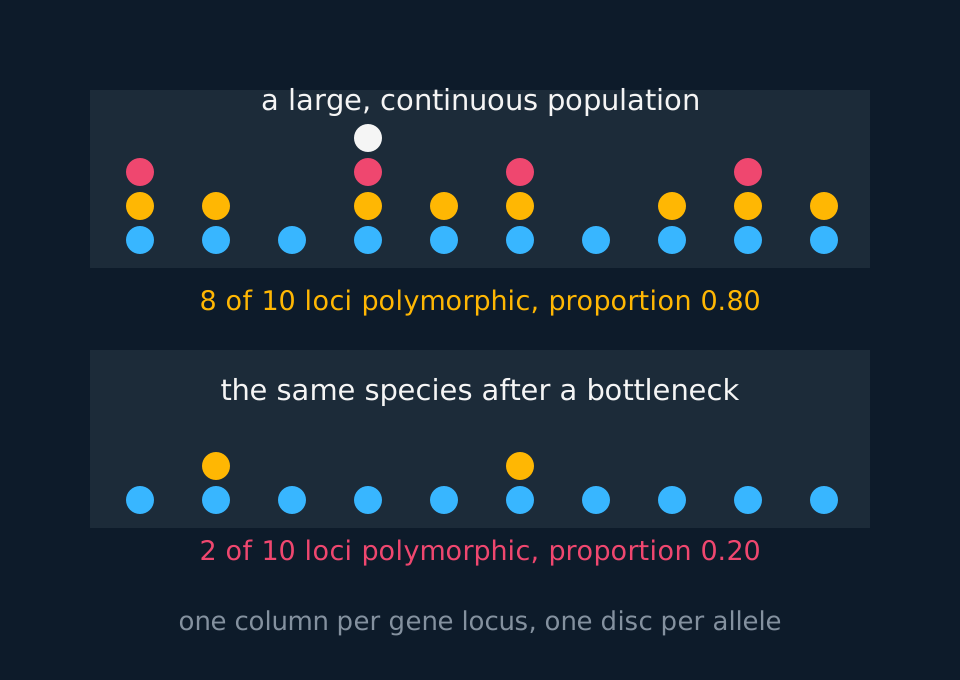
The definition is about alleles. A gene locus is a position on a chromosome; a locus is polymorphic if more than one allele of that gene is present in the population. The standard measure at this level is the proportion of loci that are polymorphic.
proportion of polymorphic gene loci = number of polymorphic loci ÷ total number of loci examinedA proportion between 0 and 1, or a percentage. It depends on which loci were sampled, so two studies are only comparable if they looked at the same ones.
H = number of heterozygotes ÷ number of individuals in the populationThe heterozygosity index, the measure Pearson Edexcel Biology A names, taken at one locus. A population with many heterozygous individuals has a high H; a bottlenecked or inbred one, in which most individuals are homozygous, has a low H.
Describe the drawing
Two rows of ten columns, one column for each gene locus examined and one coloured disc for each different allele found at that locus. The upper row, a large continuous population, has stacks of two, three and four discs at most loci. The lower row, the same species after a population bottleneck, is almost all single discs. Under each row is the count of loci carrying more than one allele and that count expressed as a proportion.
A proportion, and what it does not show
A survey examines 40 gene loci in a population of red squirrels on an island and finds 12 of them carrying more than one allele. On the mainland, the same 40 loci are examined and 26 are polymorphic. Calculate both proportions and comment.
Show the working
Island: 12 ÷ 40 = 0.30. Mainland: 26 ÷ 40 = 0.65.
The island population has less than half the genetic diversity of the mainland one by this measure. The likely reason is history: an island population was founded by a small number of colonists carrying a fraction of the alleles in the source population, and has been isolated since, so nothing has come in to replace what was lost. Small populations also lose alleles by chance from one generation to the next.
The number does not describe the animals' current health, and the island population may be entirely viable. It describes future capacity: a smaller stock of alleles means fewer variants available if squirrelpox or a change in the woodland occurs.
Genetic diversity is measured directly, on molecules. Comparing the base sequence of DNA is the most complete method and is now cheap enough to be routine. Comparing the base sequence of mRNA looks at the genes actually being transcribed in a tissue. Comparing the amino acid sequence of a protein detects the differences that changed the product, and misses the ones the degenerate code absorbed.
Observable characteristics are a poor measure of genetic diversity, for three reasons. Most measurable characteristics are polygenic, so a single phenotype is the summed effect of many loci and cannot be read back to them. Many are strongly affected by the environment, so two genetically different plants raised in the same soil may look alike and two identical ones in different soils may not. And a large amount of allelic variation has no visible effect at all.
Two terms describe the loss of allelic variation through population history. A genetic bottleneck is a sharp reduction in population size that leaves the survivors carrying only a fraction of the original alleles; the northern elephant seal, hunted down to a few dozen animals in the 1890s, now numbers well over a hundred thousand and remains strikingly uniform genetically. The founder effect is the same loss produced by a small group establishing a new population. In both cases numbers can recover quickly and diversity does not, because lost alleles return only by mutation, which is slow, or by gene flow from another population, and an island population or a species reduced to one remnant has no other population to receive them from.
Agriculture and the three levels of diversity
Agriculture occupies most of the land surface of Britain and is a major influence on its biodiversity. Farming favours one crop or livestock species within a field and removes the species that compete with it, over large areas.
Monoculture is a single crop grown over a large area, often as the same crop year after year. The habitat it creates is uniform in structure, uniform in age and harvested at one time, so species requiring a nesting site, a different food plant or a sheltered overwintering place are not supported. Fewer plant species means fewer herbivores, which means fewer predators and parasites, so the loss propagates up the food web.
| Practice | What it removes | Level of diversity affected |
|---|---|---|
| Removing hedgerows to enlarge fields | Nesting sites, shelter, corridors between habitats, hundreds of plant and invertebrate species | Habitat and species |
| Monoculture and continuous cropping | Structural variety and the sequence of flowering and seeding through the year | Species |
| Herbicides | Arable weeds, and the insects that depend on them | Species |
| Pesticides | Target pests, and non-target insects including pollinators and natural enemies | Species |
| Inorganic fertiliser on grassland | The wildflowers of unimproved meadows, outcompeted by a few vigorous grasses | Species, through evenness |
| Draining wetland and ploughing old grassland | Whole habitats that took centuries to develop | Habitat |
| Selective breeding of crops and livestock | Alleles not present in the few high-yielding lines that are grown everywhere | Genetic |
The last row concerns genetic diversity within the crop. Modern varieties are bred from a narrow set of parents and then planted over large areas, so the genetic diversity of a crop across a country can be very low. A pathogen able to overcome the resistance of one variety can affect the whole area planted with it. Resistance alleles are often found in a wild relative or a traditional landrace rather than in the commercial varieties.
Farming is also where most of the practical response happens, because most of the land is farmed. Hedgerows can be kept and replanted; field margins and beetle banks left uncropped give overwintering cover; sowing a crop in spring rather than autumn leaves winter stubble for seed-eating birds; grassland managed without heavy fertiliser keeps its wildflowers. In England these measures are funded through agri-environment schemes such as Countryside Stewardship. Each measure reduces the yield or the cropped area, and the payment compensates for that cost.
Whether to concentrate or spread production is contested. Land taken out of production has to be replaced elsewhere. One position holds that farming intensively on a smaller area and leaving more land uncultivated protects more species overall; the other holds that a landscape farmed less intensively throughout supports the species that depend on farmland itself. The evidence supports different conclusions for different groups of species.
TRY IT: Reading an index the wrong way round
A student samples two woodland plots and calculates, for each, the quantity Σ(n ÷ N)2. Plot A gives 0.61 and plot B gives 0.19. The student concludes that plot A is the more diverse, and adds that plot A must also contain more species.
Identify both errors and give the correct conclusion, including the value of Simpson's index of diversity for each plot.
Check your answer
The first error is direction. Σ(n ÷ N)2 is the probability that two individuals taken at random are the same species, so it measures dominance and falls as diversity rises. A value of 0.61 means that in plot A there is a 61 per cent chance two random individuals are the same species, which is a community dominated by one or two species.
Converting: Simpson's index of diversity is 1 − 0.61 = 0.39 for plot A and 1 − 0.19 = 0.81 for plot B. Plot B is the more diverse.
The second error is about richness. Neither figure says anything directly about the number of species. Plot A could easily contain more species than plot B and still score worse, if most of them are represented by one or two individuals while a single species takes the rest. Richness and evenness are separate quantities, and an index combines them rather than reporting either.
Write the formula before the value, and state which direction it runs in.
In the exam
- State the formula before the arithmetic. Two different forms of Simpson's index are in use and they run in opposite directions, so the value alone does not identify which index has been calculated.
- AQA (as d) and Pearson Edexcel A and B (as D): N(N − 1) ÷ Σn(n − 1). OCR A and Cambridge International: D = 1 − Σ(n ÷ N)², printed in the question. Both rise with diversity, and the letter D stands for a different formula on different boards.
- Keep full precision through the working and round at the end. Rounding each n(n − 1) term or each squared proportion first can change the third significant figure in a close comparison.
- Support 'more diverse' with both components: name the richness and the evenness, as in 'the same four species, but more evenly distributed', rather than quoting the index alone.
- For genetic diversity, give the proportion of polymorphic gene loci as the measure, and give the reason observable characteristics are unsuitable: most are polygenic and are affected by environmental conditions.
- Give a mechanism in an answer about agriculture. 'Hedgerow removal reduces diversity' states the outcome; 'hedgerow removal takes away nesting sites and food plants, so the insect and bird species that depend on them are lost from the farm' gives the mechanism.
Check yourself
A conservation officer samples two ponds. Pond 1 contains four invertebrate species with 50, 30, 15 and 5 individuals. Pond 2 contains six species with 85, 5, 4, 3, 2 and 1 individuals. Using d = N(N − 1) ÷ Σn(n − 1), calculate the index for each, and explain why the pond with more species scores lower.
Answer
Pond 1. N = 50 + 30 + 15 + 5 = 100, so N(N − 1) = 100 × 99 = 9900. The terms are 50 × 49 = 2450, 30 × 29 = 870, 15 × 14 = 210 and 5 × 4 = 20, which add to 3550. d = 9900 ÷ 3550 = 2.79.
Pond 2. N = 85 + 5 + 4 + 3 + 2 + 1 = 100, so N(N − 1) = 9900 again. The terms are 85 × 84 = 7140, 5 × 4 = 20, 4 × 3 = 12, 3 × 2 = 6, 2 × 1 = 2 and 1 × 0 = 0, which add to 7180. d = 9900 ÷ 7180 = 1.38.
Pond 2 has six species to pond 1's four, and scores less than half as high. The reason is evenness. In pond 2, 85 of the 100 individuals belong to a single species, so two individuals picked at random are very likely to be the same species and the denominator is dominated by the 7140 term. The five other species are present at low abundance. One is a single animal, contributing 1 × 0 = 0 to the sum, because a species represented once cannot supply two individuals of the same species.
Pond 1 spreads its hundred individuals across four species with no single one taking more than half, so the sum is far smaller and the index far larger.
The ecological interpretation is that pond 2 may be stressed or recently disturbed, with one tolerant species dominant and the others at low abundance. Species richness alone would rank pond 2 above pond 1.
Questions
Question 15 marks
A farmer is offered a payment to take a strip six metres wide out of production around every field and to replant the hedgerows removed in the 1970s. Evaluate this scheme as a way of raising biodiversity on the farm.
Mark scheme
- B1 for: hedgerows restore habitat diversity, supplying nesting sites, shelter and food plants that a bare field boundary does not, and they link fragments of habitat so that species can move between them
- B1 for: an uncropped margin is neither sprayed nor harvested, so arable weeds survive and the insects feeding on them return, and with them the birds and predators above, so species diversity rises at more than one level in the food web
- B1 against: the strips and hedges take land out of production, so the yield of the farm falls and the same food has to be grown somewhere else, possibly by farming another area more intensively
- B1 against: the scheme does nothing about the genetic diversity of the crop itself, which is bred from a narrow set of parents and planted over enormous areas, and margins cannot recreate habitats such as unimproved grassland that took centuries to develop
- B1 judgement: the scheme is worth doing where hedgerow removal is what reduced diversity, because it addresses that mechanism directly, but it should be judged by measuring richness and evenness on the farm rather than assumed to work, and the payment is needed precisely because the farmer bears the cost in yield and land
Question 24 marks
A student samples the ground beetles of a woodland floor and records four species, with 40, 25, 20 and 15 individuals. Using D = 1 − Σ(n ÷ N)2, calculate Simpson's index of diversity, and state whether a higher value of this form means a more or a less diverse community.
Mark scheme
- M1 N = 40 + 25 + 20 + 15 = 100, and each n ÷ N is that species' proportion of the total: 0.40, 0.25, 0.20 and 0.15
- M1 the squared proportions are 0.1600, 0.0625, 0.0400 and 0.0225, which sum to 0.285
- A1 D = 1 − 0.285 = 0.715, or 0.72 to two decimal places
- B1 a higher value of this form means a more diverse community, because the sum that is subtracted is the probability that two individuals taken at random are the same species and so falls as diversity rises
Question 34 marks
A grassland plot is sampled and five plant species are recorded, with 60, 20, 10, 6 and 4 individuals. Using d = N(N − 1) ÷ Σn(n − 1), calculate the index of diversity for the plot. These counts are idealised.
Mark scheme
- M1 N = 60 + 20 + 10 + 6 + 4 = 100, so N(N − 1) = 100 × 99 = 9900
- M1 the terms n(n − 1) are 60 × 59 = 3540, 20 × 19 = 380, 10 × 9 = 90, 6 × 5 = 30 and 4 × 3 = 12
- A1 Σn(n − 1) = 4052
- A1 d = 9900 ÷ 4052 = 2.44
Question 44 marks
Explain why two communities containing exactly the same number of species can have very different values of an index of diversity.
Mark scheme
- B1 species richness is only a count, and it treats a species represented by one individual exactly like a species represented by a thousand
- B1 an index also depends on evenness, which is how equally the individuals are shared out between the species present
- B1 where one species holds most of the individuals, two organisms taken at random are very likely to belong to the same species, so the dominance term is large and the index of diversity is low
- B1 where the individuals are spread evenly that probability is much lower and the index is high, so two communities of equal richness are separated by evenness alone
Question 54 marks
Using d = N(N − 1) ÷ Σn(n − 1), calculate the index of diversity for each of the two sites in the table, giving each answer to two decimal places.
| Species | Site A: mown lawn | Site B: unmown meadow |
|---|---|---|
| perennial rye-grass | 82 | 30 |
| white clover | 10 | 25 |
| creeping buttercup | 5 | 20 |
| ribwort plantain | 3 | 15 |
| common knapweed | 0 | 10 |
| total individuals | 100 | 100 |
Mark scheme
- M1 for site A, Σn(n − 1) = (82 × 81) + (10 × 9) + (5 × 4) + (3 × 2) = 6758
- A1 d = (100 × 99) ÷ 6758 = 1.46
- M1 for site B, Σn(n − 1) = (30 × 29) + (25 × 24) + (20 × 19) + (15 × 14) + (10 × 9) = 2150
- A1 d = (100 × 99) ÷ 2150 = 4.60
Question 64 marks
Explain the difference between a genetic bottleneck and a founder effect, and explain why the northern elephant seal remains genetically uniform even though its population has recovered to well over a hundred thousand.
Mark scheme
- B1 a genetic bottleneck is a sharp reduction in the size of an existing population, which leaves the survivors carrying only a fraction of the alleles that were present before the reduction
- B1 a founder effect is the same kind of loss of allelic variation, but produced when a small group of individuals establishes a new population rather than by a crash in an existing one
- B1 the northern elephant seal was hunted down to a few dozen animals in the 1890s, which is a bottleneck, and only those few animals' alleles were available to be passed on
- B1 population numbers can recover quickly through births, but the lost alleles are not restored by births; only mutation restores lost alleles, and mutation is slow, so genetic uniformity persists long after numbers have recovered
Question 74 marks
A student says that the habitat with the most individuals in it is the most diverse. Discuss whether this statement is correct.
Mark scheme
- B1 what might seem to support it: a habitat that supports a very large number of individuals often does also support many species, since abundant resources can allow both large populations and many species to coexist
- B1 against: an index of diversity depends on richness and evenness, neither of which is the same thing as the total number of individuals present; a habitat can hold an enormous population of just one or two species and score very low on diversity
- B1 against: a monoculture crop field can hold vastly more individual plants than a species-rich hay meadow of the same area, yet the meadow, with its individuals shared across many species, has by far the higher index of diversity
- B1 judgement: total abundance and diversity are different quantities and are not even reliably correlated; the number of individuals present says nothing on its own about how many species there are or how evenly they share those individuals
Question 83 marks
Describe two different methods of measuring the genetic diversity of a population, and give one limitation of either method.
Mark scheme
- B1 one method described with what is counted or compared, any one of: the proportion of polymorphic gene loci, the number of loci with more than one allele divided by the number of loci examined; the heterozygosity index H, the number of heterozygotes divided by the number of individuals in the population; comparing the base sequence of DNA, or of mRNA, between individuals; comparing the amino acid sequence of a protein between individuals
- B1 a second, different method from the same list, described with what is counted or compared
- B1 a valid limitation of a method described, for example: H describes a single locus, so it has to be found for several loci; mRNA shows only the genes a tissue is transcribing; an amino acid sequence misses base changes the degenerate code absorbs; counting polymorphic loci ignores how common each allele is
Question 93 marks
A student places six quadrats in a meadow and calculates an index of diversity from her counts. Suggest two reasons her index may not describe the meadow, and suggest what she should do about each.
Mark scheme
- B1 if she chose where to put the quadrats, the sample is biased towards whatever caught her eye, so she should number a grid and place the quadrats at coordinates produced by a random number generator
- B1 six quadrats may not be enough: plotting the running total of species against the number of quadrats placed shows whether the curve has flattened, and she should carry on sampling until it has
- B1 if she recorded percentage cover rather than counts of individuals, those figures cannot be put into a form of Simpson's index that uses numbers of individuals, so she should count individuals
Question 103 marks
A heath is one third bare sand and two thirds heather. Describe how stratified sampling would be used to estimate the species diversity of the whole heath.
Mark scheme
- B1 divide the site into the two strata, the sand and the heather, on the basis of what is already known about it
- B1 allocate quadrats to each stratum in proportion to its area, so one third of the quadrats fall on the sand and two thirds on the heather
- B1 place the quadrats within each stratum at random coordinates, record the counts, and combine them to give an index for the whole site
Question 113 marks
Sea otters are never numerous, yet where they were hunted out the kelp forest disappeared and many other species went with it. Suggest why an index of diversity calculated before the otters were lost would not have predicted this.
Mark scheme
- B1 the sea otter is a keystone species, with an effect on the community out of all proportion to its abundance, because it controls the sea urchins that graze the kelp
- B1 an index of diversity is calculated from the number of individuals of each species, so a rare species contributes very little to the value whatever it does
- B1 the index therefore measures composition rather than function, and cannot show which species the structure of the community depends on
Question 123 marks
Compare the two communities in the table, referring to species richness, to how evenly the individuals are shared out, and to what the two indices of diversity say about stability.
| Species | Site A: mown lawn | Site B: unmown meadow |
|---|---|---|
| perennial rye-grass | 82 | 30 |
| white clover | 10 | 25 |
| creeping buttercup | 5 | 20 |
| ribwort plantain | 3 | 15 |
| common knapweed | 0 | 10 |
| index of diversity | 1.46 | 4.60 |
Mark scheme
- B1 site B has five species where site A has four, so it is richer, though only by one
- B1 site A is dominated by one species holding 82 of its 100 individuals, whereas site B's individuals are shared much more evenly, which is why the indices differ by far more than the species counts do
- B1 the higher index at site B suggests a community less dependent on a single species, so a disease or a change of conditions affecting one species would have less effect on the community as a whole
Question 133 marks
A single high-yielding variety of wheat, bred from a narrow set of parent plants, is grown across almost all of a country's wheat fields. Suggest what risk this creates, and suggest where a resistance allele needed to breed a replacement variety is most likely to be found.
Mark scheme
- B1 because nearly every field carries the same narrow genetic background, a pathogen able to overcome that variety's resistance can spread across the whole area planted with it, rather than being contained to a few fields
- B1 a resistance allele effective against the new pathogen may simply be absent from the commercial variety and its few parent lines, since so little of the original genetic diversity of the crop was retained in breeding it
- B1 a wild relative of the crop, or a traditional landrace still grown in small quantities, is more likely to carry alleles that were not selected for or retained in the narrow set of parents used for the modern variety
Question 143 marks
Explain why opportunistic sampling gives a poor basis for estimating the diversity of a whole site, and explain what systematic sampling is better suited to measuring instead.
Mark scheme
- B1 opportunistic sampling uses whatever is conveniently available, such as the organisms found along a path that can be walked without trampling a crop, and whatever makes a location convenient to sample is also likely to make it unrepresentative of the site as a whole
- B1 a sample biased in that way cannot support a claim about the average diversity of the whole site, since the locations chosen were not selected independently of what they happened to contain
- B1 systematic sampling places samples in a regular pattern along a set interval, which makes it well suited to measuring how a variable changes across a gradient, such as along a transect from the top of a shore to the bottom, rather than to estimating a single site average
Question 152 marks
A student collects invertebrates from long grass using a sweep net and transfers them to a container using a pooter. Explain why each piece of equipment is used.
Mark scheme
- B1 the sweep net is swung through the vegetation to dislodge and collect the invertebrates living among the stems, which could not be picked up individually
- B1 the pooter lifts small invertebrates out of the net without handling or damaging them, and its gauze prevents the animals from being drawn into the collector's mouth
Worth remembering
- Richness counts species; evenness describes how the individuals are shared; diversity needs both.
- Σ(n ÷ N)² measures dominance and falls as diversity rises, so it is not an index of diversity.
- OCR A and CAIE: D = 1 − Σ(n ÷ N)², between 0 and 1. AQA (d) and Edexcel (D): N(N − 1) ÷ Σn(n − 1), minimum 1, no maximum. Both rise with diversity.
- Genetic diversity is measured as the proportion of polymorphic gene loci, using DNA, mRNA or amino acid sequences rather than what the organism looks like.
- Monoculture and hedgerow removal cut habitat and species diversity; selective breeding cuts genetic diversity within the crop.
- Non-random sampling comes in three named kinds: opportunistic, stratified and systematic. State which was used and what inference it supports.
- Sweep nets and pooters collect invertebrates from vegetation, pitfall traps collect what walks, and each method is biased in its own way.
- A keystone species has an effect on community structure out of proportion to its abundance, which a diversity index does not register.
CHECK YOUR PROGRESS
Rate how confident you are with each objective for this lesson. Ratings are saved in this browser, on this device, unless you sign in.
- Distinguish species richness from species diversity, and say what evenness adds.
- Calculate an index of diversity using the form your board specifies, and state which form you have used.
- Explain why one Simpson form rises with diversity and the other falls, and interpret a value correctly either way.
- Describe how genetic diversity within a species is measured, and why observable characteristics are a poor measure of it.
- Explain how agriculture and monoculture reduce diversity at the habitat, species and genetic levels, and describe measures that offset this.
- Distinguish random sampling from opportunistic, stratified and systematic sampling, and choose the right collecting equipment for small animals.
Open the full revision checklist to see every objective in the curriculum in one place.
Practise this lesson
Practise measuring biodiversity with 15 original questions and point-by-point mark schemes
WORKBOOK
The written questions from this topic, on paper with room to work, and a separate book of mark schemes. The 2 questions that are set on a diagram stay on this page, where the diagram can be drawn. Free to use; please do not redistribute or sell.
Used later in Populations and their limits