Biology › Ecology, populations and environmental change › Populations and their limits
Populations and their limits
Population size changes through births, deaths, immigration and emigration. Density-dependent factors, including competition, predation and infectious disease, can regulate a population around a carrying capacity; density-independent events can change population size or alter that capacity. Predator and prey populations may cycle, with predator changes often lagging behind prey changes.
Before this Energy transfer between trophic levels · Measuring biodiversity: random sampling · Natural selection and adaptation
COMMON MISCONCEPTION
Predators control the numbers of their prey: that is what keeps a prey population in check.
Predator and prey populations affect one another. Predator peaks often follow prey peaks because reproduction, survival and immigration respond with a delay; prey abundance is also affected by food supply, disease and other density-dependent factors.
What you should be able to do
- Use population, community, habitat and ecosystem as four different words with four different meanings.
- Describe each phase of a sigmoid growth curve in terms of birth rate and death rate.
- Sort a limiting factor into density-dependent or density-independent, and justify the choice.
- Distinguish intraspecific from interspecific competition and predict what each does to a population.
- State the competitive exclusion principle and use the ecological niche to explain it.
- Explain why the predator peak lags the prey peak, and what that lag can and cannot show about predator control.
- Estimate a population by mark, release and recapture, and say which assumption a given problem breaks.
Population, community, habitat and ecosystem
Four terms are used interchangeably in ordinary speech and have distinct meanings in ecology.
- Population
- All the organisms of one species living in the same place at the same time, able to breed with one another.
- Community
- All the populations of all the species living in the same place at the same time.
- Habitat
- The place where an organism lives: a rock pool, a hedgerow, the gut of a cow.
- Ecosystem
- A community together with the non-living surroundings it interacts with, treated as one working unit.
- Abiotic factor
- A non-living influence: temperature, light, pH, water, oxygen, wind, soil depth.
- Biotic factor
- A living influence: competitors, predators, prey, parasites, pathogens, mates.
One species gives one population; all the species together give a community; the community with its abiotic surroundings gives an ecosystem. 'The population of the pond' therefore refers to one species. An ecosystem is dynamic by definition: stability means the changes stay within a range, not that there are none.
Population size changes through four processes: births, deaths, immigration and emigration. The sections below treat the factors that affect them.
The growth curve, and the four phases
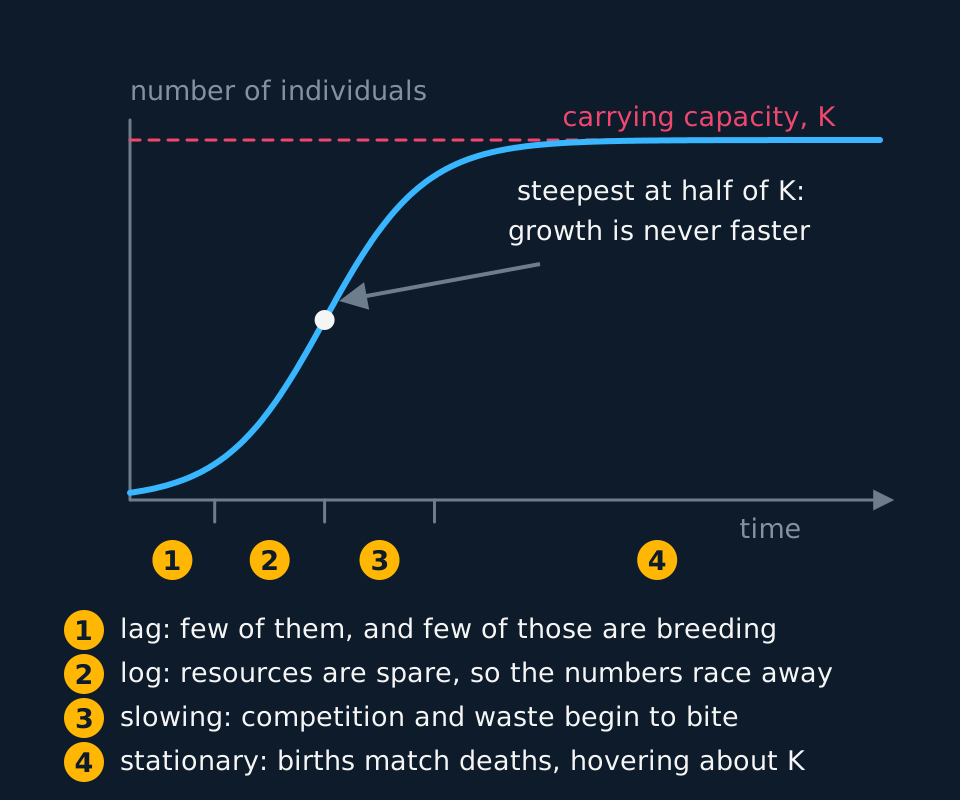
A small number of organisms introduced to suitable conditions with a continuing supply of resources gives a sigmoid growth curve. The same shape is recorded in a flask of yeast, in bacteria on an agar plate, in reindeer introduced to an island and in a species arriving in a new range.
Describe the drawing
A sigmoid population growth curve rising from a handful of individuals to a plateau at the carrying capacity, which is drawn across the graph as a dashed ceiling the curve approaches but never crosses. A dot marks the steepest point of the curve, at exactly half the carrying capacity, and the horizontal axis is divided into four numbered stretches: a slow start, an accelerating stretch, a decelerating stretch and a level stretch, each named underneath.
The lag phase. Numbers barely move, because there are few individuals to reproduce in the first place, so even a healthy birth rate produces very few offspring in absolute terms. Organisms are also acclimatising, and bacteria synthesise the enzymes for a new food source before they can grow on it. That acclimatisation is why a real lag is longer than a mathematical curve predicts.
The log phase. Resources are plentiful and few factors limit growth, so birth rate greatly exceeds death rate. Growth here is exponential: the population multiplies by a constant factor in each equal interval rather than adding a constant number, and twenty doublings takes one bacterium past a million.
The slowing phase. Food per individual falls, waste accumulates, disease spreads more easily between crowded hosts, and nesting or rooting space runs short. Birth rate falls, death rate rises, and the gap between them narrows.
The stationary phase. Birth rate and death rate match. The population fluctuates about a level rather than sitting exactly on it, because the factors setting that level themselves vary with the weather and the season.
- Carrying capacity
- The population size that a particular environment can support over a sustained period, given the resources available in it.
- Exponential growth
- Growth in which the population multiplies by a constant factor per unit time, so the number added per unit time keeps increasing.
Two properties of carrying capacity are examinable. It is not a fixed property of a place: a favourable summer raises it and a drought lowers it, so the value the population fluctuates around changes over time. And a population can exceed it, because the effect of resource depletion on birth and death rates is delayed; an overshoot is usually followed by a decline to below the carrying capacity.
In a closed system such as a sealed flask a fifth phase follows, with numbers falling as food runs out and toxic products accumulate. That death phase belongs to the culture, not to the wild.
Reading a growth curve you have never seen before
Rabbits are released onto an island of grassland with no predators. Numbers rise slowly for two years, then rapidly for four, overshoot to 11 000 in the seventh year, crash to 4 000 in the eighth and settle between 5 000 and 6 000. Account for each part of the pattern.
Show the working
The slow start is the lag phase: the founding group is small, so even a high birth rate produces few offspring, and the rabbits are establishing burrows. The rapid rise is the log phase: grass abundant, no predators, no established diseases, so birth rate far exceeds death rate.
The overshoot to 11 000 happens because the feedback is delayed. Rabbits go on breeding while they graze the grass down faster than it regrows, and the shortage only shows up as deaths and failed litters some months later. The crash to 4 000 is that feedback arriving, and it undershoots because the grassland itself has been damaged.
Settling between 5 000 and 6 000 is the stationary phase: birth rate matches death rate, and the fluctuation is caused by the carrying capacity itself changing from year to year. The 11 000 was not the carrying capacity; it was a peak reached during the overshoot.
Two kinds of limiting factor
Limiting factors are classified by whether their effect intensifies as population density increases.
| Density-dependent | Density-independent | |
|---|---|---|
| What it is | Its effect intensifies as the population becomes more crowded | Its effect is the same whatever the density |
| Usually | Biotic | Abiotic |
| Examples | Competition for food, light, space and mates; predation; parasites; infectious disease; accumulated waste | Extremes of temperature; drought; flood; fire; storms; a pesticide sprayed over a field |
| Effect | Regulates the population around the carrying capacity | Changes population size independently of the starting density |
Only density-dependent factors can hold a population at a carrying capacity, because only they act as negative feedback: more individuals means less food each, so more deaths and fewer births, so fewer individuals. A cold winter has the same effect at any vole density, so it changes population size without regulating it. Infectious disease is density-dependent: transmission rate rises with host density, so an epidemic spreads through a dense seabird colony or a stocked fish farm and does not spread far in a sparse population.
Competition, inside a species and between them
Intraspecific competition is between members of the same species. It is usually the most intense competition an individual faces, for a reason worth stating in an answer: individuals of one species need very nearly the same resources in very nearly the same way, so the overlap is close to total. (Usually, not always: ages, sexes and seasons can pull the overlap apart, and a strong interspecific competitor can matter more.) As the population rises, the share each individual receives falls, breeding success drops, deaths rise, and the population falls. Intraspecific competition is the density-dependent process that produces a carrying capacity.
Interspecific competition is between different species that need some of the same resource. It reduces the population sizes of both, and it restricts the range of conditions in which each can persist. Where the overlap is severe, one species is driven out altogether.
- Niche
- The role a species plays in its community: all the conditions it can tolerate and all the resources it uses, including where it lives, what it eats, what eats it and when it is active.
- Competitive exclusion principle
- Two species cannot occupy the same niche in the same place indefinitely; the better competitor eliminates the other.
A niche is a role, not a place. A habitat is where a species lives; a niche is the whole set of conditions it tolerates and resources it uses. Two species can occupy the same habitat indefinitely; two species cannot occupy the same niche in the same place indefinitely.
Gause demonstrated the principle experimentally in 1934. Grown separately, Paramecium aurelia and Paramecium caudatum each reached a steady population in a tube of the same bacterial culture. Grown together, P. aurelia took over and P. caudatum declined to extinction in the tube. Neither attacked the other; one took up the bacterial food at a slightly higher rate, which was sufficient to exclude the other over successive generations.
In the wild, complete overlap is rare precisely because exclusion has already happened. On a rocky shore, Connell showed that young barnacles of one species settle right down the shore but survive only high up, because a faster-growing species undercuts and smothers them lower down; remove the competitor and they persist much lower. The conditions a species could tolerate are wider than the conditions it is found in, and competition trims one to the other. Ecologists call those two the fundamental and the realised niche.
The same trimming explains coexistence. Where two similar species do live together they usually differ in some dimension: feeding at different heights in one tree, hunting at different times of day, taking different sizes of seed. That is resource partitioning, and it is the alternative to exclusion rather than an exception to it.
Predator and prey cycles
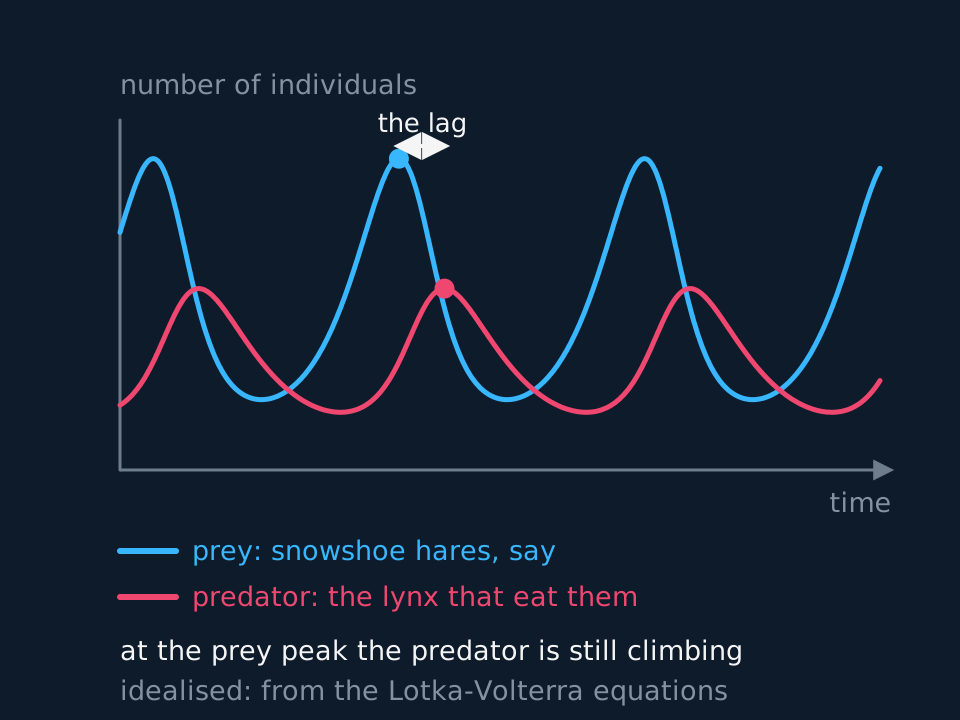
Plotted on the same axes over several decades, the numbers of a predator and its prey give two curves that rise and fall with the same period, the predator curve of smaller amplitude and shifted to the right.
Describe the drawing
Two curves against time on the same axes, one for a prey population and one for its predator, both rising and falling in regular cycles of the same length. The predator curve is the smaller of the two, and every one of its peaks falls to the right of the prey peak before it, by roughly a quarter of a cycle; a double-headed arrow measures that gap between one matched pair of peaks marked with dots.
One cycle proceeds as follows. Prey are abundant, so predators are well fed and more young survive, but gestation and development take time, so the predator population rises months or years later. By the time it has risen, prey are being taken faster than they are replaced, and their numbers fall. Predator numbers are then high relative to the food available, so predator deaths rise and emigration increases, and predator numbers fall in turn. With predation pressure reduced, the prey population recovers and the cycle repeats.
The lag has a stated cause. Predator abundance may respond through increased reproduction and survival, or through immigration, and each response takes time, so a predator peak often follows a prey peak.
The standard example is the Canadian lynx and the snowshoe hare, cycling roughly every ten years in the fur-trade records kept from the 1840s, and it also shows the limits of the interpretation. Hares cycle where lynx are absent, which would not occur if lynx were the sole cause, and the Yukon field experiments quantified the contributions: adding food raised hare density roughly threefold, fencing out predators roughly doubled it, and doing both together raised it about elevenfold. Predation and food supply act together.
State the relation in both directions. Each population affects the other, so predation is not a one-way control of prey numbers. State that the two populations oscillate, that the predator response is delayed, and that the prey's own food supply usually sets the level about which they oscillate.
Mark, release and recapture
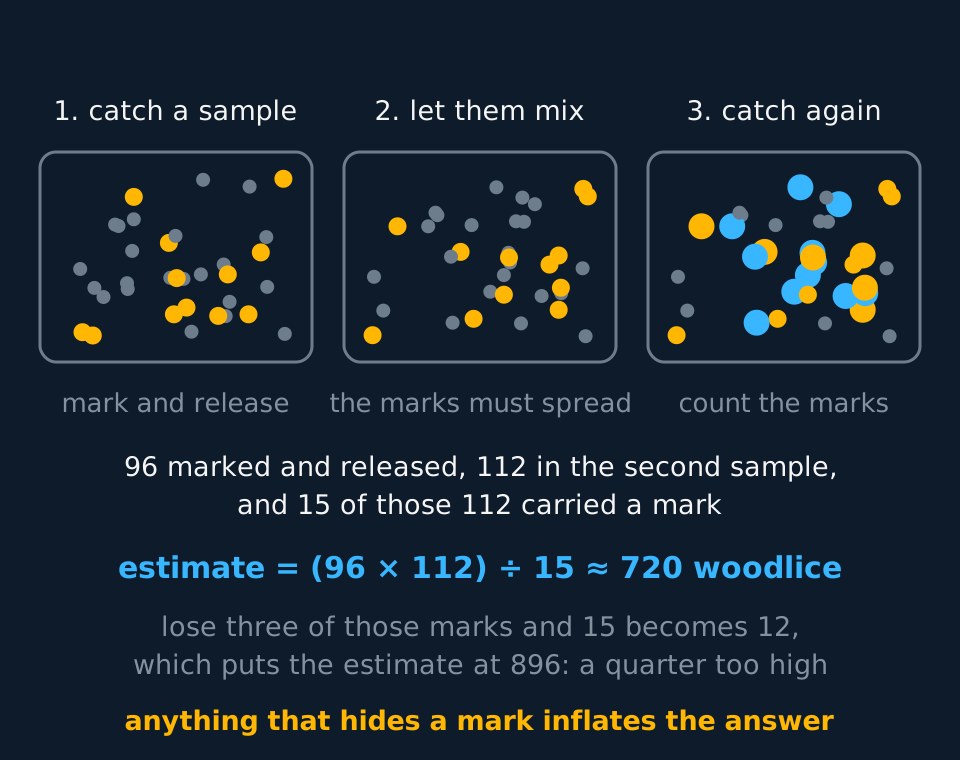
Plants can be counted in a quadrat because they are sessile. Populations of mobile animals such as woodlice, beetles and field voles are estimated instead, by marking a sample, releasing it, and recording the proportion of a later sample that carries a mark.
Describe the drawing
Three panels showing the same enclosure at three moments. In the first, scattered individuals with about a third of them picked out in a bright colour as the marked sample. In the second the same individuals have moved to new positions, the marked ones now spread evenly through the rest. In the third a second sample is highlighted, and within it the marked and the unmarked recaptures are drawn in two different colours. Beneath the panels the two sample sizes and the number of recaptured marks are combined into an estimate, and the same arithmetic is repeated with three of the marks missing.
estimated population = (number in the first sample × number in the second sample) ÷ number in the second sample that were markedThe Lincoln index. Both samples are counts of individuals, so the estimate has no units. It is a number of organisms.
Working an estimate, and then breaking it
A student collects woodlice from a 90 m² patch of leaf litter, marks 96 of them with a dot of non-toxic paint on the underside, and releases them. Two days later she collects again: 112 woodlice, of which 15 carry a mark. Estimate the population and its density. Then work out what her estimate would have been had three of the marks washed off.
Show the working
Put the numbers straight into the index: (96 × 112) ÷ 15 = 10 752 ÷ 15 = 716.8, so about 720 woodlice. Quoting the estimate to one woodlouse implies a precision the method does not have.
Density is the estimate divided by the area: 717 ÷ 90 = 8.0 woodlice per square metre. Give the unit with the value.
If three marks had washed off she would have recorded 12 instead of 15, and the estimate becomes (96 × 112) ÷ 12 = 896, a quarter too high. The recaptured marks sit on the bottom of the fraction, so anything that reduces them inflates the answer. Fewer marks found, bigger estimate; more marks found, smaller one.
The method rests on five assumptions, each of which can fail in a particular way.
| The assumption | What breaks it | Effect on the estimate |
|---|---|---|
| The marked individuals mix back in randomly | Sampling again too soon, or in the same spot | Too many marks found, so too low |
| The mark stays on and stays visible | Paint that washes off, or a mark lost at a moult | Too few marks found, so too high |
| The mark neither harms nor advertises the animal | A bright mark that attracts predators, or a toxic paint | Marked animals removed, so too high |
| The population is closed between the samples | Births, deaths, immigration or emigration in the interval | Unreliable in whichever direction the numbers moved |
| Every individual is equally likely to be caught | Animals that learn to avoid the trap, or to raid it for bait | Trap-shy, too high; trap-happy, too low |
Four practical measures follow from those assumptions. Mark a surface the animal does not use for camouflage; use a paint that is neither toxic nor heavy; leave long enough for mixing but not long enough for a generation to turn over; and take the second sample by the same method over the same area. Exam-board note: Cambridge International names the Lincoln index in its A-level ecology content, while AQA and OCR require the same calculation without using the name.
TRY IT: Which assumption has failed?
A student estimates the ground beetles in a walled garden using pitfall traps. He marks 60 beetles with correction fluid and releases them beside the traps. The next morning he catches 75, of which 30 are marked, giving an estimate of 150, which is far too low for a garden of that size. Suggest two reasons why, and one change to his method for each.
Check your answer
He released the beetles beside the traps and sampled again after a single night, so the marked beetles have not had time or distance to mix back in. They are over-represented around the traps, too many marks turn up, and a large denominator gives a small estimate. He should release them across the whole garden and leave several days.
Pitfall traps that are baited or offer shelter make beetles trap-happy: one caught before and unharmed is more likely to be caught again. Recaptures are inflated and the estimate deflated once more. He should use unbaited traps and reposition them for the second sample.
Both reasons give the same chain: more marks recaptured, larger denominator, smaller estimate. Give that chain rather than stating the direction alone.
In the exam
- Define a niche as a role rather than a place: a definition that remains true when 'habitat' is substituted defines the wrong term.
- State what happens to birth rate and death rate in every phase of a growth curve: 'more food, so birth rate exceeds death rate' rather than 'there is more food'.
- Justify a classification as density-dependent or density-independent with the test: does the effect strengthen as population density rises?
- Define carrying capacity as the population size an environment can sustain, not as the highest value on the graph.
- In a predator-prey answer, state the delay explicitly: predator numbers respond through reproduction, survival or immigration, and each of those takes time.
- In mark-release-recapture, state which way the estimate moves and why: fewer marks recaptured gives a smaller denominator and therefore a larger estimate.
- Quote a population estimate to an appropriate precision and a density with its unit: about 720 woodlice, or 8.0 per square metre, rather than 716.8 woodlice.
Check yourself
Red and grey squirrels both eat tree seeds and both nest in holes in trees. Where greys have been introduced to a British woodland, reds usually disappear within about fifteen years, although greys rarely attack them. Reds still persist in some large conifer forests where greys are present. Explain these observations in terms of niche overlap and competition.
Answer
Reds and greys have very similar niches: the same food and the same nest sites in the same habitat, so interspecific competition between them is heavy. Greys are the better competitors, being larger, storing more fat, and able to digest unripe acorns that reds cannot, so they take a greater share of the shared resource.
Less food and fewer nest sites per red squirrel means a lower birth rate and a higher death rate, so their population falls. Because the niches overlap almost completely, the competitive exclusion principle applies: the weaker competitor is eliminated rather than merely reduced, which is why greys drive reds out without fighting.
The conifer forests are the informative part. There the main food is small conifer seed, which reds handle better than greys, so the overlap between the niches is smaller: the species partition the resource rather than competing for all of it, and coexistence becomes possible. Squirrelpox, a virus greys survive and reds usually do not, is a further density-dependent factor acting alongside the competition.
Questions
Question 15 marks
A land manager claims that the carrying capacity of a grouse moor is a single fixed number, that can be measured once and then used to set the shooting quota every year afterwards. Evaluate this claim.
Mark scheme
- B1 for: at any given time the moor genuinely does support only a limited population, set by the food, nesting sites and other resources available, so there is a real ceiling that can be measured
- B1 for: a measured value gives managers a starting reference for setting a quota, which is better than setting one with no measurement to refer to at all
- B1 against: carrying capacity is not fixed, because the resources available change with the weather, so a good breeding season or a drought raises or lowers the ceiling from one year to the next
- B1 against: a population can temporarily rise above the capacity present at the time before falling back after a delay, so a single count taken during an overshoot could overstate what the habitat can sustain in the long term
- B1 judgement: a single fixed number measured once is not a sound basis for every future year's quota; the quota should instead be reviewed each year against a current measure of resources or population trend
Question 24 marks
Describe the four phases of a sigmoid population growth curve in terms of birth rate and death rate.
Mark scheme
- B1 lag phase: numbers barely move because there are few individuals to reproduce, so even a birth rate above the death rate produces very few offspring, and the organisms are still acclimatising
- B1 log phase: resources are plentiful and little is in the way, so birth rate greatly exceeds death rate and the population multiplies by a constant factor in each equal interval
- B1 slowing phase: food per individual falls, waste accumulates and disease spreads more easily between crowded hosts, so birth rate falls, death rate rises and the gap between them narrows
- B1 stationary phase: birth rate and death rate match, and the population fluctuates about a level rather than sitting on it, because the factors setting that level vary with the weather and the season
Question 34 marks
Explain why the peak in a predator population arrives after the peak in the population of its prey, and explain what that lag shows about the claim that predators control prey numbers.
Mark scheme
- B1 when prey are abundant the predators are well fed and rear more young that survive
- B1 predator abundance responds through reproduction and survival, or through immigration, and each of those takes time, so the rise in predator numbers appears months or years after the rise in prey
- B1 by the time predator numbers have risen the prey are being eaten faster than they breed and fall, so predators then starve and fall in turn, and with predation relieved the prey recover and the cycle repeats
- B1 the lag shows that predator numbers respond to prey abundance; it does not rule out predators controlling prey, since predators that do reduce prey still peak after them, so that claim needs other evidence: the Yukon experiments on snowshoe hares raised density about threefold by adding food, about twofold by excluding predators and about elevenfold by doing both, so the two act together
Question 44 marks
A researcher catches 150 field voles in a wood of area 3.0 hectares, marks them and releases them. A week later she catches 120 voles, of which 18 carry a mark. The estimated population size = (number marked in the first sample × number caught in the second sample) ÷ number of marked animals in the second sample. Calculate the estimated size of the population and calculate its density.
Mark scheme
- M1 (150 × 120) ÷ 18 = 18 000 ÷ 18
- A1 an estimated population of 1000 voles
- M1 density = estimated population ÷ area = 1000 ÷ 3.0
- A1 about 330 voles per hectare, with the unit
Question 54 marks
Larvae of two barnacle species settle across the whole of a rocky shore, but adults of one species are found only high up. When the other species is removed, the first survives much lower down. Explain these observations in terms of niche and competition.
Mark scheme
- B1 a niche is the role a species plays in its community, meaning all the conditions it can tolerate and all the resources it uses, and it is not the same thing as a habitat
- B1 the range of conditions the first species can tolerate is wider than the range in which it is found, because its larvae settle and survive low on the shore when the other species is absent
- B1 lower on the shore the second species grows faster and undercuts or smothers the first, so interspecific competition removes it from that part of the shore without any direct attack
- B1 competition therefore trims the conditions a species could occupy down to the conditions it does occupy, and where two similar species coexist they usually differ in some dimension of the niche instead
Question 64 marks
Give the carrying capacity of the culture from the graph, and calculate the mean rate of increase in the number of cells between day 8 and day 16, giving the unit.
Mark scheme
- B1 the carrying capacity is 5000 cells per cm³, read from where the curve levels off
- M1 reads about 3000 cells per cm³ at day 8 and about 5000 at day 16, accepting values to the nearest 500
- M1 mean rate = change in number ÷ change in time = (5000 − 3000) ÷ 8
- A1 about 250 cells per cm³ per day, with the unit, accepting 220 to 280 from readings inside the range above
Question 74 marks
Gause grew two species of Paramecium, single-celled organisms that feed on bacteria, in tubes of the same bacterial culture. Grown separately, each species increased and then levelled off at a steady population. Grown together in one tube, P. aurelia again reached a steady population, while P. caudatum declined until none were left. Neither species preys on or attacks the other. Explain these results.
Mark scheme
- B1 grown separately, each population grows until it is limited by its food supply, the bacteria, and then births balance deaths at the carrying capacity
- B1 grown together, the two species compete for the same food, so there is interspecific competition between species with the same niche
- B1 P. aurelia must obtain the food more effectively or reproduce faster, so it takes the larger share and leaves too little for P. caudatum, whose death rate then exceeds its birth rate
- B1 two species with the same niche cannot coexist indefinitely in one place, so the better competitor excludes the other
Question 84 marks
Compare intraspecific competition with interspecific competition, referring to which organisms are competing, why one is usually the more intense, and the effect each has on a population.
Mark scheme
- B1 intraspecific competition is between members of the same species, whereas interspecific competition is between members of different species that need some of the same resource
- B1 intraspecific competition is usually the more intense of the two, because individuals of one species need very nearly the same resources in very nearly the same way, whereas different species usually overlap less completely
- B1 intraspecific competition regulates the size of a single population, holding it around a carrying capacity, whereas interspecific competition reduces the population sizes of both species involved
- B1 intraspecific competition does not restrict the range of conditions a species can occupy, whereas severe interspecific competition can exclude a species from part of the range of conditions it could otherwise tolerate
Question 94 marks
Explain how resource partitioning allows two similar species to coexist in the same habitat, rather than one excluding the other by competitive exclusion.
Mark scheme
- B1 species that appear to share a niche usually differ in some dimension of it, such as feeding height, activity time or the size of prey or seed taken, rather than overlapping completely
- B1 that difference reduces how much the two species actually compete for the same resource, even though their niches overlap in other respects
- B1 each species can then obtain resources the other does not fully exploit, so neither drives the other to local extinction
- B1 this resource partitioning, rather than one species occupying the whole of its fundamental niche unchallenged, is the pattern expected where two similar species are found living together
Question 104 marks
Outline the assumptions that the mark, release and recapture method relies on for its population estimate to be reliable.
Mark scheme
- B1 the marked individuals released back into the population mix back in fully at random before the second sample is taken
- B1 the mark stays attached and stays visible throughout the study, without fading, being rubbed off or lost at a moult
- B1 the mark does not affect the survival of the marked individual, for example by attracting predators or being toxic
- B1 the population is closed between the two samples, with no births, deaths, immigration or emigration changing its size in the meantime
Question 113 marks
A student estimates the number of woodlice in a patch of leaf litter, but between her two samples several marked animals moult and lose their marks. Suggest how this affects her estimate, and suggest two changes to her method that would reduce the problem.
Mark scheme
- B1 fewer marked animals are found in the second sample, and that number is the denominator of the index, so a smaller denominator makes the estimated population too high
- B1 she should leave a shorter interval between the samples: long enough for the marked animals to mix back in, but not long enough for many of them to moult
- B1 she should mark only adults, which moult less often than growing juveniles, and give the estimate as one of adults; or sample in cooler weather, when moulting is less frequent
Question 123 marks
A density-dependent factor is one whose effect on a population, such as the proportion of individuals it kills, increases as the population becomes more crowded; a density-independent factor affects the same proportion whatever the density. A gardener lists six factors affecting a population of aphids on his roses: a hard frost in April, an increase in ladybirds that eat the aphids, an insecticide spray, competition for young shoots, a virus that spreads faster between crowded aphids, and a hailstorm. Identify the three factors that are density-dependent.
Mark scheme
- B1 predation by ladybirds is density-dependent, because predators find and eat prey more easily as the density of aphids rises
- B1 competition for young shoots is density-dependent, because the resource available to each aphid falls as more aphids compete for the same limited shoots
- B1 the virus is density-dependent, because a disease that spreads between crowded hosts transmits faster and further as the population becomes denser
Question 133 marks
A biologist estimates a population of crabs in a rock pool by mark and recapture. Some marked crabs learn to enter the baited trap again because it offers food, so they turn up in the second sample more often than an average crab. Suggest what this does to the population estimate, and suggest one change to the method that would reduce the problem.
Mark scheme
- B1 trap-happy crabs are over-represented among the marked crabs recaught, so the proportion of the second sample found to carry a mark is inflated
- B1 that proportion is the denominator of the Lincoln index, so an inflated denominator produces a population estimate that is too low
- B1 using unbaited traps, or a different capture method for the second sample, would stop learned behaviour making a marked crab more likely than an unmarked one to be caught
Question 142 marks
State what is meant by the carrying capacity of a habitat, and state why a population can rise above it for a time.
Mark scheme
- B1 the population size that a particular environment can support over a sustained period, given the resources available in it
- B1 the damage done by too many individuals takes time to feed back as deaths and failed breeding, so the population overshoots and is usually followed by a crash to below the carrying capacity
Question 152 marks
State what distinguishes a population from a community, and state which of the two terms includes every species present in a wood.
Mark scheme
- B1 a population is all the organisms of one species living in the same place at the same time, able to interbreed, whereas a community is every population of every species living there together
- B1 the community is the term that includes every species present, since a population by definition refers to only one of them
Worth remembering
- Population is one species; community is all of them; ecosystem adds the abiotic surroundings.
- A growth curve levels off because birth rate falls and death rate rises until the two are equal.
- Density-dependent factors regulate a population around a carrying capacity; density-independent factors change its size without regulating it.
- Intraspecific competition is usually the most intense, because individuals of one species have almost identical requirements.
- The predator peak follows the prey peak in the classic cycles, because reproduction, survival and immigration all take time to change predator numbers.
- In the Lincoln index, fewer marks recaptured always means a larger estimate.
CHECK YOUR PROGRESS
Rate how confident you are with each objective for this lesson. Ratings are saved in this browser, on this device, unless you sign in.
- Use population, community, habitat and ecosystem as four different words with four different meanings.
- Describe each phase of a sigmoid growth curve in terms of birth rate and death rate.
- Sort a limiting factor into density-dependent or density-independent, and justify the choice.
- Distinguish intraspecific from interspecific competition and predict what each does to a population.
- State the competitive exclusion principle and use the ecological niche to explain it.
- Explain why the predator peak lags the prey peak, and what that lag can and cannot show about predator control.
- Estimate a population by mark, release and recapture, and say which assumption a given problem breaks.
Open the full revision checklist to see every objective in the curriculum in one place.
Practise this lesson
Practise populations and their limits with 15 original questions and point-by-point mark schemes
WORKBOOK
The written questions from this topic, on paper with room to work, and a separate book of mark schemes. The question that is set on a diagram stays on this page, where the diagram can be drawn. Free to use; please do not redistribute or sell.
Used later in Managing ecosystems sustainably