Biology › Inheritance and population genetics › Population genetics and Hardy-Weinberg equilibrium
Population genetics and Hardy-Weinberg equilibrium
The Hardy-Weinberg model predicts genotype frequencies from allele frequencies in a large, randomly mating population with no selection, mutation or migration. The equations are p + q = 1 and p² + 2pq + q² = 1. A significant departure from the prediction indicates that at least one assumption is not met.
Before this Monohybrid inheritance · Meiosis and the origin of variation
COMMON MISCONCEPTION
A dominant allele spreads through a population, because dominant alleles get passed on more.
Dominance describes allele expression in a heterozygote, not allele frequency. Under Hardy-Weinberg conditions (large population, random mating, no selection, mutation or migration), allele and genotype frequencies remain constant between generations.
What you should be able to do
- Define a gene pool and calculate an allele frequency from genotype counts.
- State the Hardy-Weinberg principle and the five conditions it assumes.
- Use p + q = 1 and p² + 2pq + q² = 1 to move between allele and genotype frequencies.
- Calculate carrier frequency from the frequency of a recessive phenotype, and turn frequencies into numbers of individuals.
- Explain what a departure from Hardy-Weinberg proportions shows about a population.
From individuals to a gene pool
Population genetics measures alleles across a whole breeding population rather than through one family. The quantities of interest are the proportion of a population that carries a particular allele, and whether that proportion changes between generations.
- Population
- A group of organisms of the same species living in the same place at the same time and able to interbreed.
- Gene pool
- All the alleles of all the genes present in a population at a given time.
- Allele frequency
- The proportion of all the alleles of a gene in a gene pool that are of one particular kind.
Allele frequencies are counted over alleles rather than over individuals. Every diploid individual carries two alleles of an autosomal gene, so a population of N individuals holds 2N alleles of it. A homozygote contributes two of the same allele and a heterozygote one of each.
Take a population of 100 people in which 36 are AA, 48 are Aa and 16 are aa. There are 200 alleles in total. The count of A is 2 × 36 + 48 = 120, and the count of a is 2 × 16 + 48 = 80. So the frequency of A is 120 ÷ 200 = 0.6 and the frequency of a is 80 ÷ 200 = 0.4. The recessive allele accounts for 40% of the gene pool although only 16% of individuals show the recessive phenotype: allele frequency and phenotype frequency are different quantities.
Those two frequencies are conventionally called p and q. Because the gene in this example has only two alleles, every allele in the pool is one or the other, and so they must account for all of it.
p + q = 1p and q are the frequencies of the two alleles. By convention p denotes the dominant allele, but the equations do not depend on which allele is dominant, or on whether either is. One frequency determines the other.
The genotype equation and its derivation
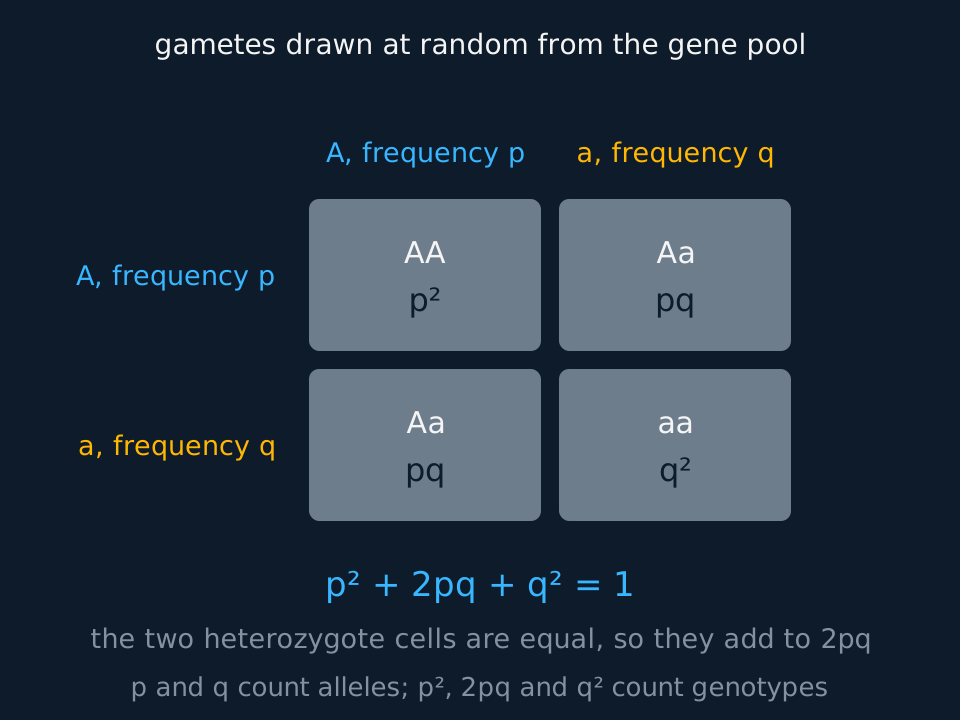
Under random mating, gametes combine without reference to genotype, so a zygote is formed by drawing two alleles at random from the gene pool. The probability of drawing A is p and of drawing a is q, and the two draws are independent. Setting this out as a Punnett square with frequencies in place of alleles gives the second equation.
Describe the drawing
A two-by-two square whose headings are allele frequencies rather than alleles: the dominant allele at frequency p and the recessive at frequency q along the top, the same pair down the side. The four cells hold the genotype and its frequency: capital A capital A at p squared, capital A lower-case a at p q in each of two cells, and lower-case a lower-case a at q squared. The equation p squared plus two p q plus q squared equals one is written below.
p² + 2pq + q² = 1p² is the frequency of the homozygous dominant genotype, 2pq the heterozygous, q² the homozygous recessive. Every individual has one of the three, so the three frequencies add to 1.
Check it against the population counted above. With p = 0.6 and q = 0.4, p² = 0.36, 2pq = 2 × 0.6 × 0.4 = 0.48 and q² = 0.16, predicting 36 AA, 48 Aa and 16 aa in a hundred people, which matches the observed counts. That population is in Hardy-Weinberg equilibrium, and while the conditions hold the proportions remain unchanged between generations.
The Hardy-Weinberg principle states that in a population meeting certain conditions, allele frequencies and genotype frequencies remain constant from generation to generation. It is a null model, in the same sense as the null hypothesis in a chi-squared test: it predicts the frequencies expected in the absence of selection, drift, mutation, non-random mating and migration, so departures from it can be measured.
Exam-board note. AQA examines the principle in section 3.7.2, OCR Biology A in 6.1.2 and Cambridge International in 17.2, in each case as a calculation. Both Pearson Edexcel specifications list it too, Biology A (Salters-Nuffield) in 4.5 and Biology B in 8.3, as a way of checking whether allele frequencies are changing over time.
The equations are written for an autosomal gene with two alleles. A sex-linked gene needs a different treatment, because males carry one copy and females two, and a gene with three alleles, the ABO system for instance, needs a third allele frequency, r, so that p + q + r = 1 and the genotype equation has six terms.
Calculating from the recessive phenotype
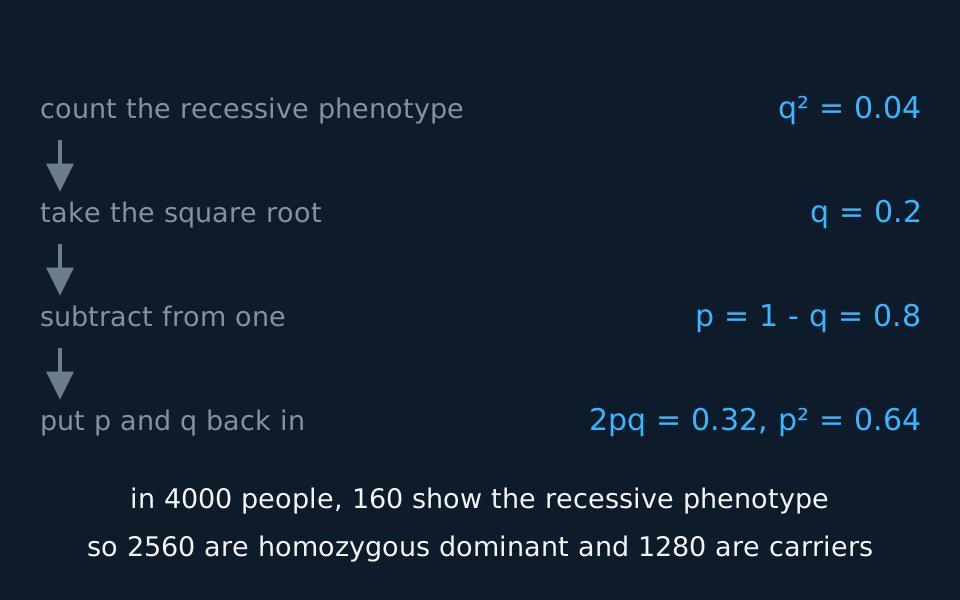
Complete dominance means that homozygous dominant and heterozygous individuals share a phenotype. Individuals showing the recessive phenotype can be counted directly, so q² is the only genotype frequency that can be measured from phenotypes, and the calculation starts there.
Describe the drawing
Four steps listed down the page, each with its result on the right and an arrow leading to the next. Count the recessive phenotype to get q squared as zero point zero four; take the square root to get q as zero point two; subtract from one to get p as zero point eight; substitute back to get two p q as zero point three two and p squared as zero point six four. A line at the bottom turns those frequencies into numbers of people.
The calculation cannot be run from the dominant phenotype. If 84% of a population shows the dominant phenotype, p is not 0.84, because that 84% comprises both p² and 2pq and the two cannot be separated from phenotype data. Subtract instead: the recessive phenotype is 16%, so q² = 0.16, q = 0.4, and p = 0.6.
Carriers in a village
In a population of 4000 people, 160 have a condition caused by a recessive allele. Assuming Hardy-Weinberg equilibrium, calculate the frequency of each allele and the number of people who are carriers.
Show the working
The affected people are the homozygous recessives, so q² = 160 ÷ 4000 = 0.04.
Taking the square root, q = 0.2, and since p + q = 1, p = 0.8.
Carriers are the heterozygotes: 2pq = 2 × 0.8 × 0.2 = 0.32. In a population of 4000 that is 0.32 × 4000 = 1280 people.
Check the totals: p² = 0.64, so 2560 people are homozygous dominant, and 2560 + 1280 + 160 = 4000. The three genotype numbers should sum to the population size.
Eight times as many people carry the allele as show the condition, and heterozygotes cannot be identified from phenotype. That disproportion is one reason recessive conditions persist in populations.
Cystic fibrosis makes the same point with real numbers. It affects roughly 1 in 2500 births in the UK, so q² = 0.0004 and q = 0.02. Then p = 0.98 and 2pq = 2 × 0.98 × 0.02 = 0.0392, so about 3.9% of the population, or roughly 1 person in 25, carries a cystic fibrosis allele without showing the condition. Selection against a recessive allele becomes less effective as the allele becomes rare, because most remaining copies are carried by heterozygotes on which selection does not act through this phenotype.
TRY IT: Starting from the dominant phenotype
The ability to taste the compound PTC is controlled by a dominant allele T. In a sample of 500 people, 420 are tasters. Assuming the population is in Hardy-Weinberg equilibrium, calculate the frequency of the recessive allele and the number of people in the sample expected to be heterozygous.
Check your answer
The non-tasters are the homozygous recessives: 500 − 420 = 80 people, so q² = 80 ÷ 500 = 0.16.
q = √0.16 = 0.4, and p = 1 − 0.4 = 0.6.
Heterozygotes: 2pq = 2 × 0.6 × 0.4 = 0.48, and 0.48 × 500 = 240 people.
So of the 420 tasters, 240 are heterozygous and 180 are homozygous dominant, which you can check as p² × 500 = 0.36 × 500 = 180, and 240 + 180 = 420.
Convert the dominant phenotype frequency into the recessive one by subtraction before substituting. Setting p = 420 ÷ 500 = 0.84 treats a phenotype frequency as an allele frequency, which it is not.
The five conditions, and what a departure indicates
The equilibrium holds only under five conditions, which no real population meets exactly. Each condition, and the consequence of breaking it, is given below.
| Condition | What breaks it | Effect if broken |
|---|---|---|
| The population is large | Small populations, bottlenecks, founder events | Genetic drift: allele frequencies change by chance alone |
| Mating is random | Choosing mates by phenotype, inbreeding, geographic subdivision | Genotype frequencies shift, usually towards an excess of homozygotes |
| There is no selection | Any genotype surviving or reproducing better than another | The favoured allele rises in frequency |
| There is no mutation | New alleles arising, or one allele mutating to another | Slow introduction of new variation |
| There is no migration | Individuals joining or leaving the breeding population | Gene flow imports or removes alleles |
Describe the drawing
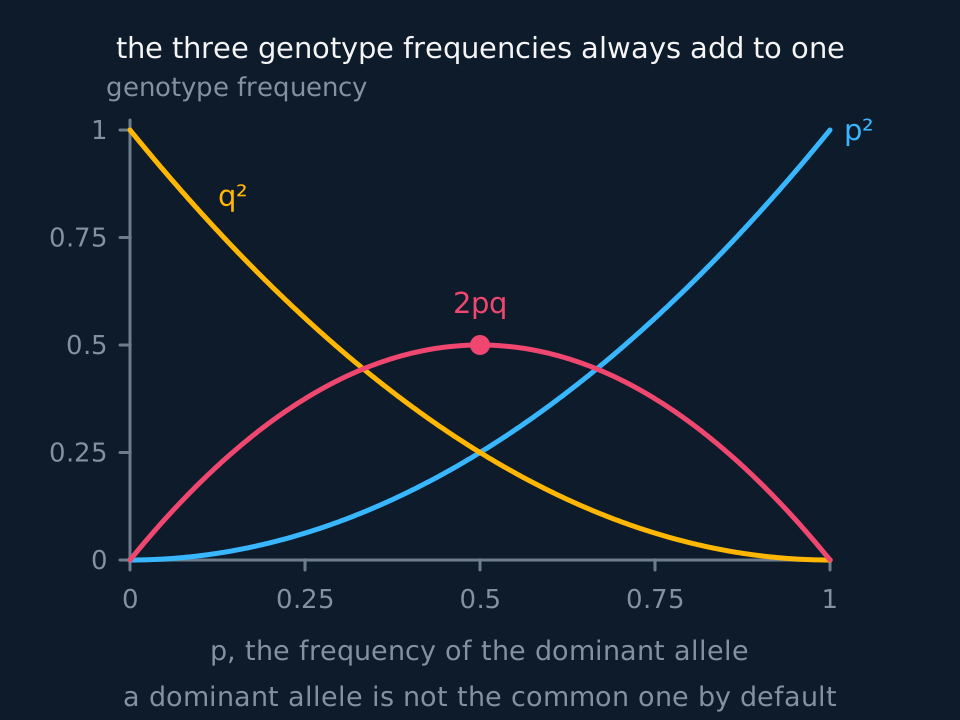
A graph with the frequency of the dominant allele from zero to one along the bottom and genotype frequency from zero to one up the side. Three curves are drawn: p squared rising from zero to one in cyan, q squared falling from one to zero in amber, and two p q in coral, an arch that starts and ends at zero and reaches one half at an allele frequency of one half, marked with a dot.
If a population's observed genotype frequencies differ significantly from the p², 2pq and q² its allele frequencies predict, at least one condition is not being met, and the pattern of the departure narrows down which. An excess of homozygotes and a shortage of heterozygotes points to non-random mating or to a sample that is really two separate populations lumped together. A shortage of one homozygote class points to selection against it, and an excess of heterozygotes to selection in their favour.
Sickle-cell anaemia is a real example. In parts of sub-Saharan Africa the HbS allele occurs at frequencies far higher than selection against affected homozygotes should permit. The reason is that heterozygotes are more resistant to malaria than HbAHbA homozygotes and do not have sickle-cell anaemia, so they are fitter than either homozygote, and this heterozygote advantage maintains the allele at a stable intermediate frequency. The model supplies the expected frequency against which the observed frequency is compared.
The connection to evolution follows from the same comparison. The model predicts constant allele frequencies under its five conditions, so a change in allele frequencies between generations indicates that at least one condition is not met. A change in allele frequency over time is one standard definition of evolution.
State the assumption of equilibrium explicitly in any calculation that uses the equations. Keep allele frequency and genotype frequency separate in the wording: p and q are frequencies of alleles, while p², 2pq and q² are frequencies of genotypes.
In the exam
- Allele frequencies are counted over 2N alleles, not N individuals. A homozygote contributes two copies of the same allele.
- Start from q², the only genotype frequency obtainable from phenotype counts. Take the square root before substituting into p + q = 1.
- p cannot be obtained directly from the frequency of the dominant phenotype, which contains both p² and 2pq. Subtract to find the recessive phenotype first.
- Multiply by the population size when the question asks for a number of individuals, and state the assumption of equilibrium.
- For the five conditions, give all five: large population, random mating, no selection, no mutation, no migration.
Check yourself
A recessive allele causes a metabolic disorder that affects 1 in 10 000 newborns. Assuming Hardy-Weinberg equilibrium, calculate the frequency of the recessive allele and the percentage of the population who are carriers. Then explain why a screening programme that identifies and counsels affected individuals would have almost no effect on the frequency of the allele.
Answer
The affected newborns are homozygous recessive, so q² = 1 ÷ 10 000 = 0.0001 and q = 0.01. Then p = 1 − 0.01 = 0.99.
Carriers are the heterozygotes: 2pq = 2 × 0.99 × 0.01 = 0.0198, so about 2% of the population, or roughly 1 person in 50, carries the allele.
Comparing the two figures answers the second part. For every affected individual there are around 198 carriers, so the overwhelming majority of copies of the recessive allele are in heterozygotes, who show no symptoms and would not be identified by a programme based on phenotype.
Removing the affected individuals from the breeding population therefore removes only a small fraction of the allele's copies, and the frequency falls slowly. The rarer a recessive allele is, the larger the proportion of its copies carried by heterozygotes.
Questions
Question 14 marks
In a population of 5000 people, 450 show a condition caused by a recessive allele. Assuming the population is in Hardy-Weinberg equilibrium, calculate the frequency of each allele and the number of people expected to be heterozygous.
Mark scheme
- M1 the affected people are the homozygous recessives, so q2 = 450 ÷ 5000 = 0.09
- M1 take the square root to get the allele frequency: q = 0.3, and since p + q = 1, p = 0.7
- A1 the heterozygotes are 2pq = 2 × 0.7 × 0.3 = 0.42
- A1 0.42 × 5000 = 2100 people, and a check that 2450 homozygous dominant plus 2100 plus 450 comes back to 5000
Question 24 marks
A sample of 200 snails contains 98 of genotype CC, 84 of genotype Cc and 18 of genotype cc. Calculate the frequency of each allele in the sample, and calculate the number of heterozygotes expected under Hardy-Weinberg equilibrium in order to say whether the sample is at equilibrium.
Mark scheme
- M1 each snail carries two alleles, so the sample holds 2 × 200 = 400 alleles, and the count of C is 2 × 98 + 84 = 280
- A1 p = 280 ÷ 400 = 0.7 for C, and q = 120 ÷ 400 = 0.3 for c, which add to 1 as they must
- M1 the expected number of heterozygotes is 2pq multiplied by the number of individuals: 2 × 0.7 × 0.3 × 200
- A1 84, which is exactly the number observed, so the sample is in Hardy-Weinberg equilibrium
Question 34 marks
Explain why a dominant allele does not become more common in a population simply because it is dominant.
Mark scheme
- B1 dominance describes which allele is expressed in a heterozygous individual, and says nothing about how often the allele occurs in the gene pool
- B1 the two alleles of a heterozygote are equally likely to enter a gamete, because they separate at meiosis independently of which one is expressed
- B1 the Hardy-Weinberg principle predicts that with a large population, random mating, no selection, no mutation and no migration, allele frequencies stay constant from one generation to the next whatever the dominance relationships
- A1 the evidence agrees: polydactyly is caused by a dominant allele and is rare, while the recessive allele for blood group O is the commonest of the three
Question 44 marks
A biologist finds that the observed genotype frequencies in a population of beetles differ significantly from those predicted by its allele frequencies. Explain what this tells the biologist, and explain how the pattern of the difference helps to identify the cause.
Mark scheme
- B1 at least one of the five conditions for Hardy-Weinberg equilibrium is not being met by this population
- B1 an excess of homozygotes and a shortage of heterozygotes points to non-random mating, such as inbreeding, or to a sample that is really two separate populations counted together
- B1 a shortage of one homozygous class points to selection acting against that genotype, so that fewer of those individuals survive to reproduce
- A1 an excess of heterozygotes over the 2pq prediction points instead to selection favouring heterozygotes, as with the sickle-cell allele where malaria is common
Question 54 marks
In parts of sub-Saharan Africa the sickle-cell allele occurs at a far higher frequency than selection against affected homozygotes should allow. Suggest an explanation for this, and suggest why the same allele is rare among populations in northern Europe.
Mark scheme
- B1 heterozygotes are more resistant to malaria than HbAHbA homozygotes and do not have sickle-cell anaemia, so they are fitter than either homozygote, which is a heterozygote advantage
- B1 where malaria is common the heterozygotes therefore survive and reproduce better than the homozygous dominant individuals, so copies of the sickle-cell allele keep being passed on
- B1 selection against the affected homozygotes pushes the frequency down at the same time, so the allele settles at a stable intermediate frequency rather than disappearing
- A1 there is no malaria in northern Europe, so the heterozygote has no advantage there; selection acts only against the affected homozygotes and the allele frequency stays low
Question 64 marks
In a population of 300 rabbits, the frequency of the allele for black fur, B, is 0.3 and the frequency of the allele for brown fur, b, is 0.7. Assuming Hardy-Weinberg equilibrium, calculate the number of rabbits expected to be heterozygous, and calculate the number expected to show the recessive brown phenotype.
Mark scheme
- M1 heterozygote frequency = 2pq = 2 × 0.3 × 0.7 = 0.42
- A1 number of heterozygous rabbits = 0.42 × 300 = 126
- M1 recessive phenotype frequency = q2 = 0.72 = 0.49
- A1 number of brown rabbits = 0.49 × 300 = 147
Question 74 marks
Two neighbouring populations of the same beetle species have different allele frequencies for a colour gene: population 1 has p = 0.8 and population 2 has p = 0.2. A new road is built directly connecting the two populations' habitats, greatly increasing the movement of beetles between them. Suggest what would happen to the allele frequencies of the two populations over the following generations, and suggest what this shows about one of the Hardy-Weinberg conditions.
Mark scheme
- B1 with much more movement of beetles, and therefore alleles, between the two populations, allele frequencies would be expected to move towards each other over successive generations as migration mixes the two gene pools
- B1 population 1's frequency of p would be expected to fall from 0.8 and population 2's frequency of p would be expected to rise from 0.2, tending towards some intermediate, shared value if migration continues
- B1 this shows that 'no migration' is one of the conditions required for Hardy-Weinberg equilibrium, and breaking it by itself is sufficient to change allele frequencies between generations, without any selection, mutation or drift being involved
- B1 the change would be fastest at first, while the two populations differ most, and would slow as their frequencies converge
Question 83 marks
State the five conditions that must hold for a population to be in Hardy-Weinberg equilibrium.
Mark scheme
- B1 the population is very large, so that chance sampling has a negligible effect on allele frequencies
- B1 mating is random with respect to the genotype concerned, and there is no selection acting on that genotype
- B1 there is no mutation and no migration into or out of the population, so no alleles are added to or removed from the gene pool
Question 93 marks
A biologist samples a population of snails and finds significantly more homozygotes and significantly fewer heterozygotes than the Hardy-Weinberg equations predict from the measured allele frequencies, although the allele frequencies themselves have not changed. Explain what this pattern suggests about the population.
Mark scheme
- B1 the excess of homozygotes and shortage of heterozygotes shows the population's genotype frequencies do not match Hardy-Weinberg predictions, so at least one of the five conditions is not being met even though the allele frequencies are unchanged
- B1 this pattern, more homozygotes and fewer heterozygotes without a change in allele frequency, points to non-random mating, such as inbreeding or assortative mating, rather than to selection, mutation or migration, since those would typically also shift the allele frequencies themselves
- B1 it could also indicate that the sample is really two separate, genetically somewhat different subpopulations counted together, since combining two differently shifted populations increases apparent homozygosity in the same way
Question 103 marks
Compare a population that is in Hardy-Weinberg equilibrium with a population that is evolving, referring to what happens to allele frequencies between generations in each.
Mark scheme
- B1 in a population at Hardy-Weinberg equilibrium, allele frequencies remain constant from one generation to the next, because all five conditions are being met, whereas in an evolving population allele frequencies change from one generation to the next, because at least one of those conditions is being broken
- B1 the change in an evolving population is most often caused by selection, but can also be caused by drift, mutation or migration, whereas a population at equilibrium has none of these acting to change its frequencies
- B1 the Hardy-Weinberg principle acts as a null model for evolution: a population's frequencies are compared against the constant values the equations predict, and a measured change is exactly what evolution means in this context
Question 113 marks
Describe the sequence of steps needed to calculate the frequency of heterozygous carriers of a recessive condition in a population, starting from the number of people affected by the condition and the size of the population.
Mark scheme
- B1 first, divide the number of affected people by the population size to obtain q2, the frequency of the homozygous recessive genotype
- B1 second, take the square root of q2 to obtain q, the frequency of the recessive allele, and then calculate p as 1 − q
- B1 third, substitute p and q into 2pq to obtain the frequency of heterozygotes, and multiply this frequency by the population size to convert it into a number of people
Question 123 marks
A recessive genetic disease affects 1 in 90 000 people. A newspaper article states that 'about 1 in 300 people carry the allele, since the square root of 1/90000 is about 1/300'. Suggest what error the article has made in describing 1 in 300 as the carrier frequency, and suggest the calculation that should have been done instead.
Mark scheme
- B1 the article's arithmetic finds q, the frequency of the recessive allele in the gene pool, not the carrier frequency; carriers are heterozygotes, and heterozygote frequency is given by 2pq, not by q alone
- B1 with q ≈ 1/300, p is very close to 1, so the carrier frequency 2pq is roughly twice the reported figure, closer to 1 in 150 than to 1 in 300
- B1 the correct calculation is to find q as before, then calculate p = 1 − q, and substitute both into 2pq
Question 133 marks
Red-green colour blindness is caused by a recessive allele of a gene on the X chromosome, and the Y chromosome carries no copy of the gene. In one population, 8% of males are colour-blind. Assuming the population is in Hardy-Weinberg equilibrium, calculate the percentage of females expected to be colour-blind.
Mark scheme
- M1 a male has one X chromosome and is colour-blind whenever his single allele is the recessive one, so the frequency of that allele is q = 0.08
- M1 a female is colour-blind only if homozygous recessive, with frequency q2 = 0.082
- A1 0.0064, so 0.64% of females, about one in 160
Question 142 marks
State what is meant by the gene pool of a population, and state what is meant by the frequency of an allele.
Mark scheme
- B1 the gene pool is all the alleles of all the genes present in a population at a given time
- B1 an allele frequency is the proportion of all the alleles of that gene in the pool that are of one particular kind
Question 152 marks
Give the two equations of the Hardy-Weinberg principle, stating what each symbol represents.
Mark scheme
- B1 p + q = 1, where p and q are the frequencies of the two alleles of the gene
- B1 p2 + 2pq + q2 = 1, where p2 is the frequency of the homozygous dominant genotype, 2pq the heterozygous genotype and q2 the homozygous recessive genotype
Worth remembering
- A gene pool holds 2N alleles of an autosomal gene in N diploid individuals.
- p + q = 1 for two alleles; p² + 2pq + q² = 1 for the three genotypes they make.
- q² is the frequency of the recessive phenotype, and the square root of it is the allele frequency.
- The five conditions: large population, random mating, no selection, no mutation, no migration.
- A significant departure from the predicted proportions means a condition is being broken, and the pattern of the departure says which.
- Examined by all five specifications: AQA, OCR A, Cambridge International and both Pearson Edexcel specifications.
CHECK YOUR PROGRESS
Rate how confident you are with each objective for this lesson. Ratings are saved in this browser, on this device, unless you sign in.
- Define a gene pool and calculate an allele frequency from genotype counts.
- State the Hardy-Weinberg principle and the five conditions it assumes.
- Use p + q = 1 and p² + 2pq + q² = 1 to move between allele and genotype frequencies.
- Calculate carrier frequency from the frequency of a recessive phenotype, and turn frequencies into numbers of individuals.
- Explain what a departure from Hardy-Weinberg proportions shows about a population.
Open the full revision checklist to see every objective in the curriculum in one place.
Practise this lesson
WORKBOOK
The questions from this topic, on paper with room to work, and a separate book of mark schemes. Free to use; please do not redistribute or sell.
Used later in Measuring biodiversity · Natural selection: variation, selection and allele frequency · Evidence for evolution, resistance and genetic drift