Biology › Inheritance and population genetics › Dihybrid inheritance, linkage, epistasis and the chi-squared test
Dihybrid inheritance, linkage, epistasis and the chi-squared test
A dihybrid cross follows two genes at once and predicts a 9 : 3 : 3 : 1 ratio where the genes assort independently. Autosomal linkage and epistasis each produce a different departure from that expected pattern, and the chi-squared test assesses whether an observed departure is significant.
Before this Monohybrid inheritance · Meiosis and the origin of variation · Statistical tests
COMMON MISCONCEPTION
A significant chi-squared result is the one that supports your genetic hypothesis.
The test runs the other way round. Chi-squared measures how badly the observed numbers disagree with the ones the hypothesis predicted, so a large value is evidence against it. Proposing a 9 : 3 : 3 : 1 ratio, you want a small value and a difference that is not significant.
What you should be able to do
- Work out the gametes a dihybrid parent produces and use them to build a 16-cell Punnett square.
- Predict the 9 : 3 : 3 : 1 and 1 : 1 : 1 : 1 ratios and say what each assumes.
- Recognise autosomal linkage from a test cross result and calculate a recombination frequency.
- Identify epistasis from a modified dihybrid ratio and explain it through a pathway.
- Carry out a chi-squared test in full, from null hypothesis to a conclusion that names the probability.
Two genes, four gametes, sixteen fertilisations
A dihybrid cross follows two genes at once. In Mendel's peas, R gives round seeds and is dominant to r for wrinkled, Y gives yellow cotyledons and is dominant to y for green; RrYy is heterozygous at both loci. The gametes are determined first.
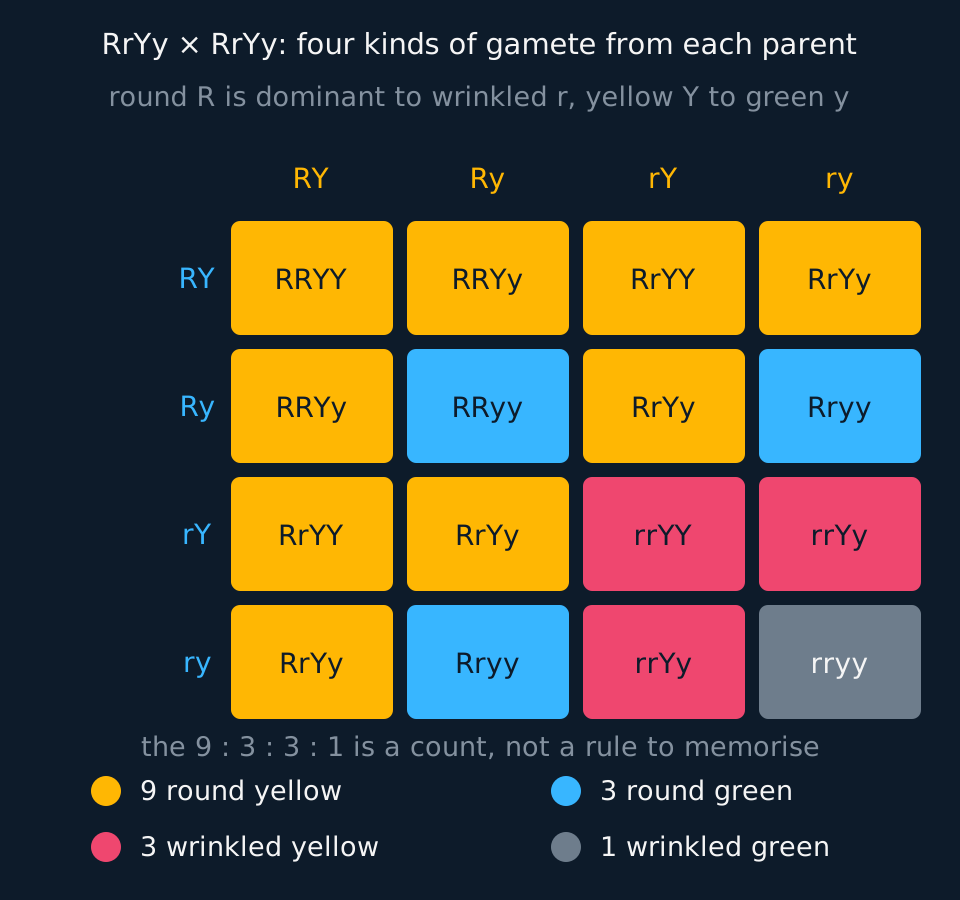
A gamete carries one allele of each gene. Because the two genes are on different chromosomes, the allele received at one locus is independent of the allele received at the other, by independent assortment at metaphase I. RrYy therefore produces four kinds of gamete, RY, Ry, rY and ry, in equal numbers. Combining each allele of the first gene with each allele of the second lists all four.
Describe the drawing
A four-by-four Punnett square. The four gamete types R Y, R y, r Y and r y run along the top and down the side, and each of the sixteen cells holds the four-letter genotype the pair makes. The cells are shaded by phenotype: nine round and yellow, three round and green, three wrinkled and yellow, one wrinkled and green, with a colour key beneath naming each group and its count.
Four gametes from each parent give sixteen combinations, and sorting them by phenotype gives 9 round yellow : 3 round green : 3 wrinkled yellow : 1 wrinkled green. The ratio 9 : 3 : 3 : 1 is the 3 : 1 of one gene multiplied by the 3 : 1 of the other, so the proportion of offspring that are round and green can be obtained directly as ¾ × ¼ = 3⁄16.
The dihybrid test cross is the more useful experiment. Cross RrYy with the double recessive rryy and the second parent contributes ry to every offspring, so the offspring phenotypes simply read out the gametes the first parent made. Four gamete types in equal numbers give 1 : 1 : 1 : 1, so any departure from that ratio is a departure in the proportions of the gametes themselves. That is why a test cross detects linkage.
Both ratios assume that the two genes assort independently, that neither affects the expression of the other, that fertilisation is random and that every genotype survives equally well; 9 : 3 : 3 : 1 also needs complete dominance at each locus. Observed numbers approach the ratios only in a large sample. Autosomal linkage and epistasis are the two departures treated below.
Autosomal linkage and recombination frequency
A human has around 20 000 genes and 23 chromosome pairs, so genes vastly outnumber chromosomes and most pairs of genes must share one. Two genes on the same autosome are autosomally linked, and they cannot assort independently, because they are on the same DNA molecule. The combination of alleles present on one chromosome is usually inherited together.
Crossing over is what stops linkage being absolute. If a chiasma forms between the two loci, the section carrying one of them is exchanged and a recombinant gamete results. The further apart the two genes sit on the chromosome, the more likely a chiasma is to fall between them, so the proportion of recombinants measures the distance between the loci.
Describe the drawing
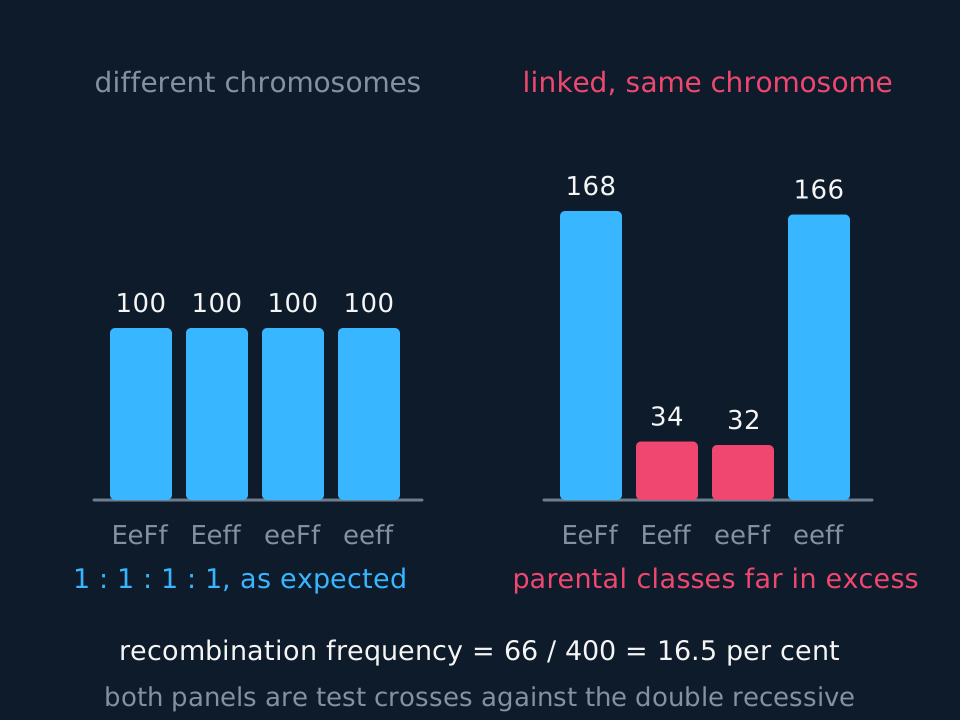
Two bar charts side by side, each showing four offspring classes from a test cross totalling four hundred. On the left, for genes on different chromosomes, the four bars are equal at one hundred each. On the right, for linked genes, the two parental classes stand at one hundred and sixty-eight and one hundred and sixty-six while the two recombinant classes, drawn in coral, reach only thirty-four and thirty-two.
recombination frequency = (number of recombinant offspring ÷ total offspring) × 100%Calculated from a test cross, where the offspring phenotypes are a direct read-out of one parent's gametes.
In the figure's right-hand panel, 34 + 32 = 66 recombinants out of 400 offspring gives a recombination frequency of 16.5%. Values close to zero mean tightly linked genes; values approaching 50% are indistinguishable from independent assortment. The 50% ceiling arises because a crossover involves only two of the four chromatids of a bivalent: even if one fell between the loci in every meiosis, only half the products would be recombinant, and with the loci far apart, multiple crossovers average out to the same half. A value above 50% indicates that the parental classes have been counted as recombinant.
Fruit flies give the standard animal example, and Pearson Edexcel Biology B names it. In Drosophila, grey body (G) is dominant to black (g) and long wing (L) to vestigial (l), and the two genes sit on the same autosome. A GgLl female from a GGLL × ggll cross, test-crossed to a ggll male, gives mostly grey-long and black-vestigial offspring; grey-vestigial and black-long together make up only about 17%. The heterozygote used is a female, because male fruit flies do not cross over.
Identifying which classes are recombinant requires the parental chromosomes. In the figure the heterozygote came from EEFF × eeff, so it received EF on one chromosome and ef on the other, making EeFf and eeff the parental types. Had it come from EEff × eeFF the same four classes would appear with the labels swapped.
The two kinds of linkage are distinct. Sex linkage is one gene present on the X and not the Y; autosomal linkage is two genes on the same non-sex chromosome.
- Autosomal linkage
- The tendency of alleles of genes on the same autosome to be inherited together, unless crossing over separates them.
- Recombination frequency
- The percentage of offspring of a test cross that are recombinant. It rises with the distance between linked loci and does not exceed 50%.
Epistasis and modified dihybrid ratios
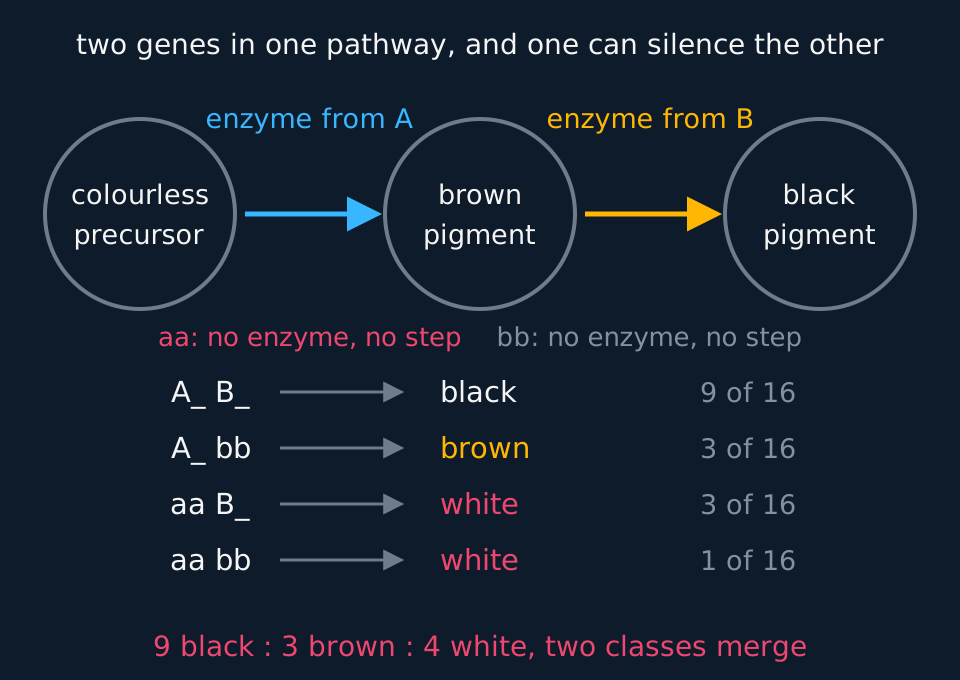
The second common cause of a departure from 9 : 3 : 3 : 1 is that the two genes do not act independently on the phenotype. Epistasis is one gene at one locus affecting the expression of a gene at a different locus. It usually happens because the two gene products act at different steps of the same metabolic pathway, and a block at an early step prevents any later step producing its effect.
Describe the drawing
A two-step pigment pathway drawn across the top: a colourless precursor, an arrow labelled with the enzyme made by gene A leading to brown pigment, and a second arrow labelled with the enzyme from gene B leading to black pigment, each arrow annotated with the homozygous recessive genotype that blocks it. Beneath, the four genotype classes of a dihybrid selfing are listed with the coat colour each gives and its share of sixteen: nine black, three brown, three white and one white.
Epistasis produces a modified dihybrid ratio: a set of numbers that add to 16 but are not 9 : 3 : 3 : 1, because two or more classes have merged. Three patterns are the ones commonly examined.
| Ratio | What is happening | Worked example |
|---|---|---|
| 9 : 3 : 4 | Recessive epistasis: the homozygous recessive at the first locus masks the second gene entirely | aa blocks pigment production, so aaB_ and aabb are both albino |
| 12 : 3 : 1 | Dominant epistasis: one dominant allele at the first locus masks the second gene | A_ produces white fruit whatever the second gene does, so A_B_ and A_bb merge |
| 9 : 7 | Complementary gene action: a dominant allele at both loci is needed for the phenotype | Both enzymes are required for pigment, so A_bb, aaB_ and aabb are all colourless |
Read the merged classes to identify the pattern. In 9 : 3 : 4 the 4 is 3 + 1, the double recessive joined by the class sharing its epistatic genotype; in 12 : 3 : 1 the 12 is 9 + 3; in 9 : 7 the 7 is 3 + 3 + 1, so only the double dominant shows anything at all. A fourth pattern, 13 : 3, turns up occasionally. It is a form of dominant epistasis: a dominant allele at the first locus suppresses the second gene, and the double recessive lacks the dominant allele at the second locus altogether, so A_B_, A_bb and aabb look alike. The 13 is 9 + 3 + 1, and only aaB_, the 3, differs.
Epistasis and linkage are distinguished by what changes. Epistasis changes which phenotypes appear and leaves the totals in sixteenths; linkage leaves the phenotype categories unchanged and alters their proportions in favour of the parental combinations.
- Epistasis
- Interaction between genes at different loci, in which one gene affects or masks the expression of another.
The chi-squared test
Observed numbers do not match predicted ratios exactly, so a genetic experiment ends by asking whether the difference is consistent with sampling variation or whether the hypothesis should be rejected. The chi-squared test answers that question, and it is examined in closely similar terms by AQA, OCR A, Cambridge International and Edexcel B, and by Edexcel A as a maths skill. The formula and critical values are normally given in the paper, so the assessment is of method and conclusion rather than recall.
χ² = Σ (O − E)² ÷ EO is each observed count and E the expected count for the same category. Both must be actual numbers of individuals, never percentages, proportions or the ratio itself.
State the null hypothesis in full. It says that there is no significant difference between the observed results and those expected, here on a 9 : 3 : 3 : 1 ratio. The conclusion must refer back to it.
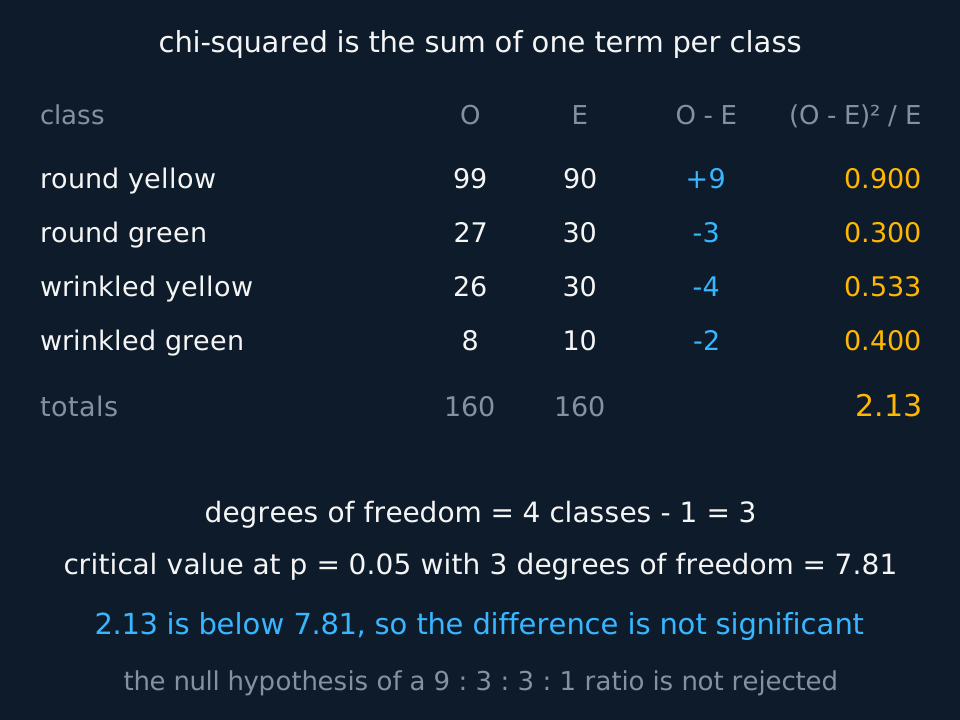
Calculate the expected values from the ratio and the total. With 160 offspring and a 9 : 3 : 3 : 1 prediction the parts add to 16, so one part is 10 and the expected numbers are 90, 30, 30 and 10. These should sum back to the total.
Describe the drawing
A five-column working table for a chi-squared test on a dihybrid cross. The rows are the four phenotype classes; the columns give the observed count, the expected count worked out from the nine to three to three to one ratio, the difference between them, and that difference squared over the expected value. The terms are totalled to the test statistic, and three lines beneath give the degrees of freedom, the critical value at the five per cent level, and the comparison between the two.
Degrees of freedom is the number of categories minus one, so here 4 − 1 = 3. It is not the number of individuals minus one. Once three class totals and the overall total are known, the fourth is fixed, so only three were free to vary.
Compare against the critical value at p = 0.05, the conventional threshold in biology: the value the statistic would exceed only 5% of the time if the null hypothesis were true.
| Degrees of freedom | Critical value at p = 0.05 | Critical value at p = 0.01 |
|---|---|---|
| 1 | 3.84 | 6.63 |
| 2 | 5.99 | 9.21 |
| 3 | 7.81 | 11.34 |
| 4 | 9.49 | 13.28 |
| 5 | 11.07 | 15.09 |
Printed tables differ over one row. At three degrees of freedom the exact critical value is 7.8147, which rounds to 7.81; some school tables print 7.82, having rounded 7.815 upwards at an earlier step. Use the value supplied in your own examination materials. A χ² falling between 7.81 and 7.82 lies at the boundary, and the test does not separate the hypotheses at that value whichever table is used.
If χ² is below the critical value, the difference is not significant: you fail to reject the null hypothesis and attribute the deviation to chance. (Some mark schemes still accept the word 'accept', but the test has not proved the null true, only failed to find evidence against it, and 'fail to reject' says so.) If χ² is equal to or greater than the critical value, the difference is significant at the 5% level: reject the null hypothesis, because a difference this large would arise by chance less than 5 times in 100. Rejecting it does not say what is going on, only that chance alone is not enough: linkage, epistasis and differential survival are then the candidates.
Two limitations apply. Expected values below about 5 make the test unreliable, so a cross in which any class is expected to hold only three individuals does not meet the assumptions. And a non-significant result does not establish a hypothesis; it shows only that the data provide no evidence against it.
A test cross that fails the test
A dihybrid test cross produces 400 offspring in four phenotype classes: 168, 34, 32 and 166. The expected ratio for unlinked genes is 1 : 1 : 1 : 1. Carry out a chi-squared test and state what the result suggests.
Show the working
Null hypothesis: there is no significant difference between the observed numbers and those expected from a 1 : 1 : 1 : 1 ratio.
Expected numbers: 400 ÷ 4 = 100 in each class.
The four terms are (68)² ÷ 100 = 46.24, (−66)² ÷ 100 = 43.56, (−68)² ÷ 100 = 46.24 and (66)² ÷ 100 = 43.56. Adding them gives χ² = 179.6.
Degrees of freedom = 4 − 1 = 3, and the critical value at p = 0.05 is 7.81. Since 179.6 is far greater than 7.81, the difference is significant at the 5% level and the null hypothesis is rejected: a deviation this large would occur by chance less than 5 times in 100.
The pattern identifies the cause. Two classes are in large excess and two are scarce, the expected pattern under autosomal linkage: 168 and 166 are the parental combinations and 34 and 32 the recombinants, a recombination frequency of 66 ÷ 400 × 100 = 16.5%.
TRY IT: Writing the conclusion sentence
A student crosses two heterozygous plants and obtains 88 tall and 24 dwarf offspring, predicting a 3 : 1 ratio. They calculate χ² correctly as 0.76. Write the conclusion they should give, including each element of a complete conclusion.
Check your answer
Expected values: 112 offspring in the ratio 3 : 1 gives 84 tall and 28 dwarf. Degrees of freedom = 2 − 1 = 1, and the critical value at p = 0.05 with 1 degree of freedom is 3.84.
The conclusion: χ² = 0.76 is less than the critical value of 3.84 at p = 0.05 with 1 degree of freedom, so the difference between the observed and expected results is not significant. The null hypothesis is not rejected, and the deviation from a 3 : 1 ratio is attributed to chance.
Four elements are required: the comparison of the statistic with the critical value, the degrees of freedom, the probability level, and a verdict on the null hypothesis. 'It is not significant' supplies only the last of the four.
The degrees of freedom follow from the number of categories in this cross. Two phenotype classes give 1, not the 3 of a dihybrid's four classes.
In the exam
- Write the gametes first. RrYy gives RY, Ry, rY and ry; RR and Yy are genotypes, not gametes.
- State that 9 : 3 : 3 : 1 assumes the genes are on different chromosomes. Where observed numbers depart substantially from it, consider linkage and epistasis.
- Use raw counts in a chi-squared calculation. Percentages and proportions give a different value of the statistic.
- Degrees of freedom is the number of categories minus one, not the number of individuals minus one.
- Give the conclusion in full: statistic against critical value, degrees of freedom, probability level, and a verdict on the null hypothesis.
Check yourself
In a species of rodent, coat colour is controlled by two genes. Allele A is needed for any pigment to be made and is dominant to a; allele B produces black pigment and is dominant to b, which produces brown. Two rodents of genotype AaBb are crossed and produce 96 offspring. Predict the numbers of each coat colour, name the phenomenon involved, and state what a chi-squared test with 2 degrees of freedom would need to show for the prediction to stand.
Answer
The dihybrid classes from AaBb × AaBb are 9 A_B_ : 3 A_bb : 3 aaB_ : 1 aabb. Without allele A no pigment is made, so aaB_ and aabb are both white and merge into one class of 4.
The prediction is therefore 9 black : 3 brown : 4 white. Of 96 offspring, one sixteenth is 6, so the expected numbers are 54 black, 18 brown and 24 white.
The phenomenon is recessive epistasis: the homozygous recessive genotype aa at the first locus masks the expression of the gene at the second locus.
There are three phenotype classes, so degrees of freedom is 3 − 1 = 2 and the critical value at p = 0.05 is 5.99. For the prediction to stand, the calculated χ² must be below 5.99, so that the difference between observed and expected is not significant and the null hypothesis is not rejected.
Questions
Question 15 marks
Two rodents heterozygous at two loci are crossed and produce 160 offspring: 84 black, 36 brown and 40 white. Recessive epistasis predicts a 9 : 3 : 4 ratio. Calculate the value of chi-squared for these results, and state whether the difference between observed and expected numbers is significant at p = 0.05.
Mark scheme
- M1 the parts of the ratio add to 16 and 160 ÷ 16 = 10, so the expected numbers are 90 black, 30 brown and 40 white, which add back to 160
- M1 each term is the difference squared divided by the expected value: 36 ÷ 90, 36 ÷ 30 and 0 ÷ 40
- A1 the terms are 0.40, 1.20 and 0, so chi-squared = 1.6
- B1 there are three phenotype classes, so the degrees of freedom are 3 − 1 = 2 and the critical value at p = 0.05 is 5.99
- A1 1.6 is below 5.99, so the difference is not significant, the null hypothesis is not rejected and the deviation from 9 : 3 : 4 is attributed to chance
Question 24 marks
A pea plant of genotype RrYy is crossed with a plant of genotype rryy. Explain why four phenotypes are expected among the offspring in equal numbers, and explain what a large departure from those equal numbers would suggest.
Mark scheme
- B1 a gamete receives one allele of each gene, and because the two genes are on different chromosomes the choice at one locus is independent of the choice at the other
- B1 this is independent assortment at metaphase I, so RrYy produces RY, Ry, rY and ry in equal numbers
- B1 the double recessive parent contributes ry to every offspring, so the offspring phenotypes read out directly the gametes the first parent made
- A1 a large excess of two classes and a shortage of the other two would suggest the genes are autosomally linked, so they cannot assort independently and only crossing over produces the scarce recombinant classes
Question 34 marks
In a flowering plant, two enzymes act one after the other to convert a colourless precursor into a purple pigment. A cross between two plants heterozygous at both loci gives 9 purple : 7 white offspring. Suggest an explanation for this ratio.
Mark scheme
- B1 this is complementary gene action, a form of epistasis: a dominant allele is needed at both loci for any pigment to be made
- B1 a plant of genotype A_bb makes the first enzyme but not the second, and a plant of genotype aaB_ makes the second but not the first, so in each the pathway is blocked and the flower stays white
- B1 those two classes, 3 and 3 in sixteenths, join the double recessive class of 1, which makes neither enzyme, giving 7 white in every 16
- A1 only the A_B_ class, 9 in every 16, makes both enzymes and completes the pathway to pigment, so the total is still in sixteenths and the classes have merged rather than changed in proportion
Question 44 marks
In a plant, allele A is epistatic to gene B: whenever a dominant A allele is present the flowers are white regardless of genotype at the B locus, and only aaB_ gives blue while aabb gives yellow. A cross between two double heterozygotes AaBb is carried out. Explain how many of the sixteen offspring in the standard dihybrid ratio would be expected to be white, and explain why this is called dominant epistasis.
Mark scheme
- B1 the standard dihybrid cross AaBb × AaBb gives the four genotype classes in the ratio 9 A_B_ : 3 A_bb : 3 aaB_ : 1 aabb
- B1 the two classes carrying a dominant A allele, 9 A_B_ and 3 A_bb, both show white flowers because a dominant A allele masks the B locus entirely, so these merge into a white class of 9 + 3 = 12
- B1 this leaves 3 aaB_ giving blue and 1 aabb giving yellow, so the overall ratio is 12 white : 3 blue : 1 yellow
- B1 it is called dominant epistasis because it is a single dominant allele, A, at the first locus, rather than the homozygous recessive genotype, that masks the expression of the second gene
Question 54 marks
A test cross between a doubly heterozygous fruit fly and a double recessive fly produces 500 offspring: 195 and 205 in the two parental phenotype classes, and 55 and 45 in the two recombinant classes. Calculate the recombination frequency between the two genes. A second, independent cross of the same kind produces 800 offspring; calculate the number of recombinant offspring you would expect among them, assuming the same recombination frequency.
Mark scheme
- M1 recombinants = 55 + 45 = 100, out of a total of 500 offspring
- A1 recombination frequency = 100 ÷ 500 × 100 = 20%
- M1 for the second cross, apply the same percentage to the new total: 20% × 800
- A1 = 160 recombinant offspring expected among the 800
Question 63 marks
A test cross between a doubly heterozygous fruit fly and a double recessive produces 300 offspring in four phenotype classes: 145, 15, 12 and 128. The recombination frequency is the number of recombinant offspring divided by the total number of offspring, multiplied by 100. Calculate the recombination frequency for these two genes.
Mark scheme
- M1 the genes are linked, so the two classes in large excess, 145 and 128, are the parental combinations and the recombinants are the two scarce classes: 15 + 12 = 27
- M1 27 ÷ 300 × 100
- A1 9 per cent
Question 73 marks
Compare the effect of autosomal linkage with the effect of epistasis on the offspring numbers obtained from a cross involving two genes.
Mark scheme
- B1 linkage arises because the two genes sit on the same chromosome and cannot assort independently, whereas epistasis arises because one gene affects the expression of the gene at the other locus, usually through a shared pathway
- B1 linkage leaves all the phenotype classes present but shifts the proportions heavily in favour of the parental combinations, whereas epistasis merges classes so fewer phenotypes appear
- B1 an epistatic ratio still adds to sixteen parts, such as 9 : 3 : 4 or 9 : 7, whereas a linked test cross departs from 1 : 1 : 1 : 1 by an amount that measures the distance between the loci
Question 83 marks
Compare the 9 : 3 : 4 ratio produced by recessive epistasis with the 9 : 7 ratio produced by complementary gene action, referring to which genotypes are merged into the largest class in each case.
Mark scheme
- B1 in 9 : 3 : 4 the double recessive class, 1, merges with one of the single-recessive classes, 3, that shares the same masked phenotype, because the homozygous recessive genotype at the first locus masks the second gene in both classes
- B1 in 9 : 7, three classes merge instead of two: A_bb, aaB_ and aabb all lack a functioning pathway, because a dominant allele is needed at both loci for the product to be made, so 3 + 3 + 1 = 7 merge together and only the double dominant class, 9, shows the phenotype
- B1 the more classes that share the same underlying block in a shared pathway, the larger the merged class becomes and the fewer distinguishable phenotypes remain, which is why 9 : 7 shows only two phenotypes while 9 : 3 : 4 shows three
Question 93 marks
A student concludes a chi-squared test on a dihybrid cross by writing 'the null hypothesis is proved correct'. Explain why this conclusion is not appropriate, and explain what should be written instead when a calculated χ² value is below the critical value.
Mark scheme
- B1 a χ² value below the critical value shows only that the data provide no evidence against the null hypothesis, not that the null hypothesis has been shown to be true, so 'proved correct' overstates what the test can show
- B1 the correct wording is that the null hypothesis is not rejected, because failing to find evidence against something is a different logical claim from confirming it
- B1 other explanations besides the null hypothesis being exactly true could also produce a low, non-significant χ² value, including a sample too small to detect a real but modest departure from the expected ratio
Question 103 marks
A dihybrid cross produces offspring in four phenotype classes. Explain why the degrees of freedom used in a chi-squared test on this cross is 3 rather than 4.
Mark scheme
- B1 degrees of freedom is the number of categories minus one, so with four phenotype classes it is 4 − 1 = 3
- B1 this is because once the total number of offspring and any three of the four class totals are known, the fourth class total is fixed automatically, so only three of the four values are genuinely free to vary
- B1 degrees of freedom is not related to the number of individual offspring in the cross, so a cross of 100 offspring and one of 1000 offspring in four classes both have 3 degrees of freedom
Question 113 marks
A dihybrid test cross produces only 12 offspring in total, expected in a 1 : 1 : 1 : 1 ratio. Suggest why a chi-squared test would not be reliable on this data set, and suggest what the student should do instead.
Mark scheme
- B1 with only 12 offspring split across four classes the expected number in each class is 12 ÷ 4 = 3, well below the usual minimum of about 5 for a reliable chi-squared test
- B1 with such small expected values the test statistic does not follow the distribution the critical-value table assumes closely enough, so the conclusion drawn from comparing it with the table could be misleading
- B1 the student should repeat the cross to obtain a much larger sample of offspring before applying the test
Question 123 marks
Describe how a dihybrid test cross is set out, and describe what result would be expected if the two genes assort independently.
Mark scheme
- B1 an individual heterozygous at both loci, such as RrYy, is crossed with a double recessive individual, rryy
- B1 because the double recessive parent can only contribute the recessive allele of each gene, the phenotypes of the offspring directly show which gametes the heterozygous parent produced
- B1 if the two genes assort independently, the heterozygous parent produces four kinds of gamete, RY, Ry, rY and ry, in equal numbers, so the offspring phenotypes are expected in a 1 : 1 : 1 : 1 ratio
Question 133 marks
A dihybrid cross between two heterozygous mice gives approximately 9 : 3 : 3 : 1 in three separate trials, but a fourth trial with a different pair of genes gives approximately 13 : 3. Identify which phenomenon, linkage or epistasis, is more likely to explain the 13 : 3 result, and identify the pattern this ratio corresponds to.
Mark scheme
- B1 epistasis is more likely: the classes are still expressed in whole sixteenths, since 13 and 3 add to 16, which is the signature of epistasis merging categories, rather than linkage, which distorts the proportions among the parental and recombinant classes without keeping simple sixteenths
- B1 13 : 3 is 9 + 3 + 1 = 13 merged against 3 remaining, so three of the four dihybrid classes merge and only one class, 3 in sixteenths, remains phenotypically distinct
- B1 this is a form of dominant epistasis: every individual with a dominant allele at the first locus (9 + 3) shares a phenotype with the double recessive (1), and only the 3 that are homozygous recessive at the first locus but carry a dominant allele at the second differ
Question 142 marks
State the phenotype ratio expected among the offspring of a cross between two organisms heterozygous at two unlinked loci, and state the ratio expected from a dihybrid test cross.
Mark scheme
- B1 9 : 3 : 3 : 1 from the cross between two double heterozygotes
- B1 1 : 1 : 1 : 1 from the dihybrid test cross
Question 152 marks
In a test cross, the recombination frequency between two genes is the percentage of offspring that carry a new combination of the parents' alleles. Explain why the recombination frequency between two genes on different chromosomes is 50%, and explain why crossing over between two genes on the same chromosome can never make more than half of the gametes from a meiosis recombinant.
Mark scheme
- B1 genes on different chromosomes assort independently, so a test cross gives four classes in a 1 : 1 : 1 : 1 ratio, and the two recombinant classes together make up exactly half of the offspring
- B1 each crossover involves only two of the four chromatids of a bivalent, so even a crossover between the loci in every meiosis makes only half the gametes recombinant; multiple crossovers between distant loci average out to the same half
Worth remembering
- RrYy makes four gametes in equal numbers; a dihybrid selfing gives 9 : 3 : 3 : 1 and a dihybrid test cross gives 1 : 1 : 1 : 1.
- Linkage appears as an excess of the two parental classes; recombination frequency is recombinants over total, and does not exceed 50%.
- Epistasis merges classes and keeps the total in sixteenths: 9 : 3 : 4, 12 : 3 : 1 and 9 : 7 are the ones to recognise.
- χ² = Σ (O − E)² ÷ E, on raw counts, with expected values built from the ratio.
- Degrees of freedom = categories − 1; at p = 0.05 the critical values run 3.84, 5.99, 7.81, 9.49, 11.07 for 1 to 5 degrees of freedom.
- A large χ² is evidence against the null hypothesis, not evidence for the genetic hypothesis being tested.
CHECK YOUR PROGRESS
Rate how confident you are with each objective for this lesson. Ratings are saved in this browser, on this device, unless you sign in.
- Work out the gametes a dihybrid parent produces and use them to build a 16-cell Punnett square.
- Predict the 9 : 3 : 3 : 1 and 1 : 1 : 1 : 1 ratios and say what each assumes.
- Recognise autosomal linkage from a test cross result and calculate a recombination frequency.
- Identify epistasis from a modified dihybrid ratio and explain it through a pathway.
- Carry out a chi-squared test in full, from null hypothesis to a conclusion that names the probability.
Open the full revision checklist to see every objective in the curriculum in one place.
Practise this lesson
WORKBOOK
The questions from this topic, on paper with room to work, and a separate book of mark schemes. Free to use; please do not redistribute or sell.