Chemistry › Acids and bases › Titration curves and choosing an indicator
Titration curves and choosing an indicator
As sodium hydroxide runs into an acid, a pH probe in the beaker shows the reading creeping up, then leaping by several units for a few drops, then creeping again. Where that leap sits and how tall it is depends on whether the acid and the base are strong or weak. The leap decides which indicator will work, and the halfway point of a weak acid's curve gives its pKa directly.
Key terms Every definition in acids and bases, lesson by lesson
Before this Concentration, volumetric solutions and titration calculations – the volume at the end point from the balanced equation · Weak acids, Ka and pKa; Kw and strong bases – the pH of a weak acid and of a strong base
COMMON MISCONCEPTION
Every titration ends at pH 7, because that is where the acid and the alkali have cancelled each other out.
Equivalence is where the moles match, and the pH there depends on the salt formed. Ethanoic acid against sodium hydroxide reaches equivalence near pH 9, because ethanoate is a weak base; hydrochloric acid against ammonia reaches it near pH 5. Only strong against strong gives pH 7.
What you should be able to do
- Sketch the pH curves for the four combinations of strong and weak acid and base, with the start pH, vertical section and equivalence pH of each.
- Explain why the pH at equivalence is above 7 for a weak acid with a strong base and below 7 for a strong acid with a weak base.
- Show that pH = pKa at the half-neutralisation point, and use it to find Ka from a pH curve.
- Choose an indicator whose range lies on the vertical section, and explain why none suits a weak acid–weak base titration.
- Carry out and evaluate the pH-curve practical, including the calibration of a pH meter.
Following a titration with a pH meter
A pH curve records how the pH of an acid changes as a base is added. For 25.0 cm³ of 0.100 mol dm⁻³ hydrochloric acid with 0.100 mol dm⁻³ sodium hydroxide run in from a burette, the reading barely moves over the first 20 cm³, from 1.00 to 1.95. Between 24.90 and 25.10 cm³, about four drops, it jumps from 3.70 to 10.30. After that it creeps again, reaching 12.52 at 50.0 cm³. A plot of pH against volume added is a pH curve, also called a titration curve.
The shape comes from the logarithm. After 20 cm³ of alkali, [H⁺] has fallen ninefold, which is less than one pH unit. Close to equivalence so little H⁺ is left that each drop removes most of it, and once it has gone each drop adds OH⁻ to a solution that had almost none. Across those four drops [H⁺] falls by a factor of about four million, which is 6.6 pH units.
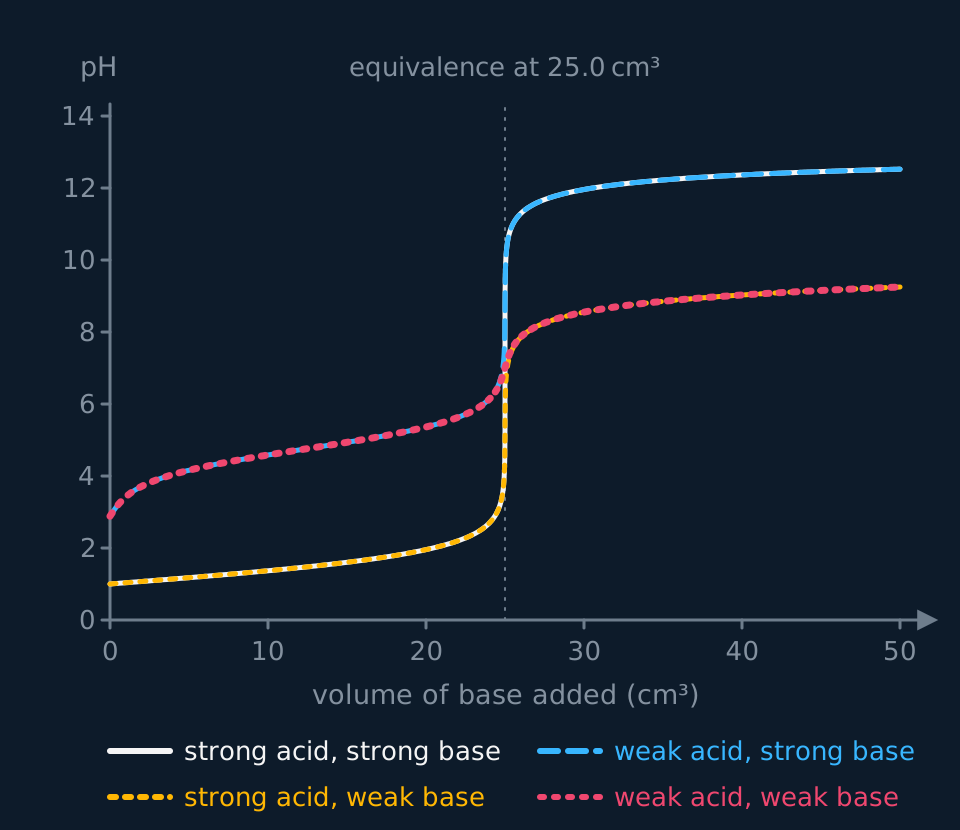
Every pH curve has the same four landmarks, and a sketch needs each in the right place. The starting pH is set by the acid. The vertical section is the steep part, where a drop moves the pH by several units. The equivalence point sits in the middle of it, where the moles of base added equal the moles of acid at the start. The final pH approaches the pH of the base itself. If the acid is run into the base instead, the curve is reflected: it starts high and falls.
Describe the drawing
Four pH curves on one set of axes, pH from 0 to 14 against volume of base from 0 to 50 cm³, with a dotted line at the equivalence volume of 25.0 cm³. Strong acid with strong base rises from 1.00 through a near-vertical section from about 3.5 to 10.5 and levels at 12.52. Weak acid with strong base starts at 2.88, rises gently through 4.76 at 12.5 cm³, jumps from about 7 to 10.5 and then joins the first. Strong acid with weak base follows the first curve, jumps from about 3.5 to 7 and levels at 9.25. Weak acid with weak base passes gently through 7.0 at 25.0 cm³ with no steep section.

Describe the drawing
A pH curve for 25.0 cm³ of 0.100 mol dm⁻³ hydrochloric acid drawn in four stages as 0.100 mol dm⁻³ sodium hydroxide is added, on axes of pH from 0 to 14 against volume from 0 to 50 cm³. An amber dot marks the latest reading. After 10 cm³ the pH is 1.37; after 24.90 cm³ it is still only 3.70. Between 24.90 and 25.10 cm³ the curve shoots almost vertically to 10.30, at the dotted equivalence line, and by 50 cm³ it has levelled at 12.52.
- pH curve
- A graph of the pH of the solution against the volume of acid or base added during a titration.
- Equivalence point
- The point in a titration at which the amount of base added exactly reacts with the amount of acid present, according to the balanced equation.
- Vertical section
- The steep part of a pH curve around the equivalence point, where a very small volume added changes the pH by several units.
Four combinations, four curves
The four curves differ at the start, in the vertical section and at equivalence. For 25.0 cm³ of 0.100 mol dm⁻³ acid with 0.100 mol dm⁻³ base, with ethanoic acid and ammonia as the weak partners, the landmarks are these.
| Acid and base | Start pH | Vertical section | pH at equivalence | pH at 50.0 cm³ |
|---|---|---|---|---|
| Strong acid, strong base (HCl, NaOH) | 1.00 | about 3.5 to 10.5 | 7.00 | 12.52 |
| Weak acid, strong base (CH₃COOH, NaOH) | 2.88 | about 7 to 10.5 | 8.73 | 12.52 |
| Strong acid, weak base (HCl, NH₃) | 1.00 | about 3.5 to 7 | 5.28 | 9.25 |
| Weak acid, weak base (CH₃COOH, NH₃) | 2.88 | none; about 6 to 8 over 2 cm³ | about 7.0 | 9.25 |
The start is the pH of the acid alone: 1.00 for the strong acid, 2.88 for the weak one at the same concentration. The end approaches the pH of the base. The two ammonia curves level off far lower than the sodium hydroxide ones, because by 50.0 cm³ the solution holds equal amounts of NH₃ and NH₄⁺ and its pH equals the pKa of the ammonium ion, 9.25.
Past equivalence the two sodium hydroxide curves run together. Once the acid has gone, the pH is set by the excess OH⁻: at 50.0 cm³, 2.50 × 10⁻³ mol of OH⁻ in 75.0 cm³ gives [OH⁻] = 0.0333 mol dm⁻³ and pH 12.52 in both. The ethanoate ions in the second beaker add a negligible amount of OH⁻ beside that excess.
The equivalence pH is the pH of the salt solution formed, and an explanation of it has to name the ion that reacts with water. Sodium chloride is neutral, because neither Na⁺ nor Cl⁻ reacts with water, so the strong–strong equivalence point is at 7.00. Sodium ethanoate is not neutral. The ethanoate ion is the conjugate base of a weak acid and takes protons from water, making OH⁻, so the solution at equivalence is alkaline, pH 8.73 here.
CH₃COO⁻(aq) + H₂O(l) ⇌ CH₃COOH(aq) + OH⁻(aq)Why a weak acid–strong base equivalence point is above 7.
Ammonium chloride is the mirror image. The ammonium ion is a weak acid and gives protons to water, so the strong acid–weak base equivalence point is acidic, pH 5.28.
NH₄⁺(aq) + H₂O(l) ⇌ NH₃(aq) + H₃O⁺(aq)Why a strong acid–weak base equivalence point is below 7.
In the weak acid–weak base titration both effects act at once. Before equivalence the beaker holds ethanoic acid with ethanoate ions, after it ammonia with ammonium ions, and each mixture resists change. The pH climbs from about 6 to 8 over two whole cubic centimetres, with no steep section at all. Its equivalence point is near 7 only because the pKa values of ethanoic acid, 4.76, and the ammonium ion, 9.25, happen to sit almost equally far either side of 7.
In all four, equivalence is at 25.0 cm³. The equivalence volume is fixed by the moles in the balanced equation and nothing else. Strength changes the pH along the way, not where equivalence falls.
Half-neutralisation: pKa from the curve
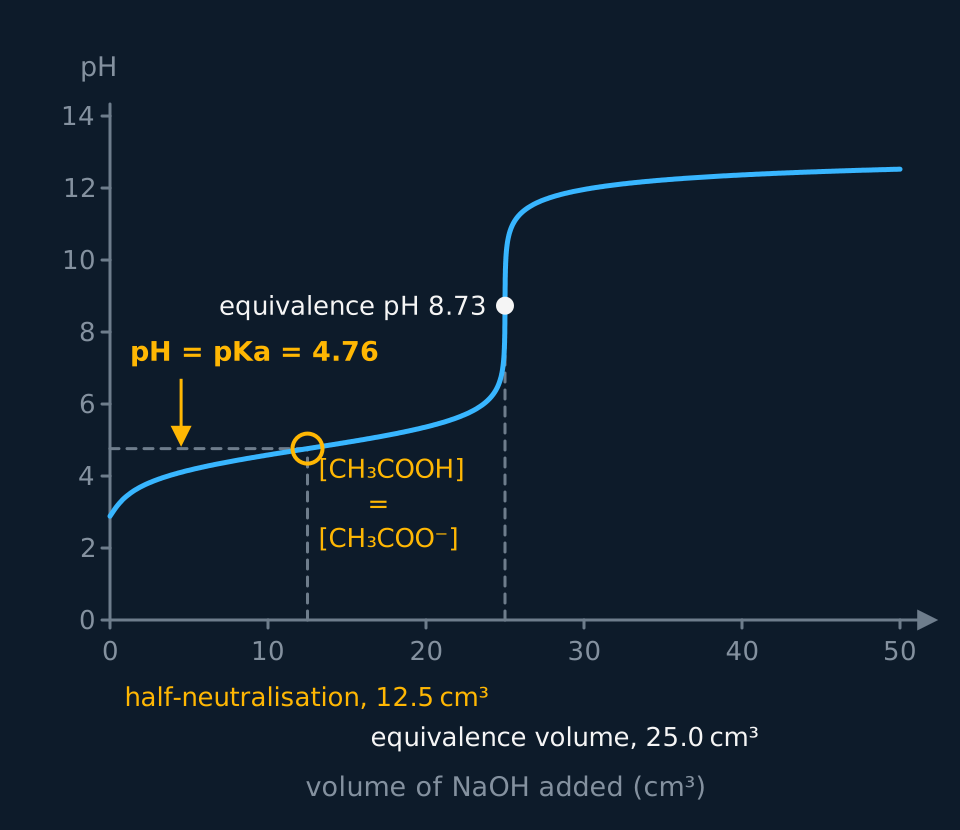
The weak acid–strong base curve has a second landmark. Before equivalence, every OH⁻ added turns one CH₃COOH into one CH₃COO⁻. At 12.5 cm³ exactly half the acid has reacted, so the solution holds equal amounts of CH₃COOH and CH₃COO⁻. Put [HA] = [A⁻] into the Ka expression and they cancel. Edexcel sets this measurement as core practical 9; any board can set it as a question on a curve.
Ka = [H⁺][A⁻] / [HA] = [H⁺], so pH = pKaTrue at the half-neutralisation point only.
On the curve, the half-neutralisation point is at half the equivalence volume, in the gently sloping region before the vertical section, and the pH there, 4.76, is the pKa of ethanoic acid. This is the standard way to measure Ka: titrate, find the equivalence volume from the middle of the vertical section, halve it, and read the pH at that volume.
Describe the drawing
The pH curve for 25.0 cm³ of 0.100 mol dm⁻³ ethanoic acid titrated with 0.100 mol dm⁻³ sodium hydroxide. A dashed vertical at 25.0 cm³ rises to the middle of the steep section, where the equivalence point is marked at pH 8.73. A dashed vertical at half that volume, 12.5 cm³, meets the curve at a circled point, and a dashed horizontal runs from there to the pH axis at 4.76, labelled pH equals pKa; at that point the concentrations of ethanoic acid and ethanoate are equal.
The curve is flattest around half-neutralisation for a reason. The solution there is a weak acid mixed with its conjugate base in equal amounts, which is a buffer at its most effective.
- Half-neutralisation point
- The point in the titration of a weak acid at which half the acid has been neutralised, so [HA] = [A⁻] and pH = pKa.
Equivalence volume and the half-neutralisation pH
25.0 cm³ of 0.0800 mol dm⁻³ propanoic acid is titrated with 0.120 mol dm⁻³ sodium hydroxide. Calculate the volume of alkali needed to reach equivalence, and the pH at the half-neutralisation point. For propanoic acid, Ka = 1.35 × 10⁻⁵ mol dm⁻³.
Show the working
Moles of acid = 0.0800 × 25.0 ÷ 1000 = 2.00 × 10⁻³ mol. CH₃CH₂COOH(aq) + NaOH(aq) → CH₃CH₂COONa(aq) + H₂O(l) is 1 : 1, so 2.00 × 10⁻³ mol of NaOH is needed.
Volume = 2.00 × 10⁻³ ÷ 0.120 = 0.0167 dm³ = 16.7 cm³.
Half-neutralisation is at 16.7 ÷ 2 = 8.33 cm³, where [CH₃CH₂COOH] = [CH₃CH₂COO⁻], so pH = pKa = −log(1.35 × 10⁻⁵) = 4.87.
A more concentrated alkali would shorten both volumes but leave the pH at half-neutralisation at 4.87: it depends only on Ka.
Identifying an acid from its curve
A student titrates 25.0 cm³ of a weak monoprotic acid with 0.150 mol dm⁻³ sodium hydroxide. The vertical section is centred on 20.0 cm³, and the pH at 10.0 cm³ is 3.75. Calculate the concentration of the acid and its Ka, and predict the pH before any alkali was added.
Show the working
Moles of NaOH at equivalence = 0.150 × 20.0 ÷ 1000 = 3.00 × 10⁻³ mol, which equals the moles of acid in a 1 : 1 reaction.
[HA] = 3.00 × 10⁻³ ÷ 0.0250 = 0.120 mol dm⁻³.
10.0 cm³ is half the equivalence volume, so pH = pKa = 3.75 and Ka = 10^(−3.75) = 1.78 × 10⁻⁴ mol dm⁻³. The table of pKa values identifies the acid as methanoic acid.
Before any alkali, [H⁺] = √(Ka × [HA]) = √(1.78 × 10⁻⁴ × 0.120) = 4.62 × 10⁻³ mol dm⁻³, so the starting pH is 2.34.
The acid is 4.62 × 10⁻³ ÷ 0.120 = 3.9% dissociated at the start, inside the range where the approximation holds.
Choosing an indicator
An indicator is itself a weak acid, HIn, whose undissociated form and conjugate base are different colours. Methyl orange is red as HIn and yellow as In⁻.
HIn(aq) ⇌ H⁺(aq) + In⁻(aq)For methyl orange, red on the left and yellow on the right.
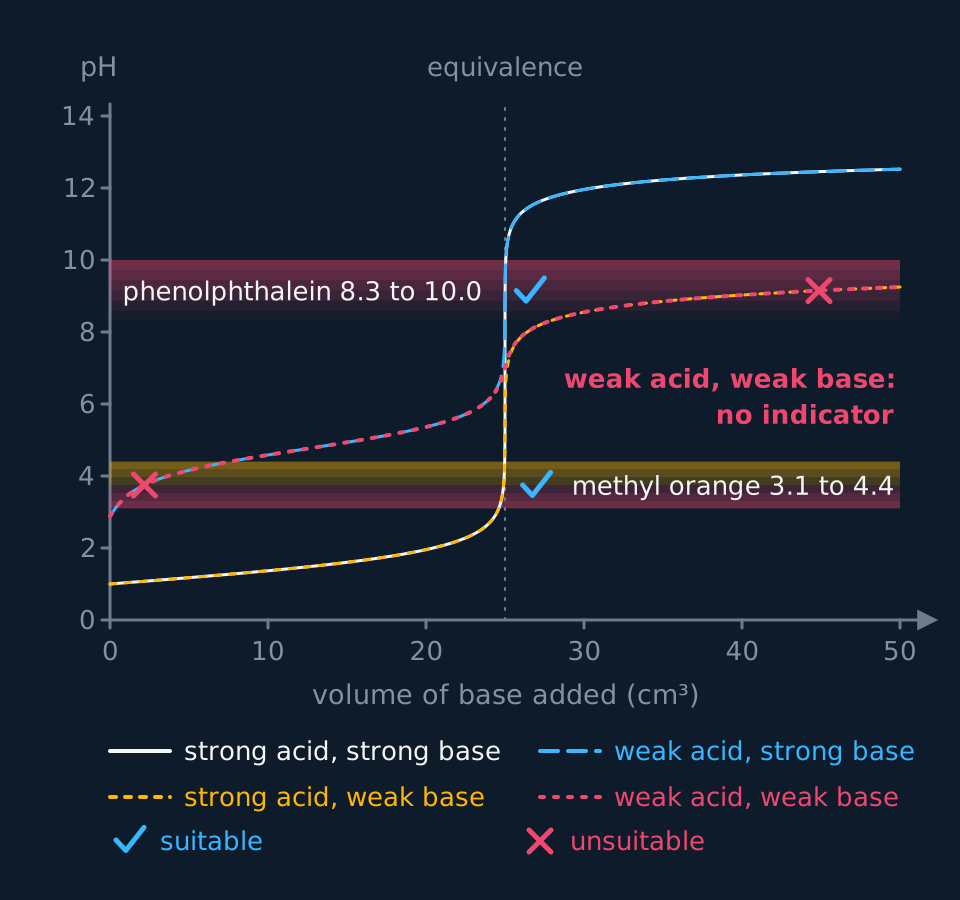
In acid, the high [H⁺] holds the equilibrium to the left and the red form dominates. As alkali removes H⁺, the position of equilibrium shifts right and the colour turns. The eye sees the change over roughly two pH units centred on the indicator's own pKa: for methyl orange from 3.1 to 4.4, for phenolphthalein from 8.3 to 10.0. The colour change is the end point. An indicator is suitable when its whole range lies within the vertical section, so that a single drop takes the solution through the change and the end point coincides with equivalence.
The range is set by the indicator's own dissociation constant, KIn, written like any Ka.
KIn = [H⁺][In⁻] / [HIn], and pKIn = −log KIn
Rearranged, [In⁻]/[HIn] = KIn ÷ [H⁺], so the ratio of the two colours changes tenfold for each unit of pH. Where pH = pKIn the two forms are equal and the intermediate colour shows, orange for methyl orange. The eye sees only the acid colour once [HIn] is about ten times [In⁻], and only the alkali colour once [In⁻] is ten times [HIn], so the range runs roughly from pKIn − 1 to pKIn + 1. Methyl orange has pKIn 3.7 and phenolphthalein 9.3, close to the middles of their ranges in the table.
| Indicator | Colour in acid | Colour in alkali | pH range | Suits |
|---|---|---|---|---|
| Methyl orange | Red | Yellow | 3.1 to 4.4 | Strong acid with strong base; strong acid with weak base |
| Bromothymol blue | Yellow | Blue | 6.0 to 7.6 | Strong acid with strong base |
| Phenolphthalein | Colourless | Pink | 8.3 to 10.0 | Strong acid with strong base; weak acid with strong base |
Describe the drawing
The four pH curves for strong and weak acids with strong and weak bases drawn thinly, with two shaded bands across the full width: methyl orange from pH 3.1 to 4.4 and phenolphthalein from 8.3 to 10.0. Ticks mark methyl orange crossing the vertical sections of both strong acid curves, and phenolphthalein crossing the vertical sections of both strong base curves. Crosses mark methyl orange on the gentle early part of the weak acid curve and phenolphthalein on the gentle late part of the weak base curve. The weak acid, weak base curve has no indicator.
Read the choice from the vertical section. For a weak acid with a strong base the steep part runs from about 7 to 10.5. Phenolphthalein fits inside it; methyl orange would change at pH 3 to 4, while the curve is still in its gentle rise, many cubic centimetres before equivalence. For a strong acid with a weak base the steep part runs from about 3.5 to 7, so methyl orange works, and phenolphthalein would not turn pink until several cubic centimetres after equivalence. A strong acid with a strong base has a vertical section tall enough for either.
For a weak acid with a weak base, no indicator works. There is no vertical section, so whatever an indicator's range, its colour changes gradually over several cubic centimetres and no single drop marks the end. A pH meter is used instead, and the equivalence volume is read from the point where the curve is steepest.
Only two or three drops of indicator are used. The indicator is itself an acid, and a large amount of it would react with some of the alkali and shift the end point.
- Indicator
- A weak acid whose undissociated form and conjugate base have different colours, used to show the end point of a titration.
- End point
- The point in a titration at which the indicator changes colour; with a suitable indicator it coincides with the equivalence point.
- pKIn
- The negative logarithm of an indicator's dissociation constant; the pH at which [HIn] = [In⁻] and the colour change is half complete.
TRY IT: An indicator for ammonia and hydrochloric acid
25.0 cm³ of 0.100 mol dm⁻³ ammonia is titrated with 0.100 mol dm⁻³ hydrochloric acid from the burette. The pH falls from 11.1 to 8.7 over the first 20 cm³, drops from 6.9 to 3.7 between 24.90 and 25.10 cm³, then levels near 1.5. Choose between methyl orange (3.1 to 4.4) and phenolphthalein (8.3 to 10.0), and give the colour change at the end point.
Check your answer
The steep section runs from about 6.9 down to 3.7, so the indicator's range must lie between those values.
Methyl orange, 3.1 to 4.4, lies inside it. Phenolphthalein would fade gradually from about 4 cm³ onwards and lose the last of its pink at pH 8.3, after about 22.5 cm³, while the pH was still falling gently and 2.5 cm³ short of equivalence.
Methyl orange is yellow in the ammonia and turns orange at the end point, then red with excess acid. Running the acid into the base reverses the direction of the colour change, not the choice of indicator.
Required practical 9: measuring pH curves
Required practical 9 asks for two curves: a weak acid titrated with a strong base, and a strong acid titrated with a weak base. OCR assesses pH measurement in PAG 11, and Edexcel's core practical 9 finds Ka for a weak acid by the half-neutralisation method. In each, the pH is measured after every addition of base, the curve is plotted, and the equivalence volume and pKa are read from it.
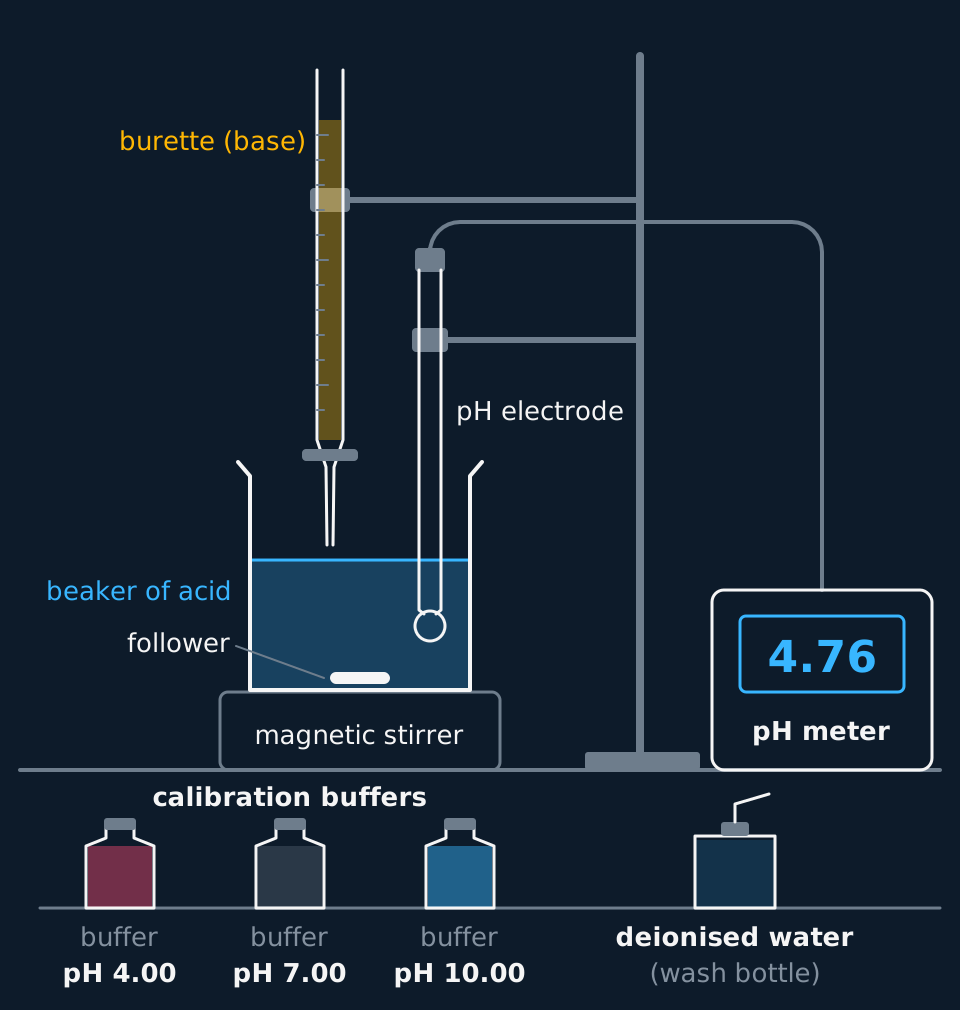
Apparatus: a pH meter and its glass electrode; buffer solutions of pH 4.00, 7.00 and 10.00; a 25.0 cm³ pipette and filler; a 50 cm³ burette; a 250 cm³ beaker; a magnetic stirrer and follower; a wash bottle of deionised water. Typical solutions are 0.100 mol dm⁻³ ethanoic acid with 0.100 mol dm⁻³ sodium hydroxide, and 0.100 mol dm⁻³ hydrochloric acid with 0.100 mol dm⁻³ ammonia.
| Step | What to do | Why |
|---|---|---|
| 1 | Rinse the electrode with deionised water and stand it in pH 7.00 buffer; set the meter to read 7.00. Rinse, stand it in pH 4.00 buffer and set the second point. Use pH 10.00 buffer as a third point if the meter allows | Two known values correct both the zero and the slope of the meter's response |
| 2 | Rinse the burette with the base, fill it, and record the initial reading at eye level to the nearest 0.05 cm³ | Water left in the burette would dilute the base |
| 3 | Pipette 25.0 cm³ of the acid into the beaker, add the follower, and clamp the electrode so its bulb is covered but clear of the follower | The bulb must be fully wet, and a spinning follower can crack it |
| 4 | Record the pH before any base is added | This is the first point of the curve, and a check on Ka |
| 5 | Add the base 2.00 cm³ at a time with stirring, recording the burette reading and the pH once the reading is steady | The pH changes slowly here, so large steps lose nothing |
| 6 | When the pH starts to rise faster, change to 0.50 cm³ additions, then to 0.10 cm³ or single drops through the steep part | The vertical section needs enough points to place its middle |
| 7 | Past the vertical section, return to 2.00 cm³ additions until about twice the equivalence volume has been added | This fixes the shape after equivalence and the final pH |
| 8 | Rinse the electrode, then repeat with the strong acid and weak base | Carry-over would change the next solution's pH |
| 9 | Plot pH against volume of base and draw a smooth curve through the points | The equivalence volume is the middle of the vertical section; pKa is the pH at half that volume |
What is measured: the volume of base added, from the burette, and the pH, from the meter. What is found from them: the equivalence volume; for the weak acid, pKa from the pH at half that volume and then Ka; and the concentration of the acid, if the base's concentration is known.
- Calibration
- Adjusting a pH meter against buffer solutions of known pH, so that its readings are accurate.
Describe the drawing
A burette of base held in a clamp above a beaker of acid on a magnetic stirrer, its tip just above the liquid surface, with a follower lying on the beaker floor. A pH electrode on a separate clamp dips into the beaker to one side, its glass bulb fully under the liquid and clear of the follower, and its lead runs to a pH meter reading 4.76. Along the front stand three calibration buffer bottles, pH 4.00, 7.00 and 10.00, and a wash bottle of deionised water.
| Error | Effect | How to reduce it |
|---|---|---|
| Meter not calibrated, or calibrated at another temperature | Every pH is off by a systematic amount, so pKa is wrong although the equivalence volume is right | Calibrate with two buffers at the temperature of the titration, just before use |
| Reading taken before it has settled | The pH lags behind the additions, most of all in the steep part | Stir, and wait until the reading is steady |
| Additions too large near equivalence | Too few points on the vertical section to place its middle | Drop-by-drop additions through the steep part |
| Burette reading uncertainty | ±0.05 cm³ per reading, so ±0.10 cm³ on a volume delivered: 0.5% of 20 cm³ | Use volumes large enough that this is small |
| Temperature rise during the titration | Neutralisation is exothermic, and Kw and Ka both change with temperature | Use dilute solutions and record the temperature |
The calibration matters more than the volume reading. Near half-neutralisation the curve is at its flattest, rising only about 0.07 pH units per cm³, so misplacing the equivalence volume by a few tenths of a cubic centimetre changes pKa by less than 0.03. A meter that reads 0.10 high makes every pKa 0.10 high.
Risk assessment: sodium hydroxide at 0.100 mol dm⁻³ irritates the eyes, and ammonia solution gives off an irritating vapour. Wear eye protection and use a pipette filler. Check the CLEAPSS Hazcard for each substance and your school's risk assessment before starting.
In the exam
- A sketched pH curve is marked on its landmarks: the start pH, the vertical section centred on the equivalence volume, the equivalence pH and the final pH. The scheme does not credit a vertical section in the wrong place, even when the shape is right.
- Justify an indicator by comparing its range with the vertical section: 'the range of phenolphthalein, 8.3 to 10.0, lies within the vertical section'. 'It changes colour at the end point' restates the question and the scheme does not credit it.
- Explain an equivalence pH through the salt formed: ethanoate ions accept protons from water, giving OH⁻; ammonium ions donate protons to water, giving H₃O⁺.
- At half-neutralisation [HA] = [A⁻], so Ka = [H⁺] and pH = pKa. Show the cancellation, not only the result.
- For required practical 9, the calibration point needs two buffers of known pH named; 'calibrate the meter' with no buffers is not enough for the mark.
Check yourself
A student titrates 25.0 cm³ of 0.100 mol dm⁻³ ethanoic acid with 0.100 mol dm⁻³ ammonia using bromothymol blue (range 6.0 to 7.6), and gets titres of 23.6, 26.1 and 24.8 cm³. Explain the spread, and suggest how the titration should be done instead.
Answer
Ethanoic acid and ammonia are both weak, so the pH curve has no vertical section: the pH rises gradually through equivalence, from about 6.1 at 24 cm³ to about 7.9 at 26 cm³.
Bromothymol blue's range sits on that gentle slope, so its colour drifts from yellow through green to blue over about two cubic centimetres. Each titre stops at a different shade, judged by eye, which is why they spread either side of 25 cm³. A different indicator would do no better, because no colour change can be sharp on a curve with no steep section.
Use a pH meter, or a conductivity meter, adding the ammonia in small portions, and take the equivalence volume from the point of greatest gradient. The expected value is 25.0 cm³.
Questions
Question 16 marks
Describe how the pH curve for the titration of 25.0 cm³ of ethanoic acid with sodium hydroxide is measured in the laboratory, and how the pKa of ethanoic acid is found from it.
Mark scheme
Indicative content
- calibrate the pH meter with buffer solutions of known pH, such as pH 7.00 and pH 4.00, rinsing the electrode with deionised water between them
- pipette 25.0 cm³ of the acid into a beaker, stir, and record the initial pH with the electrode bulb fully immersed
- add sodium hydroxide from a burette in measured portions, recording the volume and the steady pH after each
- use smaller additions, 0.10 cm³ or dropwise, near the equivalence point, and continue past it to about twice the equivalence volume
- plot pH against volume added and read the equivalence volume from the middle of the vertical section
- read the pH at half the equivalence volume, which equals the pKa of ethanoic acid
Levels
- Level 3 (5–6 marks) all stages of the practical are described in a workable order, from calibrating the meter through the small additions near equivalence and continuing past it, the equivalence volume is read from the vertical section, and the pKa is read as the pH at half the equivalence volume
- Level 2 (3–4 marks) a pH meter and burette are used, the pH is recorded after each addition and the curve plotted, and the pKa is read at half equivalence; what is lost is the calibration, the smaller additions near the end point, or the readings beyond equivalence
- Level 1 (1–2 marks) sodium hydroxide is added and the pH noted; an indicator is often used in place of the meter, or the pKa is read at the equivalence point instead of half-way to it
Question 25 marks
Deduce the equivalence volume, the pKa and the Ka of a weak monoprotic acid from the pH curve, recorded as 0.100 mol dm⁻³ sodium hydroxide was added to 25.0 cm³ of the acid. Identify the acid from its Ka in the table, and calculate its concentration.
| Acid | Ka / mol dm⁻³ |
|---|---|
| Methanoic acid | 1.78 × 10⁻⁴ |
| Benzoic acid | 6.31 × 10⁻⁵ |
| Ethanoic acid | 1.74 × 10⁻⁵ |
Mark scheme
- B1 the vertical section, from about pH 6 to 10.5, is centred on 20.0 cm³, so the equivalence volume is 20.0 cm³
- B1 half-neutralisation is at 10.0 cm³, where the curve reads pH = pKa = 3.75, so Ka = 10^(−3.75) = 1.78 × 10⁻⁴ mol dm⁻³; accept a pKa read as 3.7 to 3.8
- B1 the Ka matches methanoic acid; allow error carried forward from a misread pKa
- M1 moles of acid = moles of NaOH at equivalence = 0.100 × 0.0200 = 2.00 × 10⁻³ mol, in 0.0250 dm³
- A1 concentration of the acid = 0.0800 mol dm⁻³
Question 34 marks
Explain why the pH at the equivalence point is 7.00 when hydrochloric acid is titrated with sodium hydroxide, but below 7 when hydrochloric acid is titrated with ammonia.
Mark scheme
- B1 at equivalence the first solution holds sodium chloride, and neither Na⁺ nor Cl⁻ reacts with water
- B1 so [H⁺] = [OH⁻] and the pH at equivalence is 7.00
- B1 with ammonia the salt is ammonium chloride, and NH₄⁺ is a weak acid that donates protons to water
- B1 NH₄⁺(aq) + H₂O(l) ⇌ NH₃(aq) + H₃O⁺(aq) makes the solution acidic, about pH 5.3; an answer naming Cl⁻ as the cause is rejected
All 20 questions with mark schemes, the other 17 set out in full on the question page.
Worth remembering
- Putting every equivalence point at pH 7 ignores the salt formed.
- Level a curve for an added weak base off near pH 11; pH 12.5 is where a strong base ends.
- Read pKa at half the equivalence volume, where [HA] = [A⁻], not at the equivalence volume itself.
- An indicator whose range only touches the vertical section changes colour before or after equivalence.
- Naming an indicator for a weak acid–weak base titration is wrong: none gives a sharp end point.
CHECK YOUR PROGRESS
Rate how confident you are with each objective for this lesson. Ratings are saved in this browser, on this device, unless you sign in.
- Sketch the pH curves for the four combinations of strong and weak acid and base, with the start pH, vertical section and equivalence pH of each.
- Explain why the pH at equivalence is above 7 for a weak acid with a strong base and below 7 for a strong acid with a weak base.
- Show that pH = pKa at the half-neutralisation point, and use it to find Ka from a pH curve.
- Choose an indicator whose range lies on the vertical section, and explain why none suits a weak acid–weak base titration.
- Carry out and evaluate the pH-curve practical, including the calibration of a pH meter.
Open the full revision checklist to see every objective in the curriculum in one place.
Practise this lesson
WORKBOOK
The written questions from this topic, on paper with room to work, and a separate book of mark schemes. The 6 questions that are set on a diagram stay on this page, where the diagram can be drawn. Free to use; please do not redistribute or sell.