Chemistry › Practicals › Measuring pH curves
Required practical 9: measuring pH curves (OCR PAG 11, Edexcel CP 9)
Calibrate a pH meter, follow a titration with it, plot the pH curve, and read the equivalence volume and the pKa from it.
This is the method section of Titration curves and choosing an indicator on a page of its own, with its variables, sample results, an evaluation and questions set on it. The chemistry behind it is in that lesson.
The capability this develops
This investigation is one instance of capability P08: Measuring pH and pH curves, which sets out the techniques it belongs to, the calculations it carries and the errors that cost marks in all of them. The notes behind the chemistry are in Acids and bases.
Where this sits on the specifications
Each qualification is mapped to its own specification one numbered heading at a time, against a document whose sha256 is recorded. These are the headings that list the lesson this method is taught in, on the four qualifications mapped. Each links to the route map the row belongs to.
| Qualification | Heading |
|---|---|
| AQA 7404/7405 | 3.1.12.5 pH curves, titrations and indicators |
| OCR Chemistry A H032/H432 | 5.1.3 Acids, bases and buffers |
| Pearson Edexcel Chemistry 8CH0/9CH0 | 12.14 pH data: salts and dilution |
| Pearson Edexcel Chemistry 8CH0/9CH0 | 12.16 titration curves |
| Pearson Edexcel Chemistry 8CH0/9CH0 | 12.17 choosing an indicator |
| Pearson Edexcel Chemistry 8CH0/9CH0 | 12.22 buffer region and Ka at half-neutralisation |
| Cambridge International 9701 | 7.2 Brønsted–Lowry theory of acids and bases |
| Cambridge International 9701 | 25.1 Acids and bases |
Three boards number their practical activities, and those lists were read here from the same specifications as the headings above. This investigation is filed on them as:
- AQA 7404/7405 required practical 9: pH change in weak–strong acid–base reactions
- OCR Chemistry A H032/H432 PAG 11: pH measurement
- Pearson Edexcel Chemistry 8CH0/9CH0 core practical 9: Ka of a weak acid
Use your awarding organisation’s current specification and its practical handbook as the authority on which activities your course requires and how they are assessed.
Apparatus
A pH meter and its glass electrode; buffer solutions of pH 4.00, 7.00 and 10.00; a 25.0 cm³ pipette and filler; a 50 cm³ burette; a 250 cm³ beaker; a magnetic stirrer and follower; a wash bottle of deionised water. Typical solutions are 0.100 mol dm⁻³ ethanoic acid with 0.100 mol dm⁻³ sodium hydroxide, and 0.100 mol dm⁻³ hydrochloric acid with 0.100 mol dm⁻³ ammonia.
Safety
Sodium hydroxide at 0.100 mol dm⁻³ irritates the eyes, and ammonia solution gives off an irritating vapour. Wear eye protection and use a pipette filler. Check the CLEAPSS Hazcard for each substance and your school's risk assessment before starting.
Variables
Independent variable
The volume of base added from the burette, in steps that shrink from 2.00 cm³ to single drops through the steep part.
Dependent variable
The pH of the solution in the beaker, read from the meter once it has settled after each addition.
Control variables
- The acid: 25.0 cm³ by pipette, at 0.100 mol dm⁻³, so the equivalence volume is the same for every repeat.
- The concentration of the base, which with the volume of acid fixes where the vertical section falls.
- The temperature, because the calibration, Ka and Kw all change with it; the buffers are used at the temperature of the titration.
- The meter, calibrated with the same two buffers just before use, and the electrode rinsed between titrations, with stirring and a wait for a steady reading at every point.
A pH curve is one titration followed from start to finish, so the reading is taken many times rather than once at an end point. The control that matters most is the calibration: an error in the meter shifts every point up or down the pH axis, and pKa is read straight off that axis.
Method
| Step | What to do | Why |
|---|---|---|
| 1 | Rinse the electrode with deionised water and stand it in pH 7.00 buffer; set the meter to read 7.00. Rinse, stand it in pH 4.00 buffer and set the second point. Use pH 10.00 buffer as a third point if the meter allows | Two known values correct both the zero and the slope of the meter's response |
| 2 | Rinse the burette with the base, fill it, and record the initial reading at eye level to the nearest 0.05 cm³ | Water left in the burette would dilute the base |
| 3 | Pipette 25.0 cm³ of the acid into the beaker, add the follower, and clamp the electrode so its bulb is covered but clear of the follower | The bulb must be fully wet, and a spinning follower can crack it |
| 4 | Record the pH before any base is added | This is the first point of the curve, and a check on Ka |
| 5 | Add the base 2.00 cm³ at a time with stirring, recording the burette reading and the pH once the reading is steady | The pH changes slowly here, so large steps lose nothing |
| 6 | When the pH starts to rise faster, change to 0.50 cm³ additions, then to 0.10 cm³ or single drops through the steep part | The vertical section needs enough points to place its middle |
| 7 | Past the vertical section, return to 2.00 cm³ additions until about twice the equivalence volume has been added | This fixes the shape after equivalence and the final pH |
| 8 | Rinse the electrode, then repeat with the strong acid and weak base | Carry-over would change the next solution's pH |
| 9 | Plot pH against volume of base and draw a smooth curve through the points | The equivalence volume is the middle of the vertical section; pKa is the pH at half that volume |
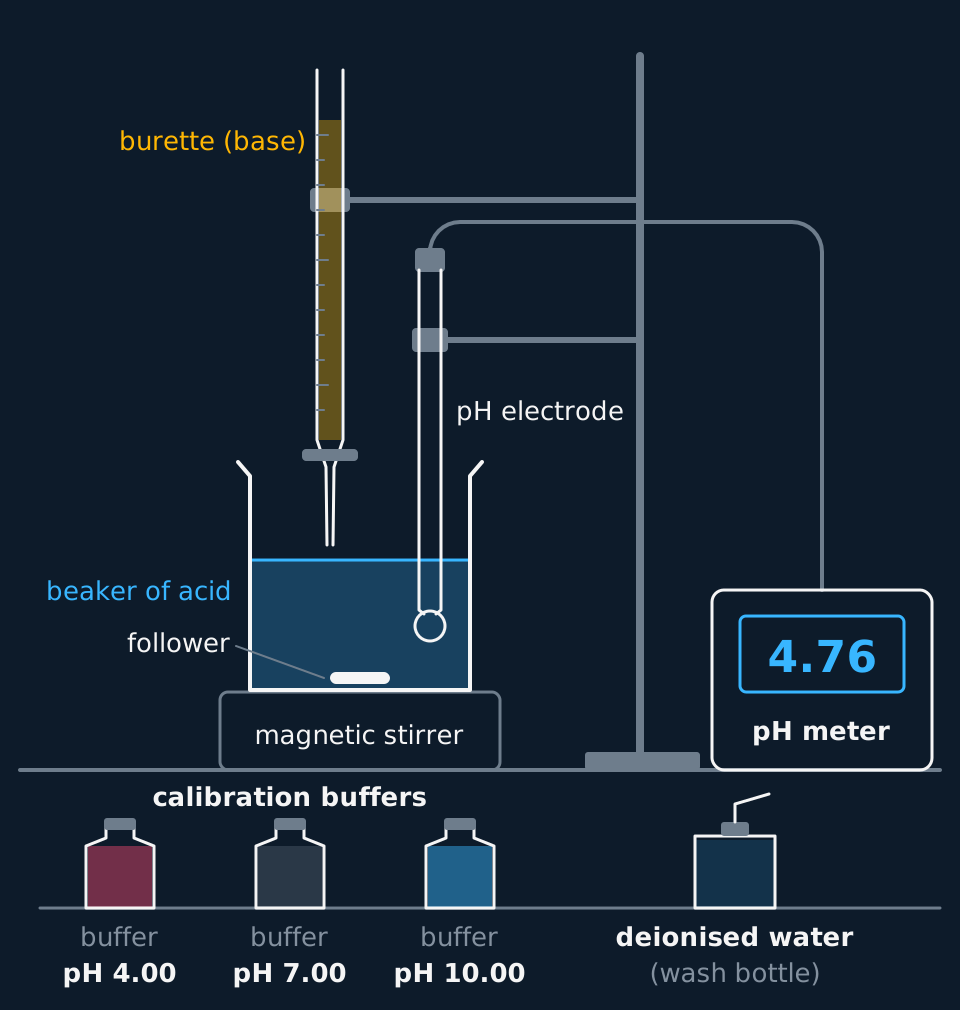
Describe the drawing
A burette of base held in a clamp above a beaker of acid on a magnetic stirrer, its tip just above the liquid surface, with a follower lying on the beaker floor. A pH electrode on a separate clamp dips into the beaker to one side, its glass bulb fully under the liquid and clear of the follower, and its lead runs to a pH meter reading 4.76. Along the front stand three calibration buffer bottles, pH 4.00, 7.00 and 10.00, and a wash bottle of deionised water.
What is measured
The volume of base added, from the burette, and the pH, from the meter. What is found from them: the equivalence volume; for the weak acid, pKa from the pH at half that volume and then Ka; and the concentration of the acid, if the base's concentration is known.
- Calibration
- Adjusting a pH meter against buffer solutions of known pH, so that its readings are accurate.
Sample results
These readings are idealised: they are the landmarks the lesson gives for 25.0 cm³ of 0.100 mol dm⁻³ hydrochloric acid titrated with 0.100 mol dm⁻³ sodium hydroxide, and the half-neutralisation reading for ethanoic acid.
| Volume of sodium hydroxide added / cm³ | pH |
|---|---|
| 0 | 1.00 |
| 20 | 1.95 |
| 24.90 | 3.70 |
| 25.10 | 10.30 |
| 50.0 | 12.52 |
A pH curve records how the pH of an acid changes as a base is added. For 25.0 cm³ of 0.100 mol dm⁻³ hydrochloric acid with 0.100 mol dm⁻³ sodium hydroxide run in from a burette, the reading barely moves over the first 20 cm³, from 1.00 to 1.95. Between 24.90 and 25.10 cm³, about four drops, it jumps from 3.70 to 10.30. After that it creeps again, reaching 12.52 at 50.0 cm³. A plot of pH against volume added is a pH curve, also called a titration curve.
On the curve, the half-neutralisation point is at half the equivalence volume, in the gently sloping region before the vertical section, and the pH there, 4.76, is the pKa of ethanoic acid. This is the standard way to measure Ka: titrate, find the equivalence volume from the middle of the vertical section, halve it, and read the pH at that volume.
Evaluation
The limitations of the method, what each does to the result and in which direction, and the improvement a mark scheme credits.
| Limitation | What it does to the result | Improvement |
|---|---|---|
| The glass electrode is slow and least reliable at high pH | Through the vertical section the reading lags the additions, and above about pH 12 the electrode responds to sodium ions as well as hydrogen ions, so the readings after equivalence come out low | Wait for a steady reading at every point, and take pKa from the buffer region before equivalence, where the electrode is at its best |
| The equivalence point is not measured: it is located | In the sample results four drops take the pH from 3.70 to 10.30, so the middle of the vertical section is read from a curve drawn through two points that straddle it | Plot the change in pH per cm³ added against volume: the peak of that graph is the equivalence volume, found to the nearest drop rather than by eye on a near-vertical line |
| pKa is read from a single point | The pH at half the equivalence volume is one reading, and a meter 0.10 high makes it 0.10 high; a misplaced equivalence volume moves the half-way point as well | Use several points in the buffer region: pH = pKa + log([A⁻] ÷ [HA]) at each volume gives an estimate of pKa, and their mean is less dependent on any one reading |
| Ammonia solution loses ammonia to the air | The concentration of the base in the burette falls while it stands open, so the equivalence volume of the strong acid and weak base titration drifts upwards through a session | Use freshly made ammonia solution, keep the burette covered, and standardise it by titration against the acid before the curve is run |
Errors in carrying it out
| Error | Effect | How to reduce it |
|---|---|---|
| Meter not calibrated, or calibrated at another temperature | Every pH is off by a systematic amount, so pKa is wrong although the equivalence volume is right | Calibrate with two buffers at the temperature of the titration, just before use |
| Reading taken before it has settled | The pH lags behind the additions, most of all in the steep part | Stir, and wait until the reading is steady |
| Additions too large near equivalence | Too few points on the vertical section to place its middle | Drop-by-drop additions through the steep part |
| Burette reading uncertainty | ±0.05 cm³ per reading, so ±0.10 cm³ on a volume delivered: 0.5% of 20 cm³ | Use volumes large enough that this is small |
| Temperature rise during the titration | Neutralisation is exothermic, and Kw and Ka both change with temperature | Use dilute solutions and record the temperature |
The calibration matters more than the volume reading. Near half-neutralisation the curve is at its flattest, rising only about 0.07 pH units per cm³, so misplacing the equivalence volume by a few tenths of a cubic centimetre changes pKa by less than 0.03. A meter that reads 0.10 high makes every pKa 0.10 high.
Questions
Question 1 (6 marks)
Describe how the pH curve for the titration of 25.0 cm³ of ethanoic acid with sodium hydroxide is measured in the laboratory, and how the pKa of ethanoic acid is found from it.
Mark scheme
Indicative content
- calibrate the pH meter with buffer solutions of known pH, such as pH 7.00 and pH 4.00, rinsing the electrode with deionised water between them
- pipette 25.0 cm³ of the acid into a beaker, stir, and record the initial pH with the electrode bulb fully immersed
- add sodium hydroxide from a burette in measured portions, recording the volume and the steady pH after each
- use smaller additions, 0.10 cm³ or dropwise, near the equivalence point, and continue past it to about twice the equivalence volume
- plot pH against volume added and read the equivalence volume from the middle of the vertical section
- read the pH at half the equivalence volume, which equals the pKa of ethanoic acid
Levels
- Level 3 (5–6 marks) all stages of the practical are described in a workable order, from calibrating the meter through the small additions near equivalence and continuing past it, the equivalence volume is read from the vertical section, and the pKa is read as the pH at half the equivalence volume
- Level 2 (3–4 marks) a pH meter and burette are used, the pH is recorded after each addition and the curve plotted, and the pKa is read at half equivalence; what is lost is the calibration, the smaller additions near the end point, or the readings beyond equivalence
- Level 1 (1–2 marks) sodium hydroxide is added and the pH noted; an indicator is often used in place of the meter, or the pKa is read at the equivalence point instead of half-way to it
Question 2 (2 marks)
Suggest why, in the pH-curve practical, the base is added in 2.00 cm³ portions at first but in single drops close to the equivalence point.
Mark scheme
- B1 away from equivalence the pH changes slowly, so large additions still give enough points to fix the curve
- B1 near equivalence one drop can change the pH by several units, so small additions are needed to put enough points on the vertical section to locate its middle
Question 3 (3 marks)
Suggest the most likely cause of this error, and how it should be put right: a student finds the pKa of benzoic acid by the half-neutralisation method and gets 4.42, against a data book value of 4.20, although the equivalence volume was correct.
Mark scheme
- B1 a correct equivalence volume means the volume measurements were sound, and the error is in the pH readings
- B1 the pH meter was most likely not calibrated, or calibrated incorrectly, giving readings about 0.2 too high throughout
- B1 calibrate the meter with two buffers of known pH at the temperature of the titration immediately before use, and repeat
Question 4 (3 marks)
Explain why the pH at the half-neutralisation point of a weak acid titrated with a strong base is equal to the pKa of the acid.
Mark scheme
- B1 at half-neutralisation half the HA has been converted to A⁻, so [HA] = [A⁻]
- B1 in Ka = [H⁺][A⁻]/[HA] the two concentrations cancel, so Ka = [H⁺]
- B1 taking −log of both sides gives pKa = pH
Question 5 (2 marks)
Explain why the pH meter is calibrated with two buffers rather than one.
Mark scheme
One buffer corrects only the zero of the meter, so a reading at pH 7 would be right and others wrong.
A second buffer sets the slope of the meter's response, so readings are right across the range.
Question 6 (3 marks)
From the sample results, state the equivalence volume and explain how the pH at equivalence can be found although no reading was taken there.
Mark scheme
25.0 cm³, the middle of the vertical section between 24.90 and 25.10 cm³.
A smooth curve is drawn through the points and the mid-point of the near-vertical part is read from it.
For a strong acid with a strong base that is pH 7, because the salt formed, sodium chloride, is neutral.
Question 7 (2 marks)
Explain why each pH is recorded only once the reading is steady, and state where on the curve this matters most.
Mark scheme
The electrode takes time to respond, so a reading taken at once lags behind the base just added.
It matters most in the steep part near equivalence, where one drop changes the pH by several units.
Question 8 (3 marks)
A second weak acid gives a pH of 3.86 at half-neutralisation. Calculate its Ka and give the units.
Mark scheme
pKa = 3.86, so Ka = 10^−3.86.
= 1.38 × 10⁻⁴ (accept 1.4 × 10⁻⁴).
mol dm⁻³.
Question 9 (3 marks)
Calculate the pH of the 0.100 mol dm⁻³ hydrochloric acid before any base is added, and show that it is 1.95 after 20 cm³ of 0.100 mol dm⁻³ sodium hydroxide.
Mark scheme
Before any base, [H⁺] = 0.100 mol dm⁻³, so pH = −log 0.100 = 1.00.
After 20 cm³, the acid left is 0.100 × 5.0 ÷ 1000 = 5.0 × 10⁻⁴ mol, in a total of 45.0 cm³.
[H⁺] = 5.0 × 10⁻⁴ ÷ 0.0450 = 0.0111 mol dm⁻³, so pH = −log 0.0111 = 1.95.
Question 10 (3 marks)
Explain why methyl orange would be a poor indicator for the titration of ethanoic acid with sodium hydroxide, using the shape of the curve.
Mark scheme
For a weak acid with a strong base the vertical section runs from about pH 7 to 11, and equivalence is above 7 because the ethanoate ion is a base.
Methyl orange changes over pH 3.1 to 4.4, which lies in the buffer region before the vertical section.
It would change gradually and well before equivalence, so phenolphthalein, which changes at pH 8.3 to 10, is used instead.
Coverage maps are available for AQA 7404/7405, OCR Chemistry A H032/H432, Pearson Edexcel Chemistry 8CH0/9CH0 and Cambridge International 9701. Use the relevant route map to check what InkChemistry covers, and your awarding organisation’s current specification as the final authority on examinable content.