Chemistry › Practicals › Rate and temperature: thiosulfate and acid
Required practical 3: rate and temperature (OCR PAG 9)
Time how long the cross takes to disappear at five temperatures, and plot 1/t against temperature.
This is the method section of Measuring the rate of a reaction on a page of its own, with its variables, sample results, an evaluation and questions set on it. The chemistry behind it is in that lesson.
The capability this develops
This investigation is one instance of capability P03: Measuring rates and finding orders, which sets out the techniques it belongs to, the calculations it carries and the errors that cost marks in all of them. The notes behind the chemistry are in Kinetics.
Where this sits on the specifications
Each qualification is mapped to its own specification one numbered heading at a time, against a document whose sha256 is recorded. These are the headings that list the lesson this method is taught in, on the four qualifications mapped. Each links to the route map the row belongs to.
| Qualification | Heading |
|---|---|
| AQA 7404/7405 | 3.1.5.3 Effect of temperature on reaction rate |
| OCR Chemistry A H032/H432 | 1.1 Practical skills assessed in a written examination |
| OCR Chemistry A H032/H432 | 3.2.2 Reaction rates |
| Pearson Edexcel Chemistry 8CH0/9CH0 | 9.3 rate from time or a tangent |
| Pearson Edexcel Chemistry 8CH0/9CH0 | 16.3 choosing a rate technique |
| Cambridge International 9701 | 8.1 Rate of reaction |
Three boards number their practical activities, and those lists were read here from the same specifications as the headings above. This investigation is filed on them as:
- AQA 7404/7405 required practical 3: Rate of reaction and temperature
- OCR Chemistry A H032/H432 PAG 9: Rates of reaction – continuous monitoring method
Use your awarding organisation’s current specification and its practical handbook as the authority on which activities your course requires and how they are assessed.
Apparatus
A 250 cm³ conical flask; a 50 cm³ and a 10 cm³ measuring cylinder; a boiling tube; a water bath, either thermostatic or a large beaker of water warmed with a kettle; a thermometer reading to 1 °C; a stopwatch; a sheet of white paper with a bold black cross. Solutions: 0.050 mol dm⁻³ sodium thiosulfate and 1.0 mol dm⁻³ hydrochloric acid.
Safety
Risk assessment. Sulfur dioxide is toxic and irritates the airways: work in a well-ventilated room, pour each mixture away at once, and anyone with asthma takes particular care or works near a fume cupboard. Dilute hydrochloric acid irritates the eyes, so eye protection is worn. Lift hot flasks with care and keep the kettle's cable clear of the water. Check the CLEAPSS Hazcard for each substance and the school's risk assessment before starting; where they differ from this method, follow them.
Variables
Independent variable
The temperature of the mixture, from about 20 to 60 °C in steps of ten degrees, recorded as the mean of the starting and final temperatures because the mixture cools on the bench.
Dependent variable
The time for the cross to disappear, t, converted to 1/t. The same amount of sulfur hides the cross every time, so 1/t is proportional to the average rate over the run.
Control variables
- The volumes and concentrations of both solutions, 50 cm³ of 0.050 mol dm⁻³ thiosulfate and 10 cm³ of 1.0 mol dm⁻³ acid, so every run starts at the same concentrations.
- The depth of liquid over the cross, which the same volumes in the same flask give: the cross disappears once enough sulfur has formed to scatter light through that depth, and a deeper liquid hides it with less sulfur per cm³.
- The cross, the paper, the lighting and the observer, so the end point is the same degree of cloudiness in every run.
- The acid in excess, so the thiosulfate concentration is what sets the rate and the amount of sulfur that forms.
Nothing in this method measures a concentration. The end point is a fixed amount of sulfur, and only if that amount is the same in every run does 1/t compare one temperature with another. Every control is there to keep that amount the same.
Method
| Step | What to do | Why |
|---|---|---|
| 1 | Draw a bold cross on white paper. Use the same paper, flask and lighting for every run | How soon the cross disappears depends on how visible it is |
| 2 | Measure 50 cm³ of sodium thiosulfate solution into the flask and 10 cm³ of hydrochloric acid into the boiling tube | The acid is in excess, and the same volumes give the same depth of liquid over the cross |
| 3 | Stand the flask and the tube in the water bath until both reach the target temperature, checking each with the thermometer | The mixture then starts at the temperature being tested |
| 4 | Stand the flask on the cross, pour in the acid, start the stopwatch as it goes in, and swirl once | Timing starts at mixing |
| 5 | Look down through the liquid and stop the watch when the cross can no longer be seen | The same view in every run gives the same end point |
| 6 | Measure the temperature of the mixture at once, and record the mean of the starting and final temperatures | The mixture cools on the bench, and fastest in the hottest runs |
| 7 | Pour the mixture away with plenty of water straight away | This limits the sulfur dioxide released into the room |
| 8 | Repeat at about 20, 30, 40, 50 and 60 °C, three times at each | Five values show the trend; repeats show the spread |
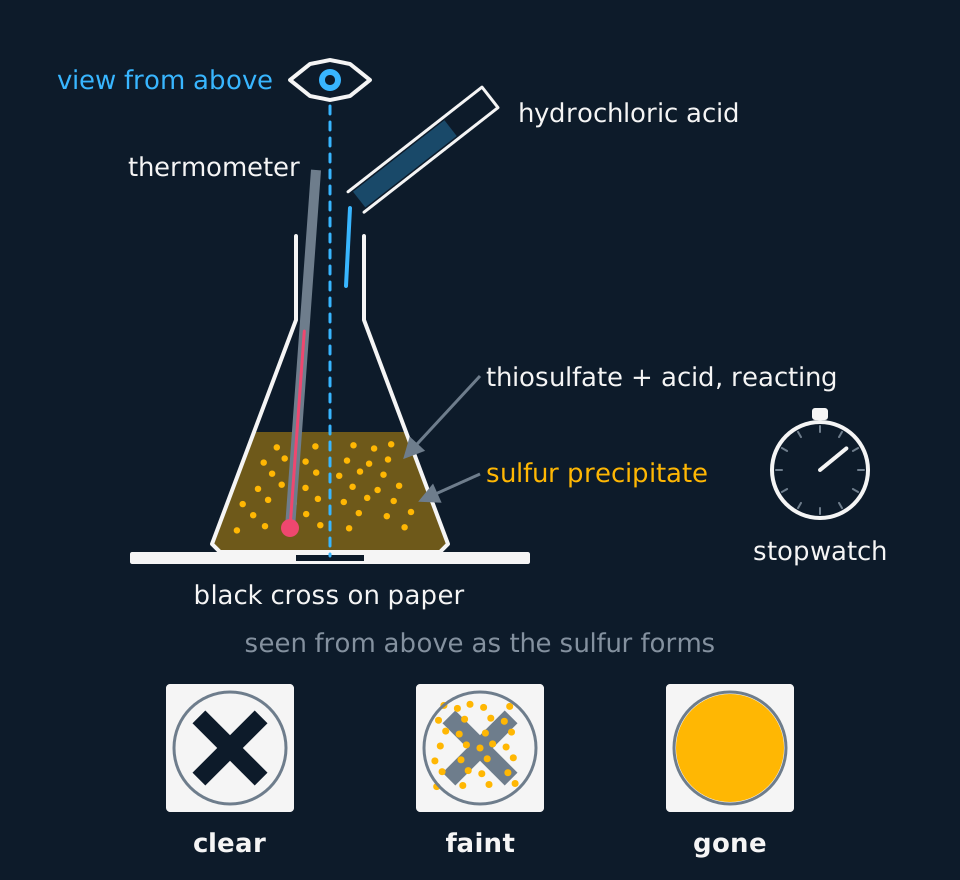
Describe the drawing
A conical flask of pale cloudy yellow liquid stands on a sheet of white paper marked with a bold black cross. An eye directly above the flask looks down a dashed vertical sight line through the neck and the full depth of the liquid to the cross. Hydrochloric acid is being poured in from a tilted boiling tube, a thermometer stands in the flask, and a stopwatch is beside it. Below, three views from above show the cross clear, then faint, then gone as sulfur precipitate builds up.
What is measured
The independent variable is the temperature of the mixture. The dependent variable is the time for the cross to disappear, converted to 1/t. The controls are the volume and concentration of each solution, and so the depth of liquid, the flask, the cross, the lighting and the observer.
Sample results
The results below are idealised; a real class set scatters more.
| Bath temperature / °C | Run 1 / s | Run 2 / s | Run 3 / s | Mean t / s |
|---|---|---|---|---|
| 20 | 126 | 121 | 125 | 124 |
| 30 | 66 | 63 | 65 | 64.7 |
| 40 | 36 | 34 | 35 | 35.0 |
| 50 | 21 | 19 | 20 | 20.0 |
| 60 | 12 | 11 | 13 | 12.0 |
At 20 °C the mean time is (126 + 121 + 125) ÷ 3 = 124 s, so 1/t = 1 ÷ 124 = 0.00806 s⁻¹. The other four are worked the same way: 0.0155, 0.0286, 0.0500 and 0.0833 s⁻¹.
Compare each value with the one ten degrees below: 0.0155 ÷ 0.00806 = 1.92, then 1.85, 1.75 and 1.67. The rate nearly doubles for each 10 °C rise, as the Maxwell–Boltzmann distribution predicts for a reaction with a substantial activation energy.
Evaluation
The limitations of the method, what each does to the result and in which direction, and the improvement a mark scheme credits.
| Limitation | What it does to the result | Improvement |
|---|---|---|
| 1/t is an average rate, not an initial rate | The thiosulfate concentration falls during the run, so the rate measured is the mean over the first part of the reaction; the comparison between temperatures holds because the same fraction of thiosulfate has reacted at the end point every time, but no rate in mol dm⁻³ s⁻¹ comes out of it | For a rate with units, follow the cloudiness with a light sensor and take the gradient of the trace at t = 0, where the concentrations are the ones that were mixed |
| The doubling ratio in the sample results falls from 1.92 to 1.67 | Part of that is what the Arrhenius equation predicts, since a fixed ten-degree step is a smaller change in 1/T at higher temperatures; part is the hottest runs happening below their bath temperature | Plot ln(1/t) against 1/T in kelvin: the points lie on a straight line of gradient −Ea/R, and a run at the wrong temperature shows as a point off the line rather than disappearing into a curve |
| Sulfur from one run is still in the flask for the next | A flask that is already slightly cloudy hides the cross sooner, so the time is too short, and the error grows run by run | Wash the flask thoroughly between runs, or use a fresh flask for each temperature, and check that a flask of water alone shows the cross clearly before the acid goes in |
| The hot runs are the least precise | At 60 °C the repeats span 11 to 13 s, a half-range of ±1 s on 12 s, which is 8%; at 20 °C the half-range of ±2.5 s on 124 s is 2%, so the points that fix the steep end of the graph carry the largest error bars | Take more repeats at the higher temperatures, and draw the line of best fit through the error bars rather than through the means alone |
Errors in carrying it out
Repeats reveal random error: at 60 °C the three times span 11 to 13 s, at 20 °C 121 to 126 s. A systematic error is different. An observer who always stops the watch a moment after the cross has gone makes every time too long, and repeats cannot reveal it. Using one observer throughout keeps that error the same at every temperature, so the trend survives it.
| Error | Effect | Improvement |
|---|---|---|
| The end point is judged by eye | Observers, or one observer on different runs, stop the watch at different degrees of cloudiness | One observer throughout, or a light sensor and data logger under the flask |
| The mixture cools once it leaves the bath | The hot runs happen at a lower temperature than the bath, so points are plotted too far to the right | Record the starting and final temperatures and plot the mean |
| Reaction time when starting and stopping the watch | A fixed error of a few tenths of a second is a larger percentage of the short times | Dilute the thiosulfate in every run so that the fastest run takes a minute or more |
| Acid and thiosulfate at different temperatures when mixed | The mixture starts at a temperature between the two | Leave both in the bath for the same time and check each with the thermometer |
| Measuring cylinders | About ±0.5 cm³ in each volume | Burettes, which read to ±0.05 cm³ |
Questions
Question 1 (6 marks)
Describe how to investigate the effect of temperature on the rate of the reaction between sodium thiosulfate solution and dilute hydrochloric acid.
Mark scheme
Indicative content
- measured volumes of sodium thiosulfate solution, for example 50 cm³, in a conical flask and of hydrochloric acid, for example 10 cm³, in a separate tube
- both are warmed separately in a water bath to the chosen temperature, checked with a thermometer
- the flask stands on paper marked with a cross; the acid is added and a stopwatch started at the moment of mixing
- the watch is stopped when the cross can no longer be seen looking down through the liquid, and the temperature of the mixture is recorded
- the experiment is repeated at about five temperatures, for example 20 to 60 °C, with repeats at each, keeping volumes, concentrations, flask, cross and observer the same
- 1/t is calculated as a measure of rate and plotted against temperature, in a well-ventilated room because sulfur dioxide is given off
Levels
- Level 3 (5–6 marks) the volumes, the separate warming of both solutions, the cross and the timing from mixing to disappearance, the range of temperatures with repeats, the variables kept the same and the processing as 1/t against temperature are all present, with the ventilation precaution
- Level 2 (3–4 marks) the cross method and the timing are described over a range of temperatures; the two solutions are not warmed separately, the controls are not named, or the results are not processed into 1/t
- Level 1 (1–2 marks) the solutions are mixed and timed at different temperatures, with the time itself taken as the rate and no controls or repeats
Question 2 (3 marks)
Explain why, in the thiosulfate practical, both solutions are brought to temperature separately before mixing, and why the temperature of the mixture is measured at the end of each run.
Mark scheme
- B1 if either solution were colder or warmer, the mixture would start at a temperature different from the one being investigated
- B1 the mixture loses heat once it stands on the bench, most quickly in the hottest runs
- B1 recording the starting and final temperatures and using the mean gives the temperature at which the reaction ran
Question 3 (3 marks)
Give three variables that must be controlled when investigating the effect of temperature on the rate of the thiosulfate and acid reaction.
Mark scheme
- B1 the volume and concentration of the sodium thiosulfate solution
- B1 the volume and concentration of the hydrochloric acid
- B1 the depth of liquid over the cross, through using the same flask, the same cross and the same observer
Question 4 (4 marks)
Evaluate a student's conclusion that 'the rate doubles for every 10 °C rise' from the results for the thiosulfate reaction given in the table.
Mark scheme
- B1 the ratios for each 10 °C rise are 1.9, 1.8 and 1.7
- B1 so the rate nearly doubles for each 10 °C rise, which supports the conclusion approximately
- B1 the ratio falls as the temperature rises, so 'doubles' is not exact and the rule does not hold at every temperature
- B1 the results cover only 20 to 50 °C for one reaction, with no repeats shown, so the conclusion holds only for that range and that reaction
Question 5 (2 marks)
Explain why 1/t is plotted against temperature rather than t.
Mark scheme
The same amount of sulfur must form to hide the cross in every run, so the time taken is inversely proportional to the average rate.
1/t is therefore a measure of rate, and a graph of 1/t against temperature rises as the rate rises, which a graph of t does not.
Question 6 (3 marks)
Using the sample results, calculate the percentage uncertainty in the mean time at 60 °C, taking the uncertainty as half the range of the three repeats, and compare it with the value at 20 °C.
Mark scheme
At 60 °C the range is 13 − 11 = 2 s, so the uncertainty is ±1 s and 1 ÷ 12.0 × 100 = 8.3%.
At 20 °C the range is 126 − 121 = 5 s, so ±2.5 s and 2.5 ÷ 124 × 100 = 2.0%.
The hottest run is the least precise because a fixed error in starting and stopping the watch is a larger fraction of a short time.
Question 7 (3 marks)
Explain, in terms of the Maxwell–Boltzmann distribution, why the rate nearly doubles for a rise of 10 °C although the mean kinetic energy of the molecules rises by only about 3%.
Mark scheme
At the higher temperature the distribution is flatter and its peak is shifted to higher energy.
The proportion of molecules with energy at or above the activation energy, the area under the tail, rises by far more than the mean energy does.
A much larger fraction of collisions therefore has enough energy to react, so the rate nearly doubles.
Question 8 (3 marks)
A student does the runs in the order 60, 50, 40, 30 and 20 °C in one flask without washing it between runs. Explain the effect on the graph of 1/t against temperature.
Mark scheme
Sulfur from each run stays in the flask, so the flask is already cloudy at the start of the next run.
The cross then disappears sooner, so each time is too short and 1/t is too large.
The error grows through the sequence and so is largest for the coolest runs, which lifts the low-temperature end of the line and reduces its gradient.
Question 9 (3 marks)
Suggest how a light sensor and data logger placed under the flask would improve the method, and state what would be used as the end point.
Mark scheme
The sensor records the light passing through the mixture continuously, so the judgement of when the cross has gone is removed.
The end point becomes a fixed fall in the light transmitted, the same in every run, and the time is read from the trace rather than from a stopwatch.
The trace also gives an initial rate, from its gradient at t = 0.
Question 10 (2 marks)
Write the ionic equation for the reaction and explain why the mixture is poured away with plenty of water as soon as the cross has disappeared.
Mark scheme
S₂O₃²⁻(aq) + 2H⁺(aq) → S(s) + SO₂(g) + H₂O(l).
Sulfur dioxide is toxic and irritates the airways; pouring the mixture away at once, diluted, limits the amount released into the room.
Coverage maps are available for AQA 7404/7405, OCR Chemistry A H032/H432, Pearson Edexcel Chemistry 8CH0/9CH0 and Cambridge International 9701. Use the relevant route map to check what InkChemistry covers, and your awarding organisation’s current specification as the final authority on examinable content.