Chemistry › Kinetics › Measuring the rate of a reaction
Measuring the rate of a reaction
A rate is measured by watching something that changes as the reaction goes: a gas syringe filling, a balance reading falling, a black cross fading behind cloudy sulfur. Each method suits some reactions and fails for others. Sodium thiosulfate and hydrochloric acid, timed to a disappearing cross at five temperatures, is the rate-and-temperature practical every board sets, and 1/t is the measure of rate it uses.
Key terms Every definition in kinetics, lesson by lesson
Before this Collision theory, activation energy and the rate of reaction – rate as a gradient, and the tangent at t = 0 · The Maxwell–Boltzmann distribution, temperature and catalysts – why the rate rises steeply with temperature · Measurement, uncertainty and significant figures in chemistry – percentage uncertainty and the resolution of a balance and a thermometer
COMMON MISCONCEPTION
If a reaction gives off a gas, its rate can always be followed by standing the flask on a balance and watching the mass fall.
Mass loss works only when the gas is heavy enough to register. Carbon dioxide, Mr 44, from marble and acid gives a clear fall; hydrogen, Mr 2, from magnesium and acid loses so little mass that the balance cannot resolve it. For a light gas, collect it in a gas syringe or over water and follow the volume instead.
What you should be able to do
- Choose a method to follow a given reaction, by gas volume, mass loss, colour or a precipitate, and justify the choice with a calculation where one helps.
- Explain why 1/t is proportional to the rate when t is the time taken to reach a fixed end point.
- Describe the practical that measures the effect of temperature on the rate of the reaction between sodium thiosulfate and hydrochloric acid, including its hazards.
- Calculate 1/t from a results table, plot it against temperature and describe the trend.
- Evaluate the errors in a rate experiment and suggest improvements that reduce them.
- Calculate a rate in mol dm⁻³ s⁻¹ from a clock reaction's results, using the fixed amount of product formed at the end point.
Choosing what to measure
Nobody can count molecules as they react, so a rate is measured through something that changes as the reaction goes and changes in proportion to the amount that has reacted. The choice depends on what the reaction makes. A gas can be collected or weighed as it leaves; a coloured substance appearing or fading can be read with a colorimeter; a precipitate can be timed until it hides a mark.
| Method | What is measured | Suits | Watch for |
|---|---|---|---|
| Gas volume | Volume of gas in a gas syringe at set times | Any reaction that gives off a gas, such as marble or magnesium with acid | Gas escaping before the bung is in; a syringe that sticks |
| Mass loss | Mass of an open flask on a balance at set times | A reaction giving off a dense gas, such as carbon dioxide | Hydrogen is too light to register; acid spray leaving the flask |
| Colorimetry | Absorbance of light by a coloured substance | A reaction with a coloured reactant or product, such as iodine with propanone | A calibration curve is needed to turn absorbance into concentration |
| Disappearing cross | Time for a precipitate to hide a mark under the flask | A reaction that forms a precipitate, such as thiosulfate with acid | The end point is judged by eye; the depth of liquid must not change |
The methods also differ in what one run gives. A gas syringe, a balance or a colorimeter gives a reading every few seconds through a single run, so one experiment produces a whole curve, and a rate can be found from its gradient at any time. That is continuous monitoring. A disappearing cross gives one number per run, the time to the end point. To see how a variable affects the rate by that method, the run is repeated at several values of the variable, and each time gives one rate.
A colorimeter passes light of one colour through a small cell of the mixture and measures how much is absorbed. The filter is chosen to be the colour the coloured substance absorbs most strongly, blue for orange-brown iodine. The absorbance rises with the concentration of the coloured substance, and a calibration curve, made by reading solutions of known concentration, turns each reading into a concentration. Nothing is added to the mixture or taken from it, so a colorimeter can follow a fast reaction second by second; iodine reacting with propanone is followed this way.
Whatever the method, a fair comparison changes one thing. The variable deliberately changed is the independent variable, the one measured is the dependent variable, and everything else that could affect the rate is held the same in every run as a control variable.
- Continuous monitoring
- Following a single reaction mixture by reading a property that changes, at intervals, through the whole reaction.
- End point
- The moment at which a fixed, observable change has taken place, such as a cross disappearing, when the timing is stopped.
- Independent variable
- The variable that is deliberately changed from one run to the next.
- Dependent variable
- The variable that is measured in each run to see the effect of the change.
- Control variable
- A variable kept the same in every run so that it cannot affect the result.
- Calibration curve
- A graph of a measured property, such as absorbance, against known concentrations of a substance, used to convert a reading into a concentration.
Gas volume and mass loss
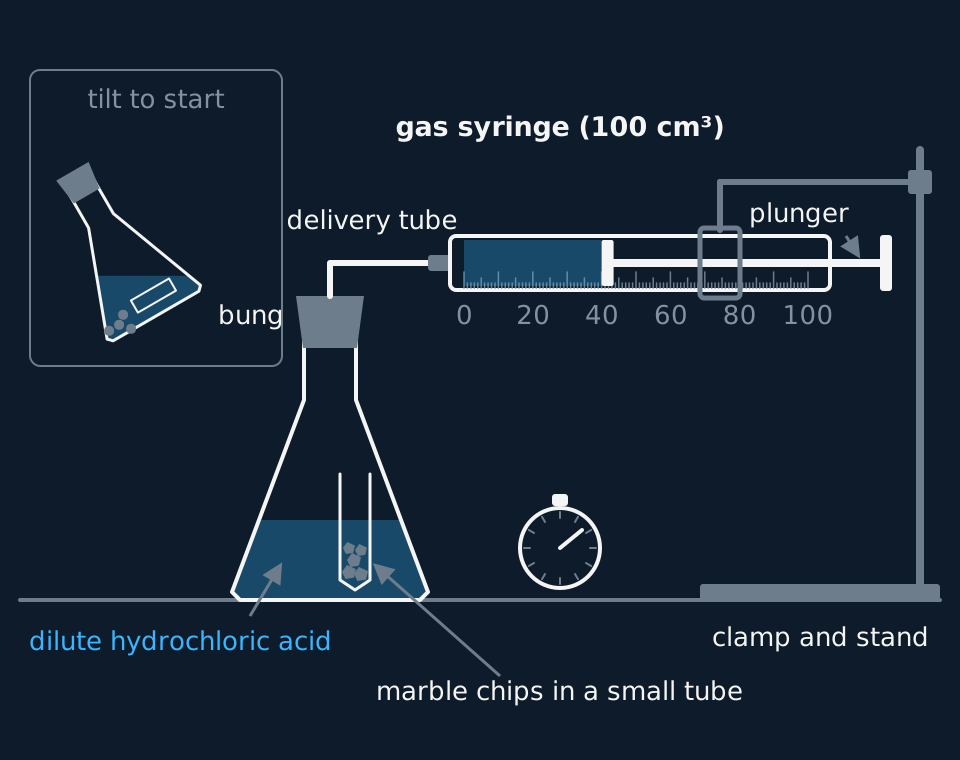
In the gas syringe method the reaction runs in a conical flask closed by a bung, with a delivery tube leading to a 100 cm³ glass syringe clamped horizontally. As gas forms, it pushes the plunger out, and the volume is read from the scale every ten or fifteen seconds. Gas lost while the bung is being pushed in is never counted, so the solid is often held in a small tube inside the flask and tipped into the acid once the bung is in place.
Describe the drawing
Apparatus for following a reaction by the volume of gas it gives off. A conical flask on the bench holds dilute hydrochloric acid with a small open tube of marble chips standing upright in it, and is closed by a bung. A delivery tube runs from the bung to the nozzle of a 100 cubic centimetre glass gas syringe held level by a clamp and stand, its plunger pushed out to about 40 cubic centimetres. A stopwatch stands beside the flask, and a small inset shows the flask tilted so the marble tips into the acid.
Gas can also be collected over water in an upturned measuring cylinder or burette. That is cheaper, and a burette is graduated every 0.1 cm³, but carbon dioxide dissolves a little in water, so some of it is never counted. A gas syringe avoids that, though a glass plunger can stick and then jump, and the syringe holds only 100 cm³.
For mass loss, the flask stands on a balance with a loose plug of cotton wool in its neck. The plug lets carbon dioxide out but catches the droplets of acid the bubbles throw up, which would otherwise leave the flask and be counted as gas. The balance reading falls as the gas escapes, and mass lost against time gives a curve the same shape as volume against time.
Mass loss needs a heavy gas. At room temperature and pressure, 100 cm³ of carbon dioxide is 100 ÷ 24 000 = 4.17 × 10⁻³ mol, a mass of 0.183 g, which a balance reading to 0.01 g follows easily. The same volume of hydrogen weighs 0.0083 g, less than one division on the balance. A reaction that gives off hydrogen is followed with a gas syringe.
The smallest change an instrument can show is its resolution: 0.01 g for this balance, 1 cm³ for the syringe. The syringe scale is read by eye, so each reading is uncertain by half a division, ±0.5 cm³. The balance is digital, so each reading is uncertain by one in its last digit, ±0.01 g. A mass loss is the difference between two readings and carries both: ±0.02 g on the whole 0.183 g of carbon dioxide, or 11%. In the first few seconds, when only 0.02 g has gone, the uncertainty is as large as the reading. Early readings are the least certain by any method, which is one reason the initial rate is found from a tangent to the whole curve and not from the first two points.
- Resolution
- The smallest change in a quantity that an instrument can show, such as 0.01 g on a balance reading to two decimal places.
TRY IT: Choosing a method for magnesium
0.050 g of magnesium ribbon reacts with excess dilute hydrochloric acid. Use calculations to decide whether mass loss on a balance reading to 0.01 g, or gas volume in a 100 cm³ syringe, should be used to follow it. The molar volume is 24.0 dm³ mol⁻¹.
Check your answer
Mg(s) + 2HCl(aq) → MgCl₂(aq) + H₂(g). The amount of magnesium is 0.050 ÷ 24.3 = 2.06 × 10⁻³ mol, so 2.06 × 10⁻³ mol of hydrogen forms.
Its mass is 2.06 × 10⁻³ × 2.0 = 0.0041 g. The whole reaction would move the balance reading by less than one division, so mass loss cannot follow it.
Its volume is 2.06 × 10⁻³ × 24 000 = 49 cm³, about half the capacity of the syringe and readable to the nearest cubic centimetre throughout. Use the gas syringe.
Thiosulfate, acid and a disappearing cross
Sodium thiosulfate solution and dilute hydrochloric acid are both colourless. Mixed, they stay clear for a few seconds and then turn a milky pale yellow, which thickens until the flask is opaque. The cloudiness is a fine precipitate of sulfur.
Na₂S₂O₃(aq) + 2HCl(aq) → 2NaCl(aq) + S(s) + SO₂(g) + H₂O(l)
S₂O₃²⁻(aq) + 2H⁺(aq) → S(s) + SO₂(g) + H₂O(l)The ionic equation. The sodium and chloride ions are spectators.
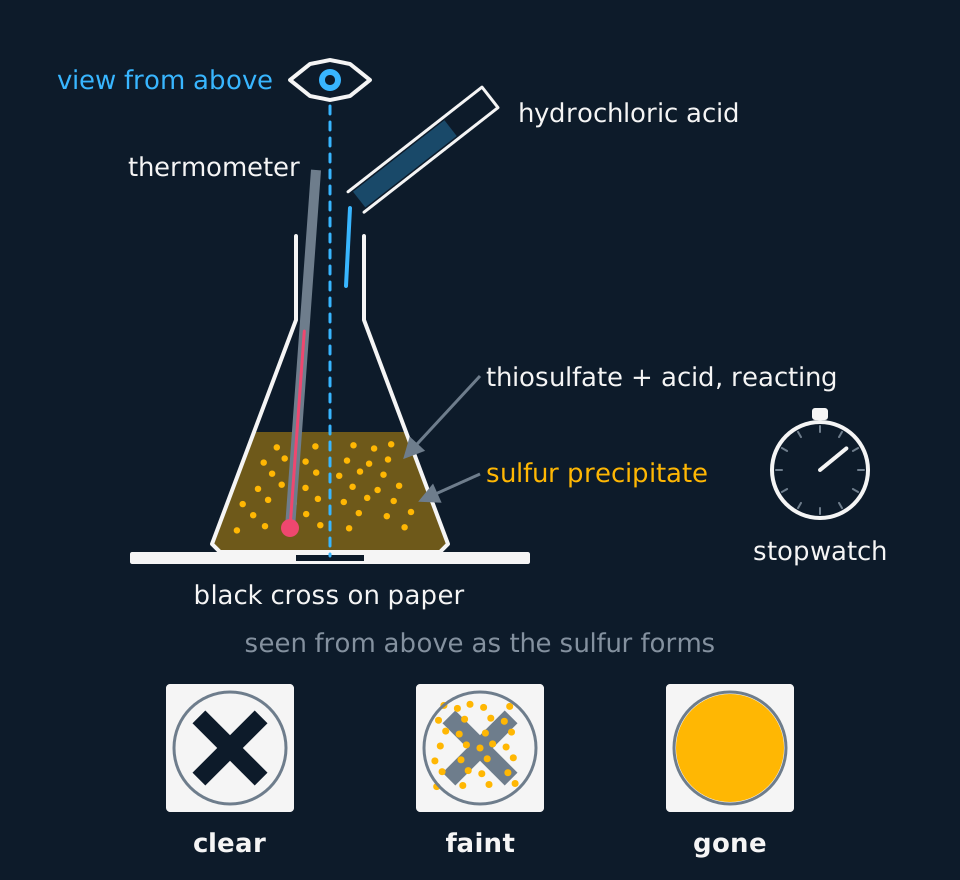
With the flask standing on paper marked with a bold black cross, an observer looking down through the liquid sees the cross fade and then vanish. It vanishes when a certain amount of sulfur has formed in the liquid above it. With the same flask, the same volume of liquid and the same cross, that amount is the same in every run.
Describe the drawing
A conical flask of pale cloudy yellow liquid stands on a sheet of white paper marked with a bold black cross. An eye directly above the flask looks down a dashed vertical sight line through the neck and the full depth of the liquid to the cross. Hydrochloric acid is being poured in from a tilted boiling tube, a thermometer stands in the flask, and a stopwatch is beside it. Below, three views from above show the cross clear, then faint, then gone as sulfur precipitate builds up.
1/t therefore measures the rate. A rate is an amount changed divided by the time taken to change it. Here the amount of sulfur at the end point is fixed, so the rate is that fixed amount divided by t, which is proportional to 1/t. A run that takes 40 s has twice the rate of one that takes 80 s. The unit of 1/t is s⁻¹.
Strictly, 1/t is the mean rate from mixing to the end point, not the rate at t = 0. The cross vanishes when only a small fraction of the thiosulfate has reacted, so the concentrations have barely changed by then, and 1/t is close to the initial rate. A method whose end point comes late, after most of a reactant has gone, does not have that property.
The same apparatus measures the effect of concentration. The thiosulfate solution is diluted with water and the total volume kept at 50 cm³, so the depth of liquid over the cross and the amount of acid stay the same and only the thiosulfate concentration changes. The temperature is now a control variable.
| Run | Na₂S₂O₃(aq) / cm³ | Water / cm³ | HCl(aq) / cm³ | [S₂O₃²⁻] before the acid / mol dm⁻³ |
|---|---|---|---|---|
| A | 50 | 0 | 10 | 0.050 |
| B | 40 | 10 | 10 | 0.040 |
| C | 30 | 20 | 10 | 0.030 |
| D | 20 | 30 | 10 | 0.020 |
| E | 10 | 40 | 10 | 0.010 |
From A to E there are fewer thiosulfate ions in each cubic decimetre, so fewer collisions with hydrogen ions per second, and the cross takes longer to vanish. A graph of 1/t against thiosulfate concentration shows how strongly the rate depends on it, which is the question the second year's rate equations answer.
The sulfur dioxide is the hazard. It is a toxic gas that irritates the eyes and the lungs and can bring on an asthma attack, so the room must be well ventilated, and anyone with asthma is at particular risk. Hot runs give it off faster. Each mixture is poured away with plenty of water as soon as its time is recorded, not left to stand, and eye protection is worn throughout.
The end point depends on the observer's eyes and on the light in the room. A light sensor under the flask, connected to a data logger, replaces judgement with a measurement: the time for the light reaching the sensor to fall to a set value is the same quantity every time it is reached.
A clock reaction: a rate from a fixed amount
A clock reaction is arranged so that its end point comes when a fixed, known amount of product has formed, and that turns 1/t into a rate in mol dm⁻³ s⁻¹. In the iodine clock, hydrogen peroxide oxidises iodide ions to iodine in acid solution. A small, measured amount of sodium thiosulfate in the mixture turns each iodine molecule back into iodide as soon as it forms, so no iodine builds up at first.
H₂O₂(aq) + 2I⁻(aq) + 2H⁺(aq) → I₂(aq) + 2H₂O(l)The reaction being timed.
I₂(aq) + 2S₂O₃²⁻(aq) → 2I⁻(aq) + S₄O₆²⁻(aq)Fast. It removes iodine until the thiosulfate has gone.
When the last of the thiosulfate has been used, the next iodine formed stays in solution and turns the starch present blue-black at once. The colour appears suddenly, a sharper end point than a fading cross. The iodine made by then is half the amount of thiosulfate added, the same in every run, so the mean rate up to the end point is that amount, as a concentration, divided by t.
| Run | H₂O₂(aq) / cm³ | Water / cm³ | t / s |
|---|---|---|---|
| 1 | 10.0 | 30.0 | 96 |
| 2 | 20.0 | 20.0 | 49 |
| 3 | 30.0 | 10.0 | 32 |
| 4 | 40.0 | 0.0 | 24 |
Rates from an iodine clock
Each run in the table also held 5.0 cm³ of 0.0100 mol dm⁻³ sodium thiosulfate with starch and 5.0 cm³ of acidified potassium iodide in excess, a total volume of 50.0 cm³. Only the volume of hydrogen peroxide solution changed, with water making up the difference. Calculate the rate of formation of iodine in each run, and deduce how the rate depends on the concentration of hydrogen peroxide.
Show the working
Thiosulfate added: 0.0050 dm³ × 0.0100 mol dm⁻³ = 5.0 × 10⁻⁵ mol. Two S₂O₃²⁻ ions remove one I₂, so the colour appears when 2.5 × 10⁻⁵ mol of iodine has formed.
As a concentration in 50.0 cm³: 2.5 × 10⁻⁵ ÷ 0.0500 dm³ = 5.0 × 10⁻⁴ mol dm⁻³ of iodine at the end point, in every run.
Rate = 5.0 × 10⁻⁴ ÷ t. Run 1: 5.0 × 10⁻⁴ ÷ 96 = 5.2 × 10⁻⁶ mol dm⁻³ s⁻¹. Runs 2, 3 and 4 give 1.0 × 10⁻⁵, 1.6 × 10⁻⁵ and 2.1 × 10⁻⁵ mol dm⁻³ s⁻¹.
The total volume is the same in every run, so the hydrogen peroxide concentration in runs 2, 3 and 4 is two, three and four times that in run 1. The rates are 2.0, 3.0 and 4.0 times the rate in run 1.
Within the precision of the timing, the rate is proportional to the concentration of hydrogen peroxide. Each value is a mean over the run, but so little iodine forms before the colour appears that the concentrations have hardly changed, and it is close to the initial rate.
Required practical 3: rate and temperature
AQA required practical; optional reading for other boards
Every board sets this experiment: it is required practical 3, investigation of how the rate of a reaction changes with temperature, a practical activity group 9 or 10 task for OCR, part of core practical 14 for Edexcel, and a practical-paper task for Cambridge. The thiosulfate reaction suits it because each temperature gives a time with no gas to collect.
Apparatus: a 250 cm³ conical flask; a 50 cm³ and a 10 cm³ measuring cylinder; a boiling tube; a water bath, either thermostatic or a large beaker of water warmed with a kettle; a thermometer reading to 1 °C; a stopwatch; a sheet of white paper with a bold black cross. Solutions: 0.050 mol dm⁻³ sodium thiosulfate and 1.0 mol dm⁻³ hydrochloric acid.
| Step | What to do | Why |
|---|---|---|
| 1 | Draw a bold cross on white paper. Use the same paper, flask and lighting for every run | How soon the cross disappears depends on how visible it is |
| 2 | Measure 50 cm³ of sodium thiosulfate solution into the flask and 10 cm³ of hydrochloric acid into the boiling tube | The acid is in excess, and the same volumes give the same depth of liquid over the cross |
| 3 | Stand the flask and the tube in the water bath until both reach the target temperature, checking each with the thermometer | The mixture then starts at the temperature being tested |
| 4 | Stand the flask on the cross, pour in the acid, start the stopwatch as it goes in, and swirl once | Timing starts at mixing |
| 5 | Look down through the liquid and stop the watch when the cross can no longer be seen | The same view in every run gives the same end point |
| 6 | Measure the temperature of the mixture at once, and record the mean of the starting and final temperatures | The mixture cools on the bench, and fastest in the hottest runs |
| 7 | Pour the mixture away with plenty of water straight away | This limits the sulfur dioxide released into the room |
| 8 | Repeat at about 20, 30, 40, 50 and 60 °C, three times at each | Five values show the trend; repeats show the spread |
The independent variable is the temperature of the mixture. The dependent variable is the time for the cross to disappear, converted to 1/t. The controls are the volume and concentration of each solution, and so the depth of liquid, the flask, the cross, the lighting and the observer.
The results below are idealised; a real class set scatters more.
| Bath temperature / °C | Run 1 / s | Run 2 / s | Run 3 / s | Mean t / s |
|---|---|---|---|---|
| 20 | 126 | 121 | 125 | 124 |
| 30 | 66 | 63 | 65 | 64.7 |
| 40 | 36 | 34 | 35 | 35.0 |
| 50 | 21 | 19 | 20 | 20.0 |
| 60 | 12 | 11 | 13 | 12.0 |
1/t against temperature from the results
Use the results table to find 1/t at each temperature, plot 1/t against temperature, and describe what the graph shows.
Show the working
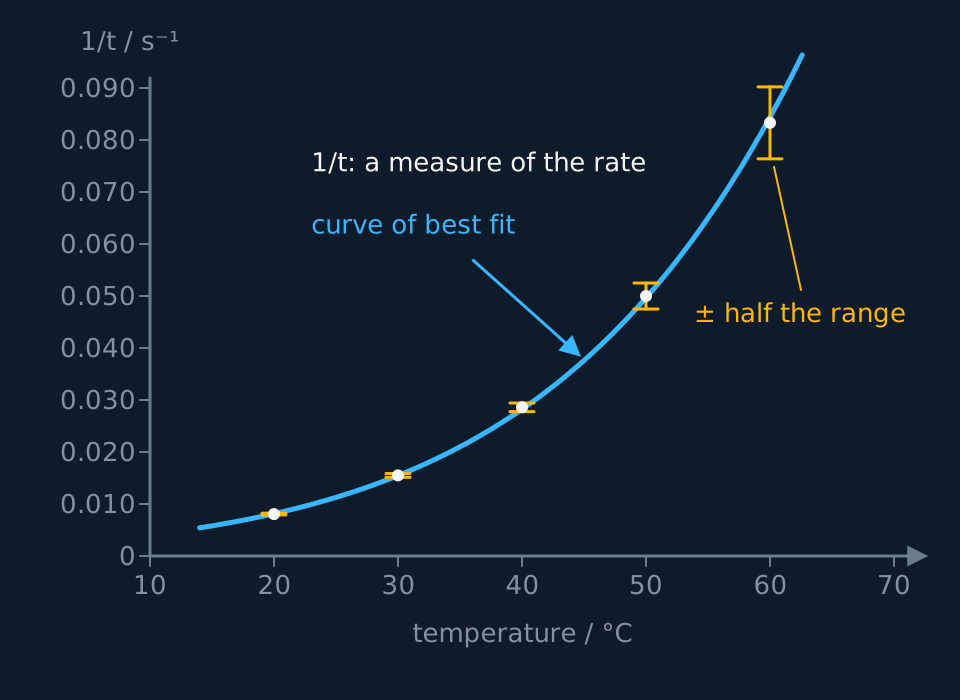
At 20 °C the mean time is (126 + 121 + 125) ÷ 3 = 124 s, so 1/t = 1 ÷ 124 = 0.00806 s⁻¹. The other four are worked the same way: 0.0155, 0.0286, 0.0500 and 0.0833 s⁻¹.
Plot 1/t on the vertical axis against temperature on the horizontal axis, with scales that use more than half the grid, and draw a smooth curve of best fit. It is not a straight line: it climbs more steeply at each step.
Compare each value with the one ten degrees below: 0.0155 ÷ 0.00806 = 1.92, then 1.85, 1.75 and 1.67. The rate nearly doubles for each 10 °C rise, as the Maxwell–Boltzmann distribution predicts for a reaction with a substantial activation energy.
So the rate increases with temperature, and ever more steeply. Between 20 °C and 60 °C it rises by a factor of 0.0833 ÷ 0.00806 = 10.
Describe the drawing
A graph of one over time, in reciprocal seconds, against temperature from 10 to 70 degrees Celsius. Five points at 20, 30, 40, 50 and 60 degrees rise from about 0.008 to about 0.083, each roughly double the one before. A smooth cyan curve of best fit passes through them and grows steeper to the right rather than following a straight line. Amber error bars showing half the range of the repeats are too short to see at the cool end and largest at 60 degrees.
Repeats reveal random error: at 60 °C the three times span 11 to 13 s, at 20 °C 121 to 126 s. A systematic error is different. An observer who always stops the watch a moment after the cross has gone makes every time too long, and repeats cannot reveal it. Using one observer throughout keeps that error the same at every temperature, so the trend survives it.
- Random error
- An error that makes repeated readings scatter unpredictably on both sides of the true value; its effect is reduced by repeating the measurement and taking a mean.
- Systematic error
- An error that shifts every reading from the true value in the same direction by a similar amount; repeating the measurement neither reveals it nor reduces it.
- Percentage uncertainty
- The uncertainty in a measurement divided by the measured value and multiplied by 100.
| Error | Effect | Improvement |
|---|---|---|
| The end point is judged by eye | Observers, or one observer on different runs, stop the watch at different degrees of cloudiness | One observer throughout, or a light sensor and data logger under the flask |
| The mixture cools once it leaves the bath | The hot runs happen at a lower temperature than the bath, so points are plotted too far to the right | Record the starting and final temperatures and plot the mean |
| Reaction time when starting and stopping the watch | A fixed error of a few tenths of a second is a larger percentage of the short times | Dilute the thiosulfate in every run so that the fastest run takes a minute or more |
| Acid and thiosulfate at different temperatures when mixed | The mixture starts at a temperature between the two | Leave both in the bath for the same time and check each with the thermometer |
| Measuring cylinders | About ±0.5 cm³ in each volume | Burettes, which read to ±0.05 cm³ |
How reliable is the 60 °C point
At 60 °C the three times were 12, 11 and 13 s, and the mixture cooled from 61.0 °C to 58.0 °C during the run. At 50 °C the times were 21, 19 and 20 s. Estimate the percentage uncertainty in each mean time, decide whether the rates at 50 °C and 60 °C are genuinely different, and say what temperature the hot run should be plotted at.
Show the working
Take the uncertainty in a mean as half the range of the repeats. At 60 °C that is (13 − 11) ÷ 2 = 1 s, and 1 ÷ 12.0 × 100 = 8%. At 50 °C it is (21 − 19) ÷ 2 = 1 s on 20.0 s, which is 5%.
The percentage uncertainty in 1/t is the same as the percentage uncertainty in t. So 1/t at 60 °C is 0.0833 ± 0.0069 s⁻¹, between 0.0764 and 0.0902, and at 50 °C it is 0.0500 ± 0.0025 s⁻¹, between 0.0475 and 0.0525.
The two ranges do not overlap, so the difference between the rates is real and not an artefact of the spread.
The mixture averaged (61.0 + 58.0) ÷ 2 = 59.5 °C, which describes the run better than the bath's 60 °C. The fastest runs carry the largest uncertainty in time and in temperature, so they are the points to repeat first.
Risk assessment. Sulfur dioxide is toxic and irritates the airways: work in a well-ventilated room, pour each mixture away at once, and anyone with asthma takes particular care or works near a fume cupboard. Dilute hydrochloric acid irritates the eyes, so eye protection is worn. Lift hot flasks with care and keep the kettle's cable clear of the water. Check the CLEAPSS Hazcard for each substance and the school's risk assessment before starting; where they differ from this method, follow them.
Other boards: clock reactions and initial rates
OCR files the methods under two headings: PAG 9 is continuous monitoring, by gas volume, mass loss or colour, and PAG 10 is initial rates, where a clock reaction or a series of short runs gives one rate for each starting concentration. An OCR question can ask which group a method belongs to.
Edexcel's core practical 13 is in two parts: 13a follows the iodine and propanone reaction by sampling and titration, and 13b is a clock reaction timed to a sudden colour change, with 1/t or a rate in mol dm⁻³ s⁻¹ plotted against concentration.
In the exam
- In a description of RP3 the marks go to the quantities and the order: volumes and concentrations, both solutions warmed separately in the bath, the watch started on mixing, the same cross and observer, the mixture's temperature recorded, and repeats at five temperatures.
- An explanation of 1/t is credited only when it says the end point is a fixed amount of sulfur, so rate, which is amount divided by time, is proportional to 1/t. '1/t is the rate' without the fixed amount is not enough.
- For the hazard the scheme accepts sulfur dioxide as toxic or an irritant, with ventilation as the precaution. Eye protection answers the acid, not the gas, and is not credited for the sulfur dioxide mark.
- An improvement earns its mark only when it names the error it reduces: a light sensor removes the judgement of the end point; recording the mixture's temperature deals with cooling.
- A choice of method is best justified with a calculation of the gas formed: carbon dioxide is heavy enough for mass loss, hydrogen is not, and a volume over 100 cm³ will not fit a gas syringe.
Check yourself
A student carries out required practical 3 but, to save time, uses a narrower 100 cm³ flask for the 50 °C and 60 °C runs, with the same volumes of solution. Explain why her 1/t values at those two temperatures cannot be compared with the others, and say what the error does to her graph.
Answer
The cross disappears when there is enough sulfur in the light path between the cross and the observer's eye. The same volume in a narrower flask stands deeper, so the light passes through more liquid.
In the deeper liquid the cross is hidden when a smaller concentration of sulfur has formed. The amount of reaction at the end point is no longer the same as in the other runs, so 1/t is no longer proportional to the rate on the same scale.
The end point comes sooner in the narrow flask, so t is too short and 1/t too large. The two hottest points sit too high, and the curve looks steeper than it should. The flask, and so the depth of liquid, is a control variable.
Questions
Question 16 marks
Describe how to investigate the effect of temperature on the rate of the reaction between sodium thiosulfate solution and dilute hydrochloric acid.
Mark scheme
Indicative content
- measured volumes of sodium thiosulfate solution, for example 50 cm³, in a conical flask and of hydrochloric acid, for example 10 cm³, in a separate tube
- both are warmed separately in a water bath to the chosen temperature, checked with a thermometer
- the flask stands on paper marked with a cross; the acid is added and a stopwatch started at the moment of mixing
- the watch is stopped when the cross can no longer be seen looking down through the liquid, and the temperature of the mixture is recorded
- the experiment is repeated at about five temperatures, for example 20 to 60 °C, with repeats at each, keeping volumes, concentrations, flask, cross and observer the same
- 1/t is calculated as a measure of rate and plotted against temperature, in a well-ventilated room because sulfur dioxide is given off
Levels
- Level 3 (5–6 marks) the volumes, the separate warming of both solutions, the cross and the timing from mixing to disappearance, the range of temperatures with repeats, the variables kept the same and the processing as 1/t against temperature are all present, with the ventilation precaution
- Level 2 (3–4 marks) the cross method and the timing are described over a range of temperatures; the two solutions are not warmed separately, the controls are not named, or the results are not processed into 1/t
- Level 1 (1–2 marks) the solutions are mixed and timed at different temperatures, with the time itself taken as the rate and no controls or repeats
Question 25 marks
Calculate the rate of formation of iodine in run 2 of the iodine clock results in the table, in mol dm⁻³ s⁻¹, and deduce how the rate depends on the iodide concentration. Every run held 5.0 cm³ of 0.0040 mol dm⁻³ sodium thiosulfate with starch, and hydrogen peroxide and acid in excess, in a total volume of 40.0 cm³. The thiosulfate reacts as I₂(aq) + 2S₂O₃²⁻(aq) → 2I⁻(aq) + S₄O₆²⁻(aq).
| Run | KI(aq) / cm³ | Water / cm³ | Time for the blue-black colour / s |
|---|---|---|---|
| 1 | 5.0 | 15.0 | 120 |
| 2 | 10.0 | 10.0 | 61 |
| 3 | 20.0 | 0.0 | 30 |
Mark scheme
- M1 amount of thiosulfate = 0.0050 dm³ × 0.0040 mol dm⁻³ = 2.0 × 10⁻⁵ mol
- M1 iodine formed at the end point = 2.0 × 10⁻⁵ ÷ 2 = 1.0 × 10⁻⁵ mol, a concentration of 1.0 × 10⁻⁵ ÷ 0.0400 = 2.5 × 10⁻⁴ mol dm⁻³
- B1 doubling the iodide volume, at the same total volume, halves the time and quadrupling it quarters the time, so the rate is proportional to the iodide concentration
- M1 rate in run 2 = 2.5 × 10⁻⁴ ÷ 61
- A1 rate = 4.1 × 10⁻⁶ mol dm⁻³ s⁻¹ to two significant figures; allow error carried forward from the amount of iodine
Question 34 marks
Calculate 1/t for two runs of the disappearing-cross experiment in which the cross disappeared after 47 s and after 18 s, and the factor by which the rate increased, explaining why 1/t can be used as a measure of the rate.
Mark scheme
- B1 the cross disappears when a fixed amount of sulfur has formed, the same in every run, so rate = fixed amount ÷ t is proportional to 1/t
- M1 1/t = 1 ÷ 47 and 1 ÷ 18
- A1 1/t = 0.021 s⁻¹ and 0.056 s⁻¹, to two significant figures, with the unit s⁻¹
- A1 factor = 47 ÷ 18 = 2.6, a ratio with no unit, to two significant figures; allow 0.056 ÷ 0.021 = 2.7
All 20 questions with mark schemes, the other 17 set out in full on the question page.
Worth remembering
- A choice of method with no calculation behind it is a guess: find the mass or volume of gas and compare it with the balance or the syringe.
- Rule the tangent to the whole curve; a rate from the first two readings uses the least certain points.
- A narrower flask, or a different volume over the cross, changes the amount of sulfur at the end point, and that run no longer compares.
- Record the mixture's temperature, not the bath's: a hot run that has cooled plots too far right.
- 'Wear eye protection' answers the acid, not the gas: the hazard mark needs sulfur dioxide named and ventilation.
CHECK YOUR PROGRESS
Rate how confident you are with each objective for this lesson. Ratings are saved in this browser, on this device, unless you sign in.
- Choose a method to follow a given reaction, by gas volume, mass loss, colour or a precipitate, and justify the choice with a calculation where one helps.
- Explain why 1/t is proportional to the rate when t is the time taken to reach a fixed end point.
- Describe the practical that measures the effect of temperature on the rate of the reaction between sodium thiosulfate and hydrochloric acid, including its hazards.
- Calculate 1/t from a results table, plot it against temperature and describe the trend.
- Evaluate the errors in a rate experiment and suggest improvements that reduce them.
- Calculate a rate in mol dm⁻³ s⁻¹ from a clock reaction's results, using the fixed amount of product formed at the end point.
Open the full revision checklist to see every objective in the curriculum in one place.
Practise this lesson
Practise measuring the rate of a reaction with 20 original questions and point-by-point mark schemes
WORKBOOK
The written questions from this topic, on paper with room to work, and a separate book of mark schemes. The 5 questions that are set on a diagram stay on this page, where the diagram can be drawn. Free to use; please do not redistribute or sell.
Used later in Rate equations, orders of reaction and the rate constant · Finding orders from initial rates, half-lives and graphs