Maths › Statistics › Probability and Venn diagrams
Probability and Venn diagrams
Events are sets of outcomes in a sample space, and a Venn diagram shows how they overlap. Use the addition rule, and distinguish the two special cases: mutually exclusive events, for which P(A ∩ B) = 0, and independent events, for which P(A ∩ B) = P(A)P(B).
Builds on Sampling and the large data set.
IN THIS TOPIC
- Represent events on a Venn diagram, including three sets, and read probabilities from its regions.
- Use P(A ∪ B) = P(A) + P(B) − P(A ∩ B) in both directions.
- Test events for mutual exclusivity and for independence, and keep the two ideas apart.
COMMON MISCONCEPTION
Mutually exclusive events are independent, since they have nothing to do with each other.
Mutually exclusive events with non-zero probabilities are dependent. Mutually exclusive means P(A ∩ B) = 0 and independent means P(A ∩ B) = P(A)P(B), and those two agree only when P(A) = 0 or P(B) = 0. If A occurs then B did not, so P(B | A) = 0 rather than P(B), which is what independence would require.
Events as regions
An event is a set of outcomes, and a Venn diagram draws events as circles inside a rectangle holding everything that can happen. Every region carries a probability and the regions total 1. Reading the diagram is then arithmetic. A ∩ B, “and”, is the overlap. A ∪ B, “or”, is everything inside either circle. The complement A′, “not A”, is everything outside A.
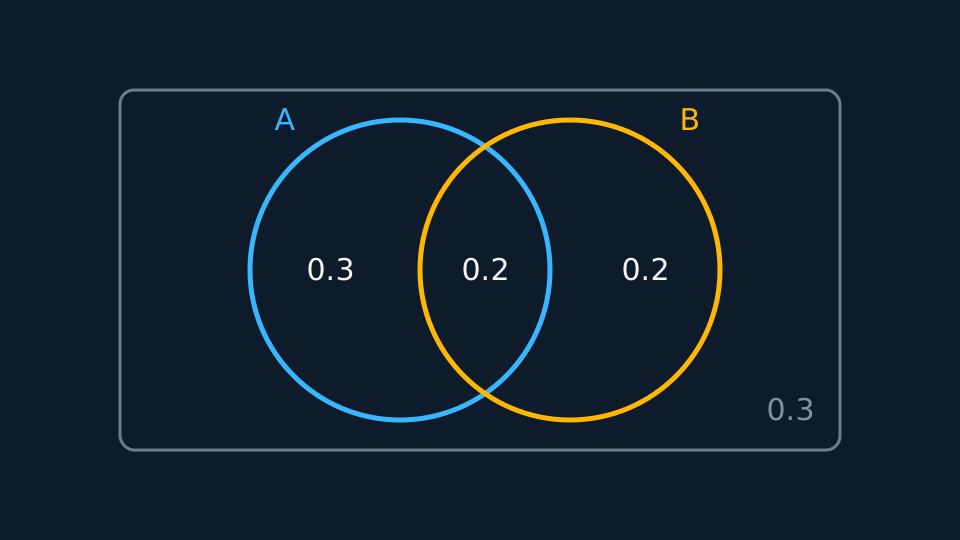
Fill diagrams from the inside out: the overlap first, then the “only” regions by subtraction, then the outside region so that the total is 1. Note that P(A) includes the overlap, so it is not the probability of the A-only region.
Three-circle diagrams follow the same order. Start with the central region where all three meet, then the three pairwise regions, then the three single regions, then the outside. Working outwards, each unknown region is determined by one equation.
The addition rule
Adding P(A) to P(B) counts the overlap twice, so it is subtracted once. The rule rearranges to give any one of the four probabilities from the other three, and is often used to find P(A ∩ B).
WORKED EXAMPLE
Finding the overlap, then testing independence
P(A) = 0.5, P(B) = 0.4 and P(A ∪ B) = 0.7. Find P(A ∩ B) and determine whether A and B are independent.
Rearranging: P(A ∩ B) = 0.5 + 0.4 − 0.7 = 0.2.
Independence test: P(A) × P(B) = 0.5 × 0.4 = 0.2, which equals P(A ∩ B), so A and B are independent.
Show both sides of the comparison and then state the conclusion in a sentence.
Two special cases
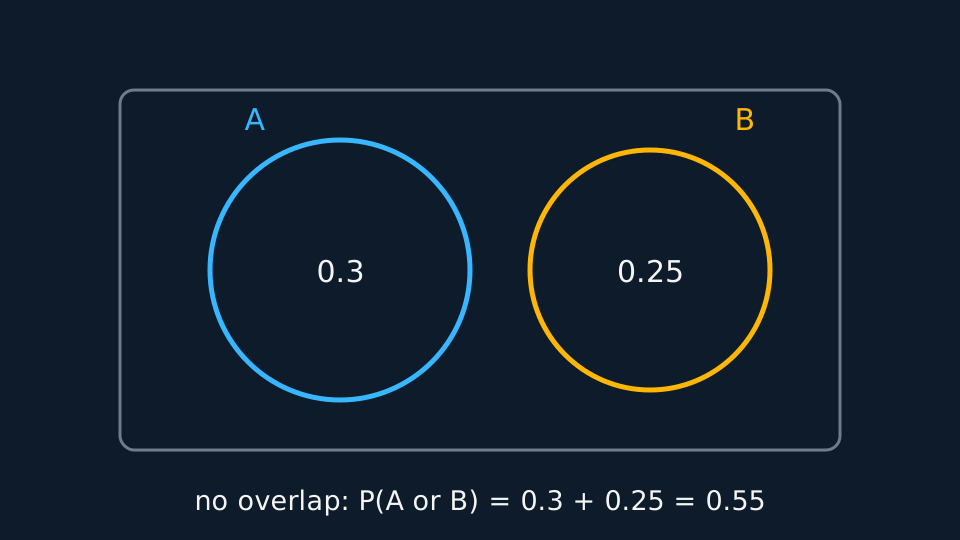
Mutually exclusive events cannot both happen. P(A ∩ B) = 0, the circles are drawn apart, and the addition rule reduces to P(A ∪ B) = P(A) + P(B).
Events A and B are independent when P(A ∩ B) = P(A) × P(B); equivalently, where the conditional probability is defined, P(A | B) = P(A). Two mutually exclusive events with non-zero probabilities are dependent, since the occurrence of one means the other did not occur. To show independence, evaluate both sides of the multiplication test and state whether they are equal.
ASSESSMENT FOCUS
- Fill Venn diagrams from the overlap outwards and check that the regions total 1.
- Be ready to rearrange the addition rule to find P(A ∩ B) as well as to use it forwards.
- Independence is established by calculation. Show P(A ∩ B) and P(A) × P(B), then state whether they are equal.
- “Independent” and “mutually exclusive” are different conditions: the first means P(A ∩ B) = P(A)P(B), the second means P(A ∩ B) = 0. Use the correct term.
CHECK YOURSELF
P(A) = 0.6, P(B) = 0.3, and A and B are mutually exclusive. Write down P(A ∩ B) and find P(A ∪ B).
Show a hint
Mutually exclusive fixes the overlap immediately.
Show the answer
P(A ∩ B) = 0 by definition of mutually exclusive.
P(A ∪ B) = 0.6 + 0.3 − 0 = 0.9.
Draw the diagram, fill the overlap first, and check that the regions total 1.
Mutually exclusive means P(A ∩ B) = 0. Independent means P(A ∩ B) = P(A)P(B). Both hold together only if P(A) = 0 or P(B) = 0.
WORKBOOK
Printable practice for this topic: original exam-style questions with room to work, and a fully worked answer book. Free to use; please do not redistribute or sell.
Or read them with their worked answers on the probability and Venn diagrams questions page.
USED LATER IN
CHECK YOUR PROGRESS
Rate how confident you feel with each objective for this lesson. Ratings are saved in this browser, on this device, unless you sign in.
- Represent events on a Venn diagram, including three sets, and read probabilities from its regions.
- Use P(A ∪ B) = P(A) + P(B) − P(A ∩ B) in both directions.
- Test events for mutual exclusivity and for independence, and keep the two ideas apart.
Open the full revision checklist to see every objective in the course in one place.