Maths › Statistics › Sampling and the large data set
Sampling and the large data set
A sample is used when a census is impractical, expensive, slow or destructive. Compare simple random, systematic, stratified, quota and opportunity sampling by bias, representativeness and practical requirements, and learn the structure of Pearson Edexcel's large data set.
IN THIS TOPIC
- Define population, census, sample and sampling frame, and say when a census is impractical.
- Describe simple random, systematic, stratified, quota and opportunity sampling, and give an advantage and a limitation of each in a context.
- Criticise someone else's sampling method by naming the group it under-represents.
- State the structure of the Pearson Edexcel large data set: eight stations, two years, and the columns that are not numerical.
- Say why a conclusion drawn from the large data set may be unsafe, missing entries included.
COMMON MISCONCEPTION
A larger sample automatically makes the results representative.
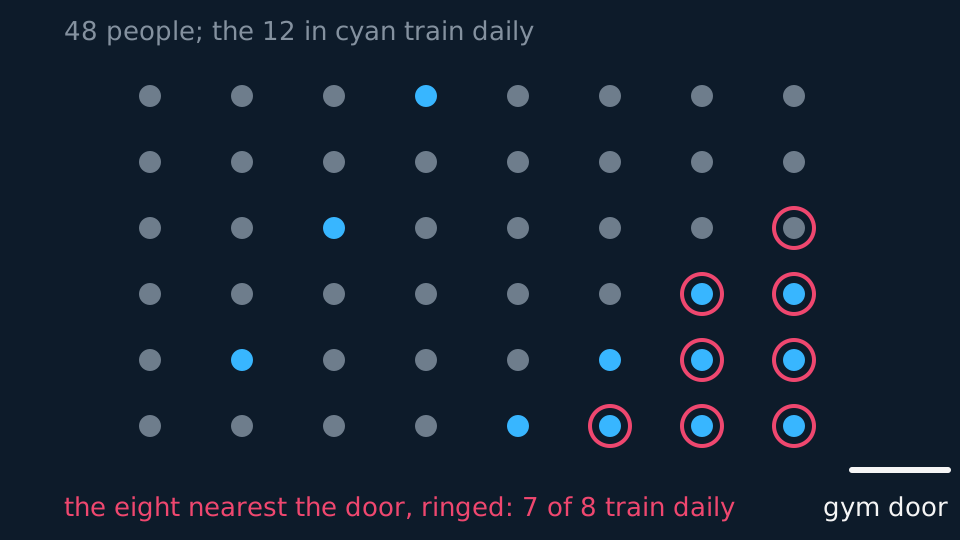
Representativeness comes from the method of selection, not from the size. A sample represents its population only if chance, not convenience, chose it, and a frame that omits part of the population is biased before any measurement is taken. Eight hundred people asked at a gym door still over-represent people who exercise.
Why sample at all
A population is every member of the group you care about, and a census measures all of them. Sometimes that is easy. One teacher can poll one class before the bell goes. For a large population a census is slow and expensive, and for some measurements it is impossible, because measuring destroys the item measured: cars cannot all be crash-tested.
A sample is a subset measured fully and used to draw conclusions about the whole population. The strength of that inference depends on the method used to select the subset. Selection is made from a sampling frame, a list naming every member. If the frame omits part of the population, the sample is biased before any measurement is taken.
Two properly taken samples from one population will differ, and neither is wrong; different samples can support different conclusions. A sample mean is an estimate of the population mean, not the population mean itself.
The three random methods
A simple random sample of size n gives every possible group of n an equal chance. Number the frame from 1 to N, then select using a random number generator or a lottery draw. The method is unbiased by construction, and the other methods are compared against it. Its drawbacks are practical: a complete frame is required, and the selected members may be widely dispersed.
Systematic sampling takes every kth member of the frame after a random start. For 50 from 1000 the gap is k = 20, and the start is a random number from 1 to 20. It is quick to apply to a long list, and random provided the list carries no repeating pattern with period a multiple of k: sampling a four-week rota every 28th name selects the same day of the week each time.
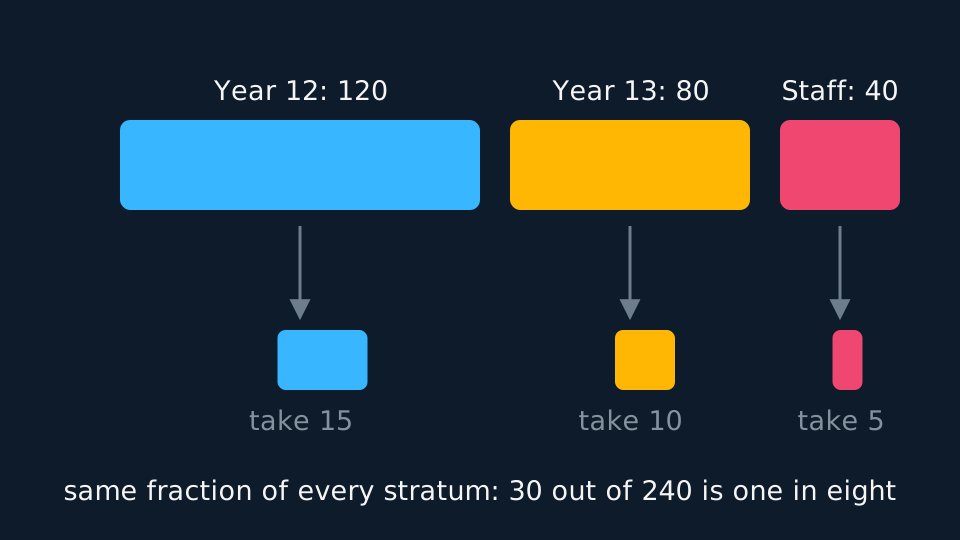
Stratified sampling splits the population into groups that matter, called strata, and takes a simple random sample from inside each one. The number taken from each stratum is
so a school of 240 sampled 30 strong takes one student in eight from every stratum. Round to whole numbers and check that the parts still total the sample size. Stratification reproduces the population proportions of the chosen strata. It does not by itself remove non-response, frame or measurement bias, or guarantee representativeness for characteristics not used to form the strata. The method also requires the strata and their sizes to be known in advance.
WORKED EXAMPLE
A stratified sample, both halves
A sixth form has 600 Year 12 and 400 Year 13 students. Explain how to take a stratified sample of 40 by year group.
Fractions first. Year 12 supplies 40 × 600/1000 = 24 students and Year 13 supplies 40 × 400/1000 = 16.
Then number each year group's names and draw a simple random sample of the right size from each, using random numbers.
A complete answer states both parts: the stratum sizes and the random selection within each stratum.
The non-random methods
Quota sampling fixes the proportions but does not select at random. An interviewer is required to find a stated number from each group and fills each quota from those available. It needs no sampling frame and is quick and inexpensive. The interviewer's choices can introduce bias, which later calculation cannot correct.
Opportunity sampling, also called convenience sampling, takes whoever is available, such as the first twenty people to arrive. It is the quickest of the five methods and the most prone to bias, because availability is often related to the variable being measured: a survey about exercise habits taken at a gym entrance over-represents people who exercise.
The large data set
Pearson Edexcel's large data set is Met Office weather data. Pearson Edexcel 9MA0 Paper 3 assumes direct experience of working with it. It holds daily records for May to October in two years, 1987 and 2015.
The variables are daily mean temperature, total rainfall, total sunshine, mean wind speed and direction, maximum gust, mean cloud cover, mean visibility, mean pressure and relative humidity. The 1987 records contain fewer of these variables than the 2015 records, so some comparisons between the two years are not possible.
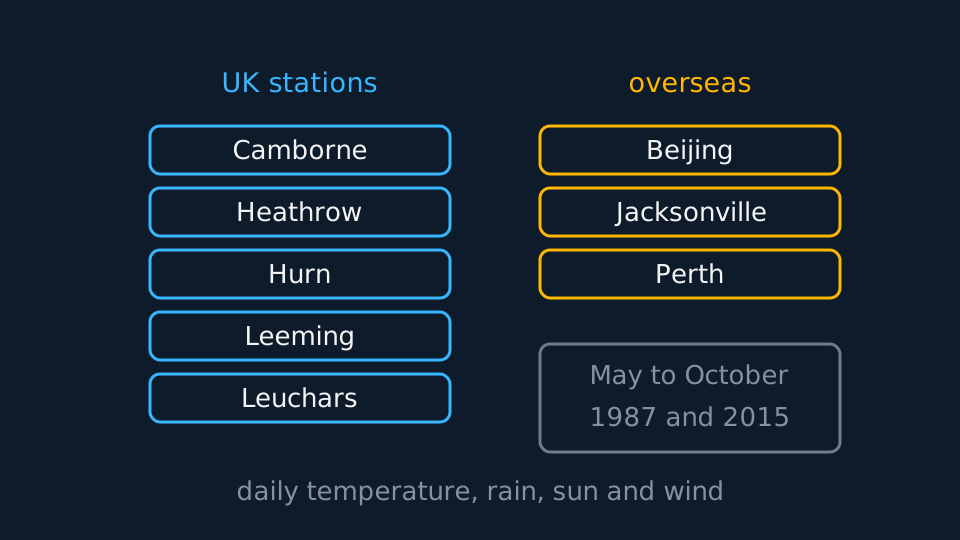
Five stations sit in the UK, at Camborne, Heathrow, Hurn, Leeming and Leuchars. Three sit overseas, at Beijing, Jacksonville and Perth. Perth is in the southern hemisphere, so its May-to-October records cover winter while Heathrow's cover summer; take this into account when comparing stations.
Not every column is numerical. Wind speed is in knots, with Pearson Edexcel's Beaufort conversion grouping it into descriptions such as calm and moderate, and wind direction is given as a compass point. Rainfall below 0.05 mm is recorded as tr, for trace, and missing values are marked n/a. State how these entries are treated before calculating: follow the coding convention given in the question or in the Pearson large-data-set guidance being used, and treat n/a as missing rather than as a measured zero, adjusting the divisor accordingly.
ASSESSMENT FOCUS
- Name the method the description matches, then give one advantage and one limitation referring to this sample and this population rather than to sampling in general.
- For a stratified sample, give both steps: stratum size over population size times sample size, and then random selection within each stratum.
- Know the structure of the large data set: eight stations, two years, May to October, with Perth in the southern hemisphere.
- “Random” is a technical term here. Quota and opportunity samples are not random, however carefully the proportions are set.
- To criticise a method, name the group that is under-represented and say why. “The sample is too small” does not identify a source of bias.
CHECK YOURSELF
A factory's 1200 workers are 900 full-time and 300 part-time. Describe how to take a sample of 60, stratified by contract type.
Show a hint
Fractions of the population first, then random selection inside each stratum.
Show the answer
Full-time supplies 60 × 900/1200 = 45 workers; part-time supplies 60 × 300/1200 = 15.
Number each group's members and draw a simple random sample of the required size from each, for example with a random number generator.
The two counts total 60, which checks the arithmetic.
A sample represents its population only if chance, not convenience, chose it.
Stratify when you know the structure. The same fraction from every stratum keeps the sample's proportions matched to the population's.
WORKBOOK
Printable practice for this topic: original exam-style questions with room to work, and a fully worked answer book. Free to use; please do not redistribute or sell.
Or read them with their worked answers on the sampling and the large data set questions page.
CHECK YOUR PROGRESS
Rate how confident you feel with each objective for this lesson. Ratings are saved in this browser, on this device, unless you sign in.
- Define population, census, sample and sampling frame, and say when a census is impractical.
- Describe simple random, systematic, stratified, quota and opportunity sampling, and give an advantage and a limitation of each in a context.
- Criticise someone else's sampling method by naming the group it under-represents.
- State the structure of the Pearson Edexcel large data set: eight stations, two years, and the columns that are not numerical.
- Say why a conclusion drawn from the large data set may be unsafe, missing entries included.
Open the full revision checklist to see every objective in the course in one place.