Maths › Further Statistics 2 › Estimators, standard error and confidence intervals
Estimators, standard error and confidence intervals
A sample statistic is a random variable with a distribution of its own. Knowing that distribution turns a single estimate into an interval, and shows how far the estimate can be trusted.
Builds on The Central Limit Theorem and The normal distribution and Sampling and the large data set.
IN THIS TOPIC
- Explain what an unbiased estimator is and check whether a given one qualifies.
- Compute an unbiased estimate of a population variance from summary statistics.
- Calculate a standard error and say what it measures.
- Construct and interpret a confidence interval for a normal mean.
COMMON MISCONCEPTION
A 95% confidence interval has a 95% chance of containing the sample mean.
The sample mean sits at the centre of its own interval every time; what the procedure sets out to capture is the population mean μ. And μ is a fixed number rather than a random one, so no probability attaches to whether it lies inside a particular interval. The 95% describes the procedure: build one interval this way from each of many samples and 95% of them would contain μ.
Estimators and bias
An estimator is a rule for turning a sample into a guess at a population parameter. Feed it a different sample and it gives a different answer, so it is itself a random variable. It is unbiased when its expected value equals the parameter it is aiming at. The sample mean is unbiased for the population mean. The sample variance needs the n − 1 divisor to be unbiased for σ²:
Pearson Edexcel 9FM0 formulae booklet: included, under Sampling distributions, which also records that the sample mean is unbiased for μ with variance σ²/n. The computational form used on summary statistics is not printed in this form.
The bracket is Sxx, and Sxx = Σx² − (Σx)²/n is included in the booklet, so s² can be obtained by looking up Sxx and dividing by n − 1. Dividing by n instead underestimates σ² systematically, because the squared deviations are measured from the sample mean, which lies closer to its own data than μ does. Note also that s² is unbiased for σ² while s is not unbiased for σ: taking a square root does not preserve unbiasedness.
WORKED EXAMPLE
An unbiased estimate from summary statistics
A sample of 10 gives Σx = 240 and Σx² = 5850. Find unbiased estimates of the population mean and variance.
The sample mean is 240/10 = 24, and it is unbiased for μ as it stands.
Sxx = 5850 − 240²/10 = 5850 − 5760 = 90.
s² = 90/9 = 10. Dividing by 10 instead of 9 would have given 9, which is the bias the n − 1 divisor removes.
Efficiency and the standard error
Unbiasedness alone is a weak criterion. Among unbiased estimators, prefer the one with the smaller variance, because its values cluster more closely about the parameter. That property is called efficiency.
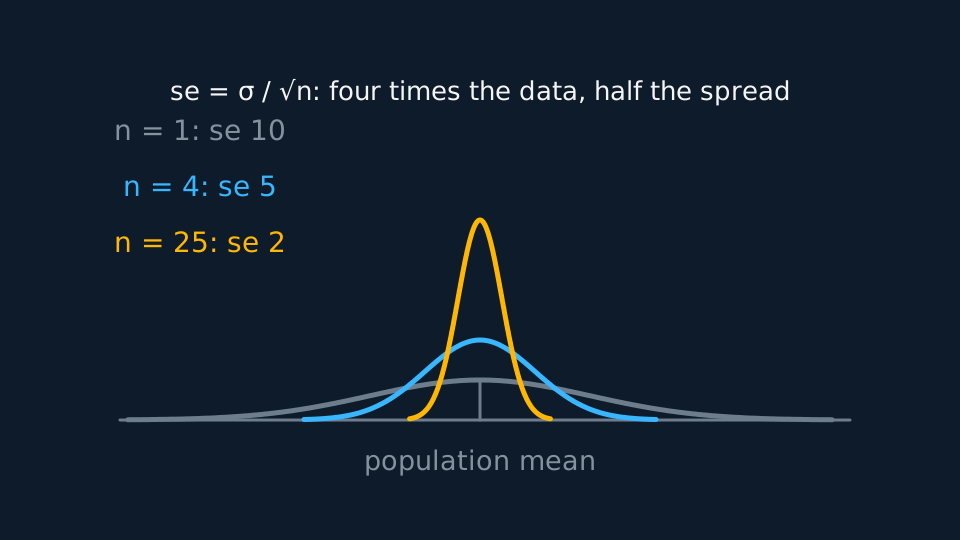
The standard error of an estimator is the standard deviation of its sampling distribution. For the sample mean, SE = σ/√n when the population standard deviation is σ. It falls with the square root of the sample size, so quadrupling the data halves it.
WORKED EXAMPLE
Comparing two estimators
A population has mean μ. Two estimators are proposed from a sample of 3: the mean of all three values, and the first value alone. Compare them.
Both are unbiased, since E(sample mean) = μ and E(X1) = μ.
Their variances are σ²/3 and σ². The sample mean has a third of the variance, so its standard error is smaller by a factor of √3.
The sample mean is the more efficient. Being unbiased does not by itself make an estimator worth using.
Turning an estimate into an interval
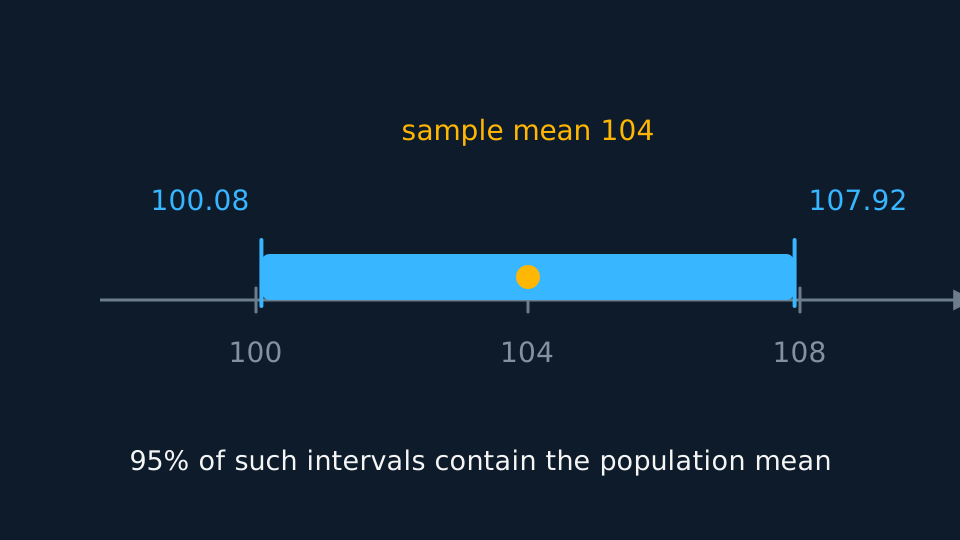
Suppose the population variance is known and either the population is normal or the sample is large enough for the Central Limit Theorem. Then the sample mean is normal with standard error σ/√n, so a fixed proportion of samples land within a fixed number of standard errors of μ. Reversing that statement gives a confidence interval:
Pearson Edexcel 9FM0 formulae booklet: not included. The standardised statistic and the percentage points are given, and the interval is built from those. The interpretation needs care. The population mean is a fixed number, not a random one, so it either is or is not inside your interval and no probability attaches to that. What is random is the interval itself. Build one this way from each of many repeated samples and 95% of them would contain μ. And the quantity captured is μ, not the sample mean, which sits at the centre of its own interval every time.
GUIDED PRACTICE
Building the interval
A sample of 25 from a normal population with σ = 10 has mean 104. Find 95% and 99% confidence intervals for μ, and comment.
Show the working
The standard error is 10/√25 = 2.
95%: 104 ± 1.96 × 2 = 104 ± 3.92, giving (100.08, 107.92).
99%: 104 ± 2.5758 × 2 = 104 ± 5.15, giving (98.85, 109.15).
More confidence costs width. Since 100 lies inside both, a claim that μ = 100 would survive a two-tailed test at either level.
ASSESSMENT FOCUS
- Calculate the standard error on a line of its own before using it.
- Use the n − 1 divisor whenever the question says 'unbiased estimate'. A calculator's population standard deviation key gives the wrong one.
- Quote the z value you used, and use 2.5758 instead of 2.58 when the question asks for accuracy.
- Interpret the interval as a statement about the procedure, never as the probability that μ lies inside.
- Link the interval to a test: a value outside the interval is rejected by the matching two-tailed test.
CHECK YOURSELF
A sample of 100 from a population with σ = 20 has mean 55. Find a 95% confidence interval for μ.
Show a hint
Standard error first, then 1.96 of them either side.
Show the answer
Standard error 20/√100 = 2. The interval is 55 ± 1.96 × 2 = 55 ± 3.92, that is (51.08, 58.92).
An estimator is unbiased when its expected value is the parameter, and among unbiased ones the smaller variance is preferred.
The standard error of an estimator is the standard deviation of its sampling distribution, σ/√n for the sample mean: a 95% interval is the sample mean ± 1.96 standard errors, and 95% of such intervals capture μ.
WORKBOOK
Printable practice for this topic: original exam-style questions with room to work, and a fully worked answer book. Free to use; please do not redistribute or sell.
Or read them with their worked answers on the estimators, standard error and confidence intervals questions page.
USED LATER IN
CHECK YOUR PROGRESS
Rate how confident you feel with each objective for this lesson. Ratings are saved in this browser, on this device, unless you sign in.
- Explain what an unbiased estimator is and check whether a given one qualifies.
- Compute an unbiased estimate of a population variance from summary statistics.
- Calculate a standard error and say what it measures.
- Construct and interpret a confidence interval for a normal mean.
Open the full revision checklist to see every objective in the course in one place.