Physics › Required practicals › Stationary waves on a string
REQUIRED PRACTICAL 1Stationary waves on a string
How the frequency of a stationary wave on a stretched string depends on its length, the tension in it and its mass per unit length.
Theory: Stationary waves on strings · Progressive waves
What you are trying to do
Find how the first-harmonic frequency of a stationary wave on a stretched string depends on the string's length, the tension in it, and its mass per unit length.
Apparatus
- Signal generator driving a vibration generator, clamped at one end of the bench
- String or wire over a pulley at the far end, with a hanger and slotted masses providing the tension
- A movable bridge to set the vibrating length, and a metre rule
- A top-pan balance and a long sample of the same string, for the mass per unit length
Variables
- Independent: the vibrating length L (then, in later series, the tension T and the mass per unit length μ)
- Dependent: the first-harmonic frequency
- Control: whichever two of L, T and μ are not being varied in the current series
Method
- Measure the mass per unit length first: weigh a long measured sample of the string and divide. A long sample keeps the percentage uncertainty down.
- Hang a known mass over the pulley; the tension is its weight.

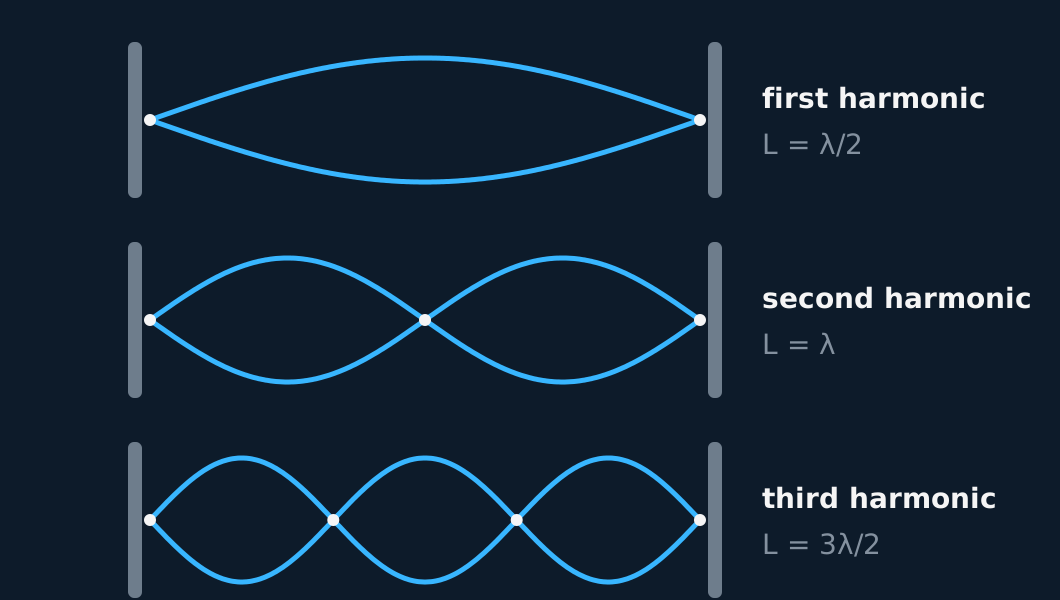
- Set the bridge for the chosen length, then sweep the signal generator slowly until the string vibrates in one large loop. Approach the resonance from below and from above and take the middle of the range that looks maximal: judging the peak is the main skill of the experiment.
- Record the frequency, then repeat for a series of lengths at fixed tension, and afterwards for a series of tensions at fixed length.
- The spec names a third variable. Swap in strings of different thickness at fixed length and tension, weighing a long sample of each to get its own μ, and record the first-harmonic frequency for each string.
Analysis
- The first harmonic satisfies f = (1/2L) × the square root of T/μ, so at fixed tension f is proportional to 1/L.
- Plot f against 1/L and fit a straight line without constraining it. The model predicts a line through the origin whose gradient is half the wave speed. From the gradient, recover the speed, and from v² = T/μ recover the mass per unit length to compare with your weighed value.
- For the tension series, plot f against the square root of T: straight through the origin again if the model holds.
- For the string series, plot f against 1/√μ: a third straight line through the origin, and the check that every quantity in the formula behaves as the formula claims.
- What three straight lines are worth. Each series tests one factor with the other two held still, and the mass per unit length you recover from the first gradient can also be set against the value you weighed at the start. Agreement to a few per cent supports the whole formula, since a wrong power anywhere in it would bend one of the lines rather than tilt it. The lines say nothing outside the range you covered: five lengths between 0.400 m and 0.800 m cannot speak for a string a centimetre long, where its stiffness starts to matter as much as its tension.
- What the string itself limits. Motion at the driven end creates an end correction, so the effective vibrating length differs from the measured length. A roughly constant length offset has a larger fractional effect at shorter L and can produce an intercept or curvature. Repeating the readings does not remove it. The improvement that does is structural: run the string over two bridges and drive it just outside one of them, so both ends of the length you measure are genuinely held still.
A worked set of readings
String of mass per unit length 4.8 × 10⁻⁴ kg m⁻¹ under a 200 g load (tension 1.96 N):
| L / m | (1/L) / m⁻¹ | f₁ / Hz |
|---|---|---|
| 0.400 | 2.50 | 79.9 |
| 0.500 | 2.00 | 63.9 |
| 0.600 | 1.67 | 53.3 |
| 0.700 | 1.43 | 45.7 |
| 0.800 | 1.25 | 40.0 |
Idealised illustrative data, chosen so the working is easy to follow. Real readings scatter about the line rather than sitting on it, and your own graph will have points either side of the best fit.
The gradient of f against 1/L is 32.0 Hz m, so the wave speed is v = 2 × 32.0 = 64 m s⁻¹. Then μ = T/v² = 1.96/64² = 4.8 × 10⁻⁴ kg m⁻¹, matching the weighed value: the model closes on itself.
Evaluating the result
Idealised readings again, with one of them taken incorrectly on purpose. The frequency at 0.600 m was recorded while the string was vibrating in two loops rather than one. The second harmonic resonates just as sharply and is easy to mistake for the first from across the bench. The third column multiplies f by L, which the model says is half the wave speed and the same number at every length.
| L / m | f₁ / Hz | f₁L / Hz m |
|---|---|---|
| 0.400 | 79.9 | 32.0 |
| 0.500 | 63.9 | 32.0 |
| 0.600 | 106.6 | 63.9 |
| 0.700 | 45.7 | 32.0 |
Idealised illustrative data, chosen so the working is easy to follow. Real readings scatter about the line rather than sitting on it, and your own graph will have points either side of the best fit.
Three rows agree at 32.0 Hz m and the odd one comes out at 63.9, exactly double. On the f against 1/L graph it sits a full factor of two above the line rather than a little off it. A misread rule or a misjudged resonance peak would move the point by a few per cent; a factor of two is the size of a harmonic. Retune the string at that length, verify that it forms one loop, and repeat the measurement. Exclude the original result only with this documented evidence, and keep the original reading in the table with the reason recorded.
Where the uncertainty comes from
- Judging the resonance: The amplitude peak is broad, so bracket it: note the frequency where the amplitude clearly falls off on each side and take the midpoint and half-range.
- The vibrating length: Measured between the bridge and the vibration generator; neither end is a perfect node, so the effective length differs from the measured one. Keep L large, where a fixed end correction is a smaller fraction of it.
- Mass per unit length: Weigh a metre or more, not a short offcut; the balance reads to 0.01 g, and a short sample wastes that.
- Tension: Assumes a frictionless pulley and a stationary hanging mass; check the mass hangs freely and is not oscillating.
What earns the marks
✓Marks
- Say that you tuned to the maximum amplitude of a single loop, approaching the resonance from below and from above: that is what identifies the first harmonic.
- Linearise before plotting: f against 1/L, or f against the square root of T, and say what the gradient means.
- State that each string's μ came from a long weighed sample, and why.
- Two loops means the second harmonic, at twice the first-harmonic frequency. Retune to one loop and measure again rather than dividing the recorded frequency by two.
- Be able to give a percentage uncertainty for the gradient quantity; the half-range of repeated readings is the usual estimate at this level.
Safety
!Caution
Keep feet clear of the hanging masses and put padding beneath them; a snapping string lets the stack drop. Keep fingers away from the vibration generator, and keep the signal generator's output at a sensible level.
Method and analysis here follow the standard approach; your school may vary the apparatus. Always follow your teacher’s risk assessment in the lab.