Physics › Waves › Progressive waves
Progressive waves
A progressive wave transfers energy through a medium while each particle oscillates about a fixed equilibrium position and does not travel with the wave. Amplitude, wavelength, frequency, period and phase difference describe it, linked by c = fλ and f = 1/T. Wavelength is read off a displacement-distance graph, period off a displacement-time graph or an oscilloscope trace.
Choose your exam board to show the notes and questions relevant to your specification. You can change this setting at any time, and content for other boards remains available.
The maths behind it: Trigonometric graphs and equations on InkMaths.
IN THIS TOPIC
- Say what a progressive wave transfers, and what the particles of the medium do instead.
- Define amplitude, wavelength, frequency, period and phase difference.
- Tell a displacement-distance graph from a displacement-time graph, and take the right reading off each.
- Move between speed, frequency, wavelength and period using and .
- Read a period, a frequency and an amplitude off an oscilloscope from its time-base and y-gain settings.
COMMON MISCONCEPTION
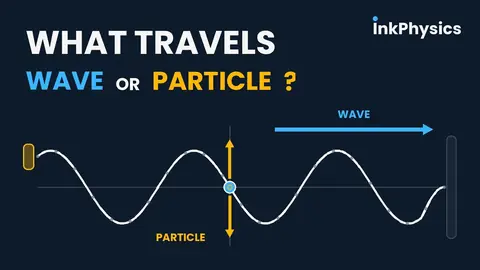
The wave carries the water along with it.
The wave does not carry the water along: each particle only oscillates about a fixed equilibrium position while the pattern travels. A progressive wave transfers energy, not matter.
What travels, and what stays
A progressive wave transfers energy through a medium without transferring the medium itself. Particles oscillate about fixed equilibrium positions; they do not travel with the wave. Each particle is set moving by the one before it, a fraction of a cycle later.
The displacement of a particle is its distance from that rest position, with a direction, so it can be positive or negative. The amplitude A is the maximum displacement, measured from the rest position to a crest, never from trough to crest.

Describe the drawing
The wave travels; P, Q and R only bob on their dashed rails, each a quarter-cycle behind the last. Mid-loop the film pauses: that frozen frame is the snapshot graph, and the amber bracket beneath it spans one wavelength, trough to trough. Underneath, P's own history draws itself, the diary, whose amber bracket is the period. Same shape, different axis.
The wavelength is the distance between one point and the next point moving identically, crest to crest being the easiest pair to spot. The frequency f is the number of complete oscillations a particle makes each second, measured in hertz, and the period T is the time one oscillation takes. Each is the reciprocal of the other.
In one period the pattern advances by exactly one wavelength. Distance over time gives the wave speed, and dividing by T is the same as multiplying by f.
CIE, OCR and Edexcel add one more measure, the rate at which the wave delivers energy. Intensity is power per unit area, I = P/A, in W m−2, and is proportional to amplitude squared for the waves considered here. Double the amplitude and the intensity quadruples.
Two graphs that look identical
A wave can be graphed two ways. A displacement-distance graph shows all particles at one instant; its repeat distance is .
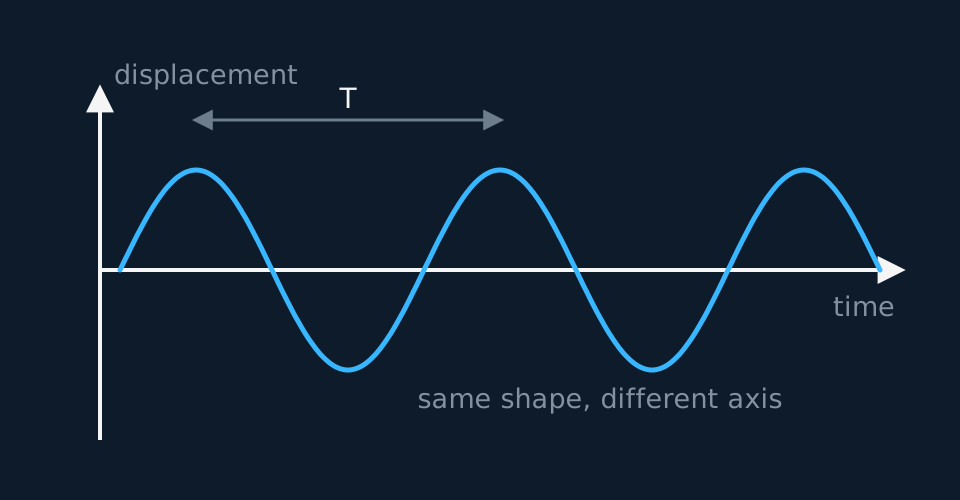
A displacement-time graph shows one particle over time; its repeat time is T. Check the horizontal axis before taking a reading. Metres let you read . Seconds let you read T. Neither graph gives you both.
WORKED EXAMPLE
A wave speed from both graphs
A displacement-distance graph of a wave shows repeats every 1.2 m; the displacement-time graph at one point repeats every 0.050 s. Find the wave's frequency and speed.
Name what each graph gave you. The first is a snapshot, so 1.2 m is the wavelength. The second watches one point, so 0.050 s is the period.
f = 1/T = 1/0.050 = 20 Hz.
v = fλ = 20 × 1.2 = 24 m s−1. Neither graph alone could have given you the speed.
Reading a wave off an oscilloscope
CIE and OCR both want those readings taken from a screen as well as from a printed graph. A cathode-ray oscilloscope, the CRO, plots the voltage fed into it vertically against time horizontally, so its trace is a displacement-time graph being drawn in front of you. Feed it a microphone and you are watching one point of a sound wave; feed it a signal generator and you are watching the signal itself. Either way the screen is ruled into squares called divisions, and two controls decide what a division is worth.
The time-base sets the horizontal scale, in seconds or milliseconds or microseconds per division. The y-gain sets the vertical scale, in volts per division. Neither control changes the wave itself. Turning the time-base down spreads the same wave across more divisions, which is how a fast signal is made readable; the period and amplitude it represents are unchanged.
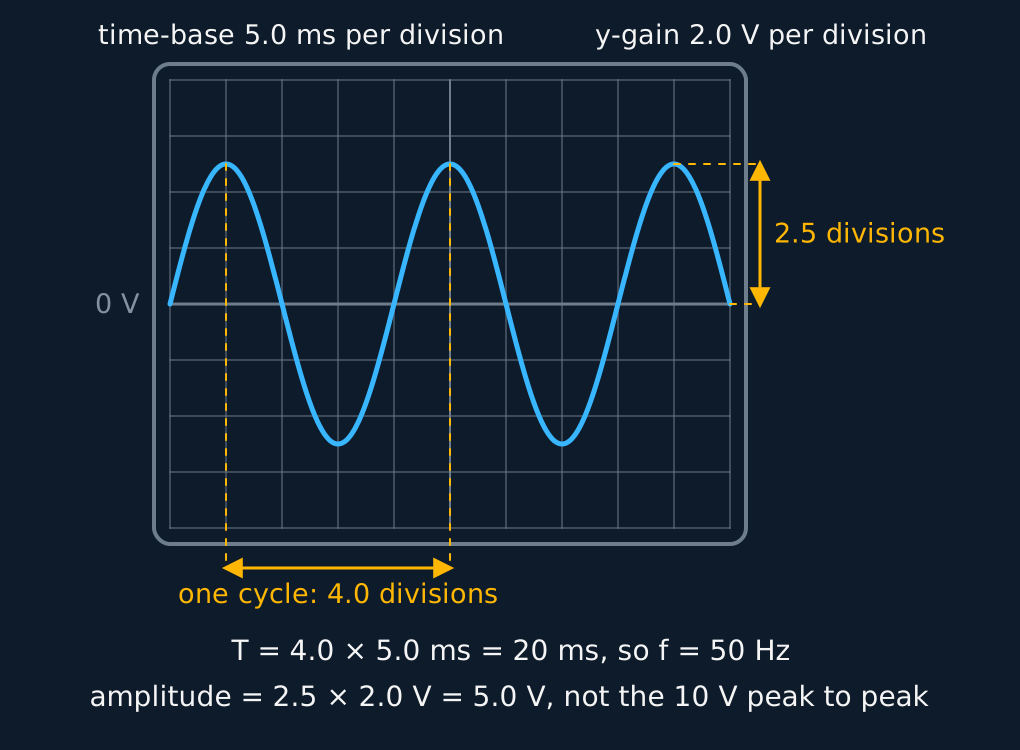
Two counts then finish the job. Count the horizontal divisions across one complete cycle, peak to the next peak or one zero crossing to the matching one, and multiply by the time-base setting to get the period T. Then f = 1/T. Count the vertical divisions from the centre line to a peak and multiply by the y-gain to get the amplitude. The full height of the trace is the peak-to-peak value, twice the amplitude, so halve it, exactly as you would on paper.
Describe the drawing
An oscilloscope screen ruled into ten divisions by eight, with a sine trace of two and a half cycles across it. One cycle, crest to the next crest, is bracketed along the bottom as four divisions, which at a time-base of 5.0 ms per division is a period of 20 ms and a frequency of 50 Hz. The height from the centre line to a crest is bracketed at the right as 2.5 divisions, which at a y-gain of 2.0 V per division is an amplitude of 5.0 V, half the 10 V the trace spans from trough to crest.
One habit improves the precision at no cost. Measure across several cycles and divide by how many you took. Ten cycles spanning eight divisions, read to the nearest tenth of a division, pin the period ten times more tightly than one cycle read the same way.
WORKED EXAMPLE
A frequency and an amplitude off the screen
One complete cycle spans 4.0 divisions with the time-base at 5.0 ms per division. The peaks sit 2.5 divisions above the centre line and the y-gain is 2.0 V per division. Find the period, the frequency and the amplitude.
Horizontal first, and the time-base is the only setting that touches it. T = 4.0 × 5.0 = 20 ms = 0.020 s.
f = 1/T = 1/0.020 = 50 Hz, the mains frequency.
Vertical next, measured from the centre line and not from the bottom of the trace. Amplitude = 2.5 × 2.0 = 5.0 V, so the trace stands 10 V peak to peak. Quoting 10 V as the amplitude doubles the answer.
Phase
Two points on a wave generally reach their crests at different moments. The phase difference between them measures the mismatch as a fraction of a cycle, expressed in radians, with one whole cycle counting as rad. Points separated by a whole wavelength move identically and are in phase; points separated by half a wavelength always move oppositely and are in antiphase, a phase difference of rad.
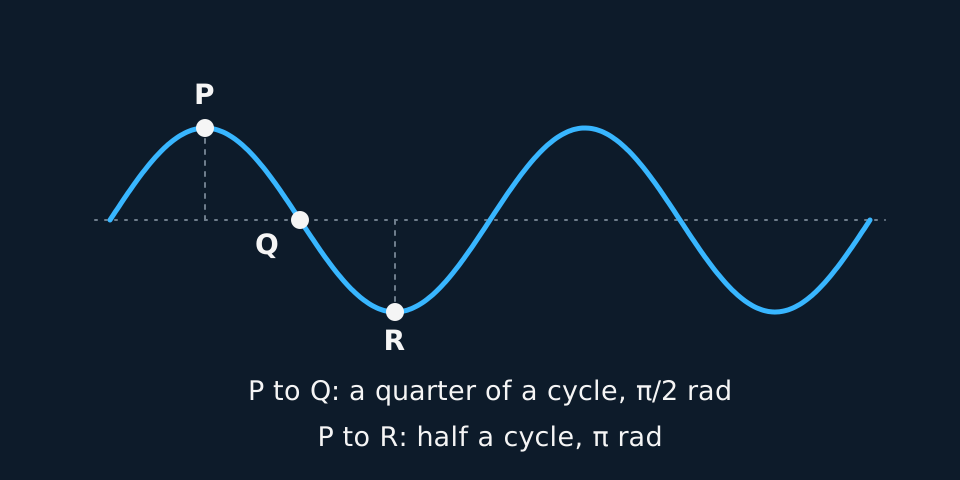
For two points a distance d apart along the same wave, the phase difference is the fraction of a full cycle.
GUIDED PRACTICE
Phase from a separation
Two points sit 0.30 m apart on a wave of wavelength 1.2 m. Find their phase difference, working in fractions of a cycle first.
Show the working
The separation is 0.30/1.2 = a quarter of a wavelength, so a quarter of a cycle.
In radians that is π/2, or 90° if the paper asks for degrees. One point peaks while the other passes through zero, which is what a quarter-cycle lag looks like.
INDEPENDENT PRACTICE
A wavelength you can picture
A long-wave radio station broadcasts at 198 kHz. Radio waves travel at 3.0 × 10⁸ m s−1. Find the wavelength, and note the scale of the answer.
Show the working
λ = v/f = 3.0 × 10⁸/(1.98 × 105) = 1.5 km.
One wavelength is longer than a village, which is what gives long wave its reach. A hill is a small obstacle compared with λ, so the wave diffracts around it.
ASSESSMENT FOCUS
- Read the axis before the graph. Displacement against time makes the crest-to-crest interval T, and quoting that as mistakes a time for a length.
- Amplitude is measured from the rest position. Halve any trough-to-crest reading before you write it down.
- In the frequency must be in Hz, so convert kHz and MHz first. Then check the size of the answer against sound in air near 340 m s−1 and light at m s−1.
- Phase difference belongs in radians unless the paper asks for degrees. A quarter of a cycle is rad, and a bare “90” needs its unit before it means anything.
- An oscilloscope question is two separate multiplications. Divisions across one cycle times the time-base gives T, and only then f = 1/T; divisions from the centre line to a peak times the y-gain gives the amplitude. Using the y-gain on a horizontal count, or the whole trace height as the amplitude, gives an answer that is out by the ratio of the two settings or by a factor of two.
CHECK YOURSELF
A wave on a rope has a period of 0.020 s and a wavelength of 8.0 m. Find (a) its frequency and (b) its speed.
Show a hint
Which equation links frequency to period? Use its answer in the second equation.
Show the answer
(a) = 1 / 0.020 = 50 Hz.
(b) = 50 × 8.0 = 400 m s−1.
No piece of rope travels at 400 m s−1. That figure belongs to the pattern and to the energy it carries. Each bit of rope oscillates fifty times a second about the place it started, and goes nowhere.
Energy travels. The particles only oscillate.
WORKBOOK
Printable practice for this topic: original exam-style questions with room to work, and a fully worked answer book. Free to use; please do not redistribute or sell.
Or read them with their mark schemes on the progressive waves questions page.
WHERE TO GO NEXT
- Required practical 1: stationary waves on a string puts this topic in the lab, and the written papers ask about it.
USED LATER IN
CHECK YOUR PROGRESS
Rate how confident you feel with each objective for this lesson. Ratings are saved in this browser, on this device, unless you sign in.
- Say what a progressive wave transfers, and what the particles of the medium do instead.
- Define amplitude, wavelength, frequency, period and phase difference.
- Tell a displacement-distance graph from a displacement-time graph, and take the right reading off each.
- Move between speed, frequency, wavelength and period using and .
- Read a period, a frequency and an amplitude off an oscilloscope from its time-base and y-gain settings.
Open the full revision checklist to track your progress across the whole unit.