Physics › Quantum phenomena › The photoelectric graph and measuring h
The photoelectric graph and measuring h
Plotting maximum kinetic energy against frequency gives a straight line of gradient h, cutting the axes at the threshold frequency and at −φ. Every metal draws the same gradient, because h belongs to the light. The pd at which coloured LEDs first light estimates the same constant from eV = hc/λ.
Choose your exam board to show the notes and questions relevant to your specification. You can change this setting at any time, and content for other boards remains available.
The photoelectric effect, part 2 of 2. Part 1 is The photoelectric effect and the photon.
IN THIS TOPIC
- Read the Ek(max) against frequency graph, naming its gradient and both intercepts.
- Estimate the Planck constant from the pd at which an LED first lights, using eV = hc/λ.
COMMON MISCONCEPTION
The gradient of the maximum kinetic energy against frequency graph gives the work function.
The gradient is the Planck constant, which is the same for every metal because h belongs to the light. The work function is the magnitude of the intercept on the energy axis, at −φ, and it is what changes from metal to metal.
Reading the graph
Rearranged as Ek(max) = hf − φ, the equation plots as a straight line against frequency, gradient h, crossing the frequency axis at the threshold.
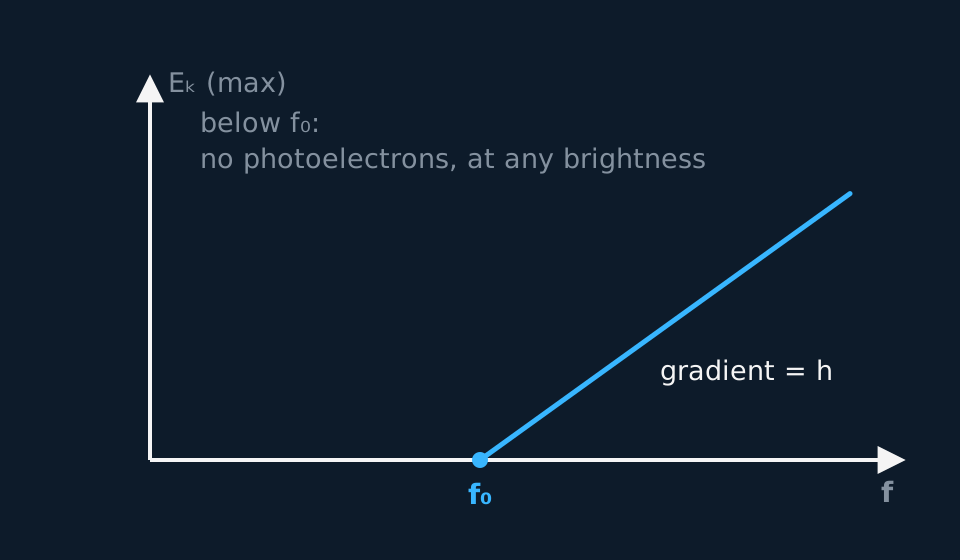
Every metal draws the same gradient, because h belongs to the light and not to the surface. Change the metal and φ changes, sliding the line sideways without tilting it, and the two intercepts move together: the threshold frequency slides along the frequency axis while the energy intercept, which sits at −φ, drops by the same amount.
GUIDED PRACTICE
Reading the straight line
A metal's photoelectric graph of maximum kinetic energy against frequency cuts the frequency axis at 5.0 × 10¹⁴ Hz. Find the maximum kinetic energy at 9.0 × 10¹⁴ Hz, working from the graph's meaning.
Show the working
The intercept is the threshold frequency, and the line's gradient is h, so Ek(max) = h(f − f0).
Ek(max) = 6.63 × 10−34 × 4.0 × 1014 = 2.7 × 10⁻¹⁹ J, about 1.7 eV. Notice that you never needed to know which metal it was. Only the intercept moves from metal to metal.
INDEPENDENT PRACTICE
Photons by the trillion
A 1.0 mW laser pointer emits 650 nm light. Find the energy of one photon and the number emitted each second.
Show the working
E = hc/λ = (6.63 × 10−34 × 3.00 × 108)/(6.5 × 10−7) = 3.1 × 10⁻¹⁹ J.
Rate = power/energy per photon = 1.0 × 10⁻³/(3.1 × 10−19) = 3.3 × 10¹⁵ per second. At that rate the arrival of individual photons is not detectable, which is why ordinary light appears continuous.
Measuring h with LEDs
Reading h off that gradient is a genuine measurement of the constant, and it takes a photocell in a vacuum tube to make. A light emitting diode gives a cheaper estimate of the same constant. In an LED, an electron crossing the junction loses energy. Some of this energy is emitted as a photon. At the threshold voltage, the approximation eV ≈ hc/λ can be used to estimate Planck's constant from measurements of V and λ. Non-radiative transitions and the subjective detection of the first visible light limit the method.
So turn the pd across an LED up from zero. Nothing shows until each electron carries enough energy to make a photon of that colour, and at that threshold pd V the electron delivers eV while the photon carries hc/λ. Equating the two treats every joule of the electron's energy as reaching the photon, and gives , which rearranges to . One voltmeter reading and the wavelength printed on the packet are the whole measurement.
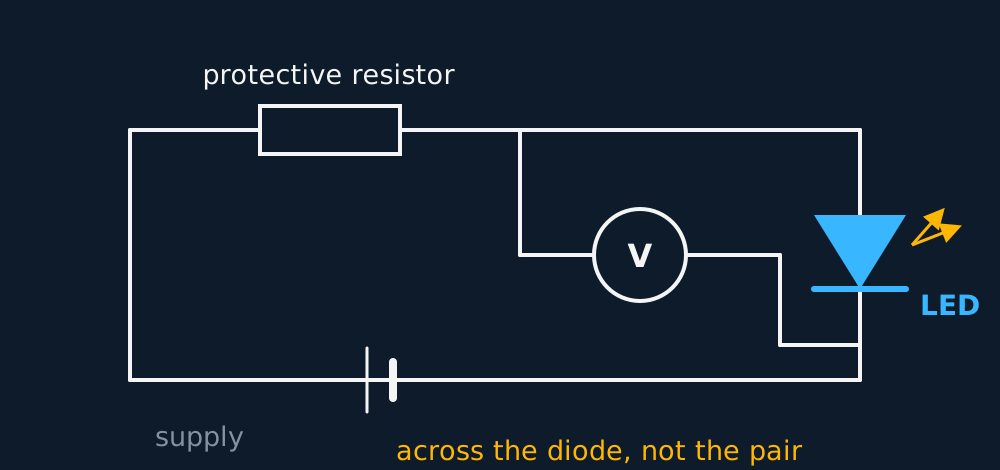
In practice the LED runs from a potentiometer with a protective resistor in series, the voltmeter goes across the LED itself rather than across the pair, and the room is darkened so that the first faint glow can be seen at all. Take the pd at which that glow appears, then repeat with LEDs of several different colours. Plotting the threshold pd against 1/λ gives a straight line of gradient hc/e, one that passes close to the origin if the thresholds have been judged well, though the method's approximations can leave a small intercept, and h comes out as gradient × e/c from all the readings together instead of resting on one.
WORKED EXAMPLE
The constant from a red LED
A red LED of quoted wavelength 630 nm first glows at 1.9 V. Estimate the Planck constant.
h = eVλ/c = (1.60 × 10−19 × 1.9 × 630 × 10−9)/(3.00 × 108) = 6.4 × 10⁻³⁴ J s.
Against the accepted 6.63 × 10⁻³⁴ J s that is about four per cent low, which is roughly what this method delivers.
The word to use for it is estimate. Judging the exact pd at which a glow begins is an eye's decision taken in a dark room, an LED emits a band of wavelengths around the one on the packet, and a little of each electron's energy is spent inside the junction rather than reaching the photon. All three are reasons to quote the result as an estimate rather than a measurement.
GUIDED PRACTICE
The same measurement, taken from a gradient
Threshold pds for LEDs of five colours are plotted against 1/λ, giving a straight line of gradient 1.24 × 10⁻⁶ V m. Find the Planck constant, and say why the gradient is more reliable than any single LED's reading.
Show the working
The gradient is hc/e, so h = gradient × e/c = (1.24 × 10−6 × 1.60 × 10−19)/(3.00 × 108) = 6.6 × 10⁻³⁴ J s.
Every threshold has been judged by the same eye in the same way, so much of that judgement error is likely to be shared between the points. Error the points share moves the line bodily and lands mainly in the intercept, while the gradient rests on the differences between the LEDs. That is a plausibility argument rather than a guarantee, and it is why the gradient is quoted rather than any single reading.
ASSESSMENT FOCUS
- The Ek(max) against f graph gets asked three ways, so learn all three. Gradient h. Intercept on the f axis at f0. Intercept on the energy axis at −φ.
- The gradient is the same for every metal, because h belongs to the light. A sketch showing two metals with lines of different steepness has drawn two different Planck constants.
- For the LED method, say what the threshold pd means before using it: an electron crossing the junction can hand its energy to one photon, so eV = hc/λ at the pd where light first appears, as an idealised threshold. Quote the answer as an estimate and name a reason, judging the first glow by eye being the readiest one.
- Where several LEDs are used, plot the threshold pd against 1/ and take h from the gradient, which is hc/e. A value taken from one LED rests on one judgement of when a glow began.
CHECK YOURSELF
A photoelectric graph of Ek(max) against frequency for caesium is a straight line crossing the frequency axis at 4.6 × 10¹⁴ Hz, with a gradient of 6.6 × 10⁻³⁴ J s. (a) State what the gradient represents and what the negative intercept on the energy axis would be. (b) A second line is drawn for zinc, whose work function is larger. State how it differs from the caesium line.
Show a hint
Which of the two quantities in Ek(max) = hf − φ belongs to the light and which to the metal?
Show the answer
(a) The gradient is the Planck constant. The energy-axis intercept is at −φ, so φ = hf0 = 6.6 × 10−34 × 4.6 × 1014 = 3.0 × 10⁻¹⁹ J, about 1.9 eV.
(b) The gradient is unchanged, because h belongs to the light and not to the surface. The zinc line is the same steepness shifted to the right: a higher threshold frequency and a more negative energy intercept.
The two intercepts move together for that reason. They are hf0 and φ, which are the same number read off two axes.
The gradient is h and belongs to the light; the intercepts are φ and f0 and belong to the metal.
The LED method gives an estimate of h, and the word estimate is part of the answer.
Or read them with their mark schemes on the photoelectric effect and the photon questions page.
CHECK YOUR PROGRESS
Rate how confident you feel with each objective for this lesson. Ratings are saved in this browser, on this device, unless you sign in.
- Read the Ek(max) against frequency graph, naming its gradient and both intercepts.
- Estimate the Planck constant from the pd at which an LED first lights, using eV = hc/λ.
Open the full revision checklist to track your progress across the whole unit.