Biology › Animal transport and cardiovascular biology › Haemoglobin and oxygen dissociation curves
Haemoglobin and oxygen dissociation curves
Haemoglobin has four subunits and carries four oxygen molecules, and the sigmoid shape of its dissociation curve follows from cooperative binding. It becomes highly saturated at the high partial pressures of the lungs and dissociates readily at the lower ones in respiring tissue. Shifts of the curve to left or right describe how species and conditions differ.
Before this Protein structure and function: quaternary structure and prosthetic groups · Partial pressure as a measure of how much of a gas is present · The mammalian gas exchange system: the alveolus
COMMON MISCONCEPTION
The Bohr shift means that in an exercising person, haemoglobin picks up less oxygen at the lungs.
The main physiological effect of the Bohr shift is greater oxygen unloading in respiring tissue. At the 12 to 13 kPa found in the lungs the curve is flat, and even the shifted curve is above 90 per cent saturated, so loading is affected much less.
What you should be able to do
- Describe haemoglobin as a conjugated globular protein and say how many oxygen molecules one molecule carries.
- Explain cooperative binding and use it to account for the sigmoid shape of the dissociation curve.
- Read percentage saturation off a dissociation curve and calculate how much oxygen is unloaded between two partial pressures.
- Explain the Bohr shift and why it is useful in exercising muscle.
- Interpret a curve that lies to the left or to the right of the human adult curve, including fetal, high-altitude and small-mammal haemoglobins.
- Describe how carbon dioxide is carried, including the role of carbonic anhydrase and the chloride shift.
What haemoglobin is, precisely
Haemoglobin is a globular protein with quaternary structure: four polypeptide chains, two α and two β in HbA, the predominant adult human form (a small fraction of adult haemoglobin uses other chains). The chains are folded so that hydrophilic side chains face outwards, which is what makes haemoglobin soluble enough to sit at high concentration inside a red blood cell.
Each of the four chains is wrapped around a haem group, which is not made of amino acids at all. A non-protein group permanently attached to a protein is a prosthetic group, and a protein carrying one is described as conjugated. At the centre of each haem group is an iron(II) ion, and each iron(II) ion binds one molecule of oxygen. Quote the numbers exactly: four chains, four haem groups, four Fe²⁺ and four O₂ per haemoglobin molecule.
Oxygen binding is association and gives oxyhaemoglobin; oxygen release is dissociation. The oxygen is held by a weak coordinate bond to the iron, so it binds and comes off again reversibly, as a transport molecule requires. A red blood cell holds about 250 million haemoglobin molecules and has no nucleus and no mitochondria, so none of the oxygen it carries is used up in transit.
- Conjugated protein
- A protein with a non-protein prosthetic group permanently associated with it.
- Prosthetic group
- The non-protein component; in haemoglobin, the haem group with its iron(II) ion.
- Partial pressure of oxygen
- The contribution oxygen makes to the total pressure of a gas mixture, measured in kPa; a measure of how much oxygen is present.
- Percentage saturation
- The proportion of the oxygen-binding sites on haemoglobin that are actually occupied.
Cooperative binding and the sigmoid curve
A plot of percentage saturation against partial pressure of oxygen gives a sigmoid curve: shallow at first, steep through the middle, levelling off at the top. That shape follows from one mechanism.
The first oxygen molecule binds with difficulty, because the quaternary structure of haemoglobin leaves the binding sites poorly accessible. Binding changes that quaternary structure slightly, and the change makes the remaining sites more accessible. The second oxygen therefore binds more readily than the first, and the third more readily still. That is cooperative binding, and it accounts for a curve that is shallow at low partial pressures and then steep.
The last site has the highest affinity of all, but with three sites already full an oxygen molecule is less likely to meet the one that is empty, which is part of why the curve flattens at the top. The other part is that above about 90 per cent saturation there is hardly any spare binding capacity, so a further rise in partial pressure increases saturation very little.
Describe the drawing
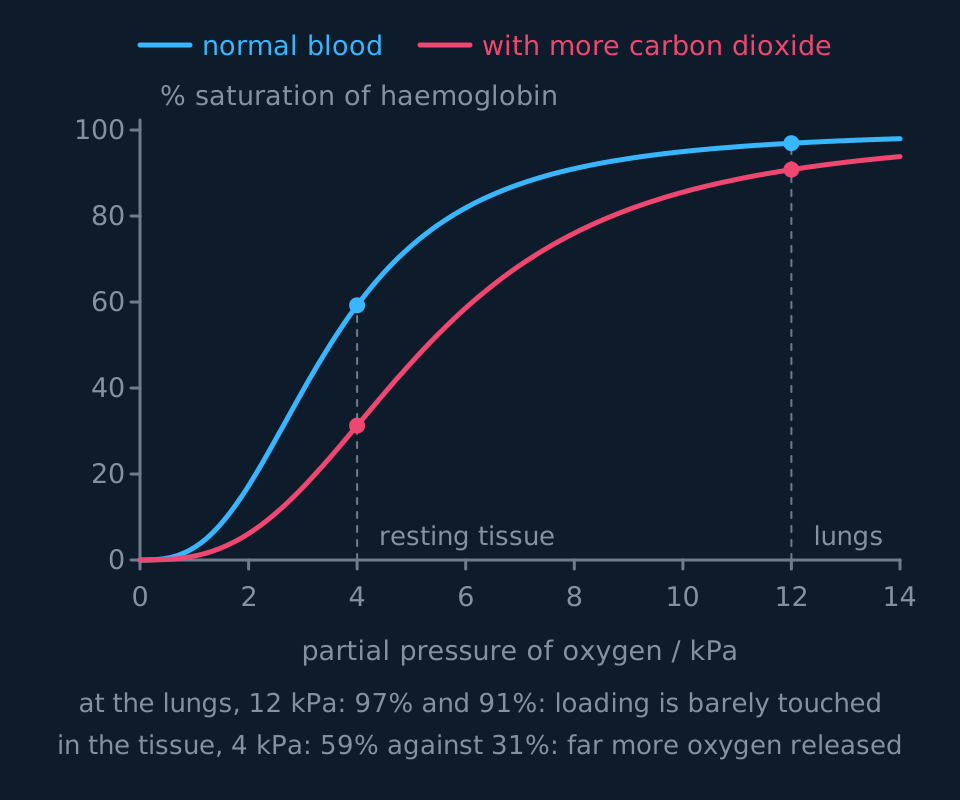
A graph of percentage saturation of haemoglobin against partial pressure of oxygen in kilopascals. The normal curve is an S-shape: shallow at first, steep through the middle, then levelling off above about 90 percent. A second curve for blood carrying more carbon dioxide lies below and to the right of it, so at any given partial pressure it is less saturated. Both curves are nearly saturated at the 12 kilopascals of the lungs, but at the 4 kilopascals of respiring tissue they are far apart.
The shape of the curve is itself the adaptation. At the alveoli, where the partial pressure of oxygen is around 12 to 13 kPa, haemoglobin is on the plateau and reaches about 97 per cent saturation. In respiring tissue, where the partial pressure is around 4 kPa at rest, it is on the steep part of the curve, where a small fall in partial pressure produces a large fall in saturation and therefore a large release of oxygen. Saturation at the lungs is consistently high, while dissociation in the tissues is sensitive to partial pressure. A linear relationship would not give both.
Reading loading and unloading from the graph
Questions on this curve require one of three operations: reading a saturation, calculating a difference, or explaining a shift. In each case, state what the result means.
To find how much oxygen is unloaded between two places, read the saturation at each and subtract. At 12 kPa the normal curve gives about 97 per cent; at 4 kPa it gives about 59 per cent; so the blood gives up about 38 per cent of its capacity to a resting tissue. In hard-working muscle the partial pressure may fall to 2 kPa, where saturation is only about 17 per cent, so four fifths of the oxygen is released. That is the effect of the steep section of the curve: halving the partial pressure from 4 kPa to 2 kPa lowers saturation by a further 42 percentage points.
Turning a percentage into a volume
100 cm³ of fully saturated blood carries 20 cm³ of oxygen. Blood arriving at a muscle is 96 per cent saturated and blood leaving it is 34 per cent saturated. Calculate the volume of oxygen released to the muscle per 100 cm³ of blood.
Show the working
The difference in saturation is 96 − 34 = 62 per cent of full capacity.
Full capacity for 100 cm³ is 20 cm³ of oxygen, so the volume released is 0.62 × 20 = 12.4 cm³.
Do not write 62 cm³: 62 is a percentage of capacity, not a volume. The 20 cm³ given in the stem converts it to a volume.
Check the axis units. Most papers use kPa; some older material and some medical sources use mmHg, on which the lungs are around 100 mmHg rather than 13 kPa. The shape and the reasoning are the same, but values on one scale cannot be read against the other.
The Bohr shift
Respiring tissue produces carbon dioxide. Carbon dioxide dissolving in the blood plasma and in red blood cells forms carbonic acid, which releases hydrogen ions and so lowers the pH. Those hydrogen ions bind to haemoglobin and alter its tertiary and quaternary structure slightly, and the altered shape holds oxygen less tightly.
The consequence on the graph is a shift to the right: at any given partial pressure of oxygen, haemoglobin in carbon-dioxide-rich blood is less saturated than it would otherwise be. State the consequence: oxygen dissociates more readily.
The tissues producing the most carbon dioxide are those respiring fastest, which are also those requiring the most oxygen, so dissociation is greatest where demand is greatest. During sprinting, an exercising muscle may take four fifths or more of the oxygen out of the blood passing through it rather than the third to two fifths it takes at rest, and a large part of that increase is the Bohr shift.
At the lungs the partial pressure of oxygen is high enough that the shifted curve has already flattened, at better than 90 per cent saturation in either case. Removal of carbon dioxide at the alveoli also raises the pH locally, returning the curve towards its normal position. The main physiological effect of the Bohr shift is therefore greater oxygen unloading in respiring tissues, with loading at the alveoli affected much less.
- Bohr shift
- The rightward shift of the oxygen dissociation curve caused by an increased partial pressure of carbon dioxide and the fall in pH that goes with it, so that oxygen dissociates more readily at any given partial pressure.
- Loading
- Association of oxygen with haemoglobin, at the gas exchange surface.
- Unloading
- Dissociation of oxygen from haemoglobin, at respiring tissue.
TRY IT: Calculating the effect of the shift
Use the two curves in the dissociation-curve figure. At the 4 kPa of respiring tissue the normal curve shows about 59 per cent saturation and the carbon-dioxide-rich curve about 31 per cent. Blood arrives at that tissue 97 per cent saturated, and 100 cm³ of fully saturated blood carries 20 cm³ of oxygen. Calculate the extra volume of oxygen delivered per 100 cm³ of blood because of the shift, and explain why the same shift costs almost nothing at the lungs.
Check your answer
Without the shift the blood unloads 97 − 59 = 38 per cent of its capacity, which is 0.38 × 20 = 7.6 cm³ per 100 cm³. With it, the blood unloads 97 − 31 = 66 per cent, which is 0.66 × 20 = 13.2 cm³. The extra delivery is 5.6 cm³ per 100 cm³ of blood, which is nearly three quarters more oxygen from the same blood at the same partial pressure.
At the lungs the partial pressure is around 12 kPa, and both curves have flattened there, at about 97 per cent normally and about 91 per cent shifted. A horizontal shift on a flat section of curve changes saturation very little. The same horizontal shift on the steep section at 4 kPa lowers saturation by 28 percentage points.
Use the word steep in the explanation. Stating only that the curve 'moves right so more oxygen is released' describes the shift without accounting for why unloading changes greatly and loading changes little.
Comparing haemoglobins: shifts to left and right
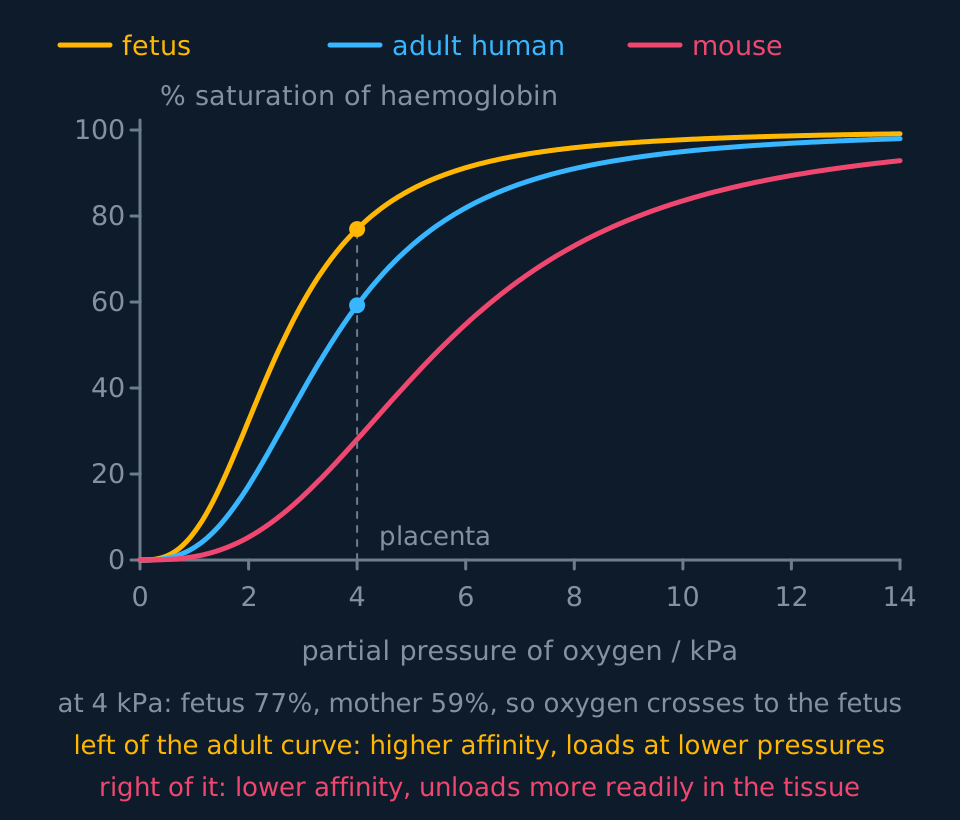
Different species and different life stages have haemoglobins with different affinities for oxygen, and the affinity can be read from the position of the curve. A curve to the left of the human adult curve indicates a higher affinity: the molecule reaches a given saturation at a lower partial pressure. A curve to the right indicates a lower affinity: oxygen dissociates more readily.
Describe the drawing
Three oxygen dissociation curves on the same axes of percentage saturation against partial pressure of oxygen. The fetal curve lies furthest to the left, the adult human curve in the middle, and the mouse curve furthest to the right. A dashed line at the 4 kilopascals of the placenta shows the fetal curve well above the adult one at that pressure, which is how the fetus takes oxygen from its mother's blood.
Fetal haemoglobin lies to the left of adult haemoglobin. A fetus receives oxygen at the placenta from its mother's blood, which by then has already given some up, so the partial pressure available is low. Because the fetal curve lies to the left, fetal haemoglobin associates with oxygen at partial pressures where maternal haemoglobin is dissociating, and by binding the oxygen that arrives it keeps the partial pressure of free oxygen in fetal blood low. Diffusion itself always follows the partial-pressure gradient; the affinity difference is what keeps that gradient in place, so oxygen keeps moving from mother to fetus. Two chains differ from the adult protein, and that difference in primary structure is what changes the affinity.
Llamas and other animals living at high altitude have curves to the left as well, for a related reason: at 4000 m the partial pressure of oxygen in the air is roughly two thirds of the sea-level value, so a haemoglobin reaching full saturation only at 13 kPa would be poorly saturated there. Higher affinity restores saturation at the lungs. The same reasoning applies to the lugworm in its low-oxygen burrow. A diving seal is a different case: it loads at the surface at normal partial pressure, and relies instead on a large blood volume and high myoglobin stores in its muscles.
Small mammals show the opposite shift. A mouse has a large surface area to volume ratio, loses heat rapidly and has a very high metabolic rate per gram, with a heart rate of around 600 beats a minute. Its tissues require rapid oxygen delivery, so its haemoglobin has a curve to the right of the human curve: lower affinity and more ready dissociation. Saturation at the lungs is slightly lower, which is not limiting, because the animal breathes air at normal pressure and the constraint is the rate of dissociation in the tissues.
| Haemoglobin | Curve lies | Affinity | Why it suits the animal |
|---|---|---|---|
| Human fetal | Left of adult | Higher | Takes oxygen from maternal blood at the low partial pressures of the placenta |
| Llama, high altitude | Left | Higher | Still loads well where the partial pressure in the air is low |
| Human adult | Reference | Middling | Loads at the lungs, unloads in tissue |
| Mouse, shrew | Right | Lower | Unloads fast to tissue with a very high metabolic rate |
| Any blood, high CO₂ | Right (Bohr) | Lower | Releases more oxygen exactly where respiration is fastest |
None of these haemoglobins is better than another in general terms. Each is a compromise between association at the partial pressure the animal's lungs, gills or placenta provides and dissociation at the partial pressure its tissues reach.
Myoglobin stores oxygen inside muscle fibres. Like haemoglobin it is a globular protein with a haem group holding an iron(II) ion, but it has a single polypeptide chain, so it binds one oxygen molecule and shows no cooperative binding. Its dissociation curve is hyperbolic rather than sigmoid and lies far to the left of haemoglobin's, so it stays almost saturated at partial pressures where haemoglobin is unloading. It releases its oxygen only when the partial pressure in the muscle falls very low, as in hard exercise, which makes it a store rather than a transporter.
Carbon dioxide transport
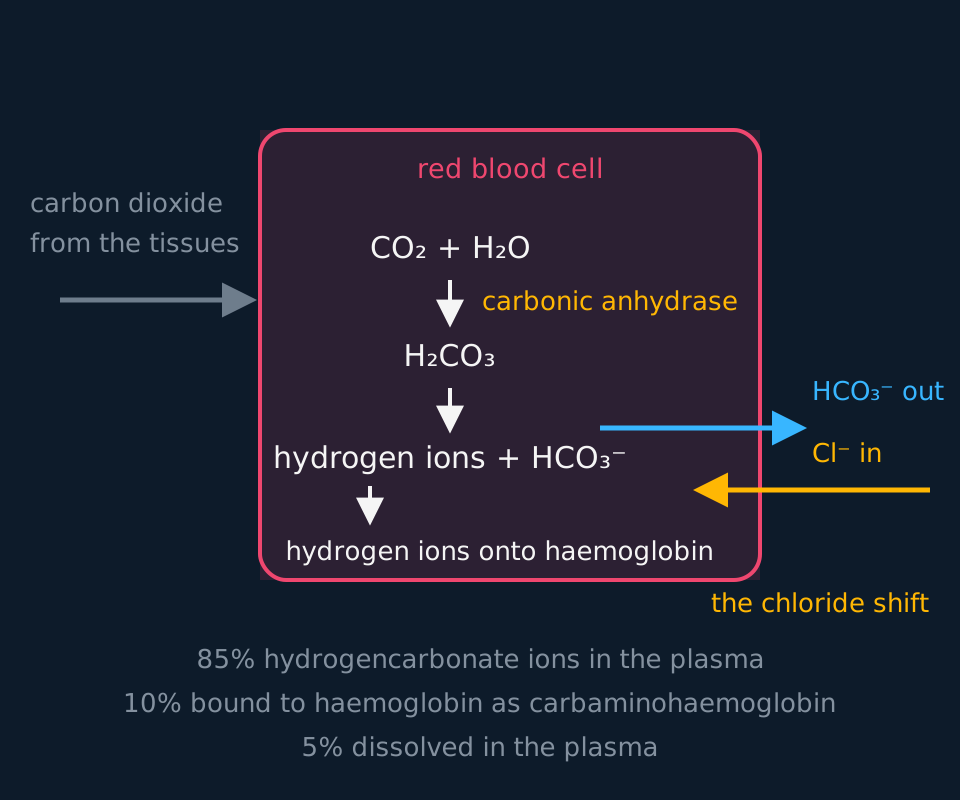
Blood also carries carbon dioxide from the tissues to the lungs, in three forms, and the proportions are examinable: about 85 per cent as hydrogencarbonate ions in the plasma, about 10 per cent bound to haemoglobin as carbaminohaemoglobin, and about 5 per cent simply dissolved. Treat the numbers as approximate: different sources quote slightly different splits, and the split differs between arterial and venous blood, so learn one consistent set and say 'about'. Carbaminohaemoglobin forms when carbon dioxide combines with the amine groups of the polypeptide chains, not with the haem, and deoxygenated haemoglobin takes up more of it.
Describe the drawing
A red blood cell drawn as a rounded box with the plasma outside it. Carbon dioxide from respiring tissue enters, combines with water under carbonic anhydrase to make carbonic acid, and the acid splits into hydrogen ions and hydrogencarbonate ions. The hydrogen ions are shown being taken up by haemoglobin, the hydrogencarbonate ions move out of the cell into the plasma, and chloride ions move the other way in exchange. Below, the three routes carbon dioxide takes are listed with their percentages.
The main route runs like this. Carbon dioxide diffuses from respiring tissue into the plasma and on into red blood cells. There, the enzyme carbonic anhydrase catalyses its reaction with water to form carbonic acid, H₂CO₃. Carbonic acid dissociates into hydrogen ions and hydrogencarbonate ions, HCO₃⁻.
Those two ions then go separate ways. The hydrogencarbonate ions diffuse out of the red blood cell into the plasma, where most of the carbon dioxide is therefore carried. The hydrogen ions stay inside and are taken up by haemoglobin, which acts as a buffer and stops the pH of the cell falling sharply; haemoglobin holding hydrogen ions is called haemoglobinic acid. Those hydrogen ions binding to haemoglobin are what produce the Bohr shift, so carbon dioxide transport and increased oxygen dissociation share the same mechanism.
That movement of ions creates a charge imbalance. Negatively charged hydrogencarbonate ions have left the cell, so the inside would become relatively positive and further loss would stop. Chloride ions move in from the plasma to compensate, one negative ion in for one negative ion out, and the cell stays electrically neutral. This is the chloride shift, and it is not free diffusion through the bilayer: a dedicated exchange protein in the red cell membrane, the chloride-hydrogencarbonate exchanger, swaps the two ions.
At the lungs the whole sequence runs backwards. The partial pressure of carbon dioxide is low, so hydrogencarbonate ions move back into the red blood cells, recombine with hydrogen ions released from haemoglobin, and carbonic anhydrase, which works both ways, regenerates carbon dioxide and water. Carbon dioxide diffuses into the alveoli and is breathed out, the pH rises, the affinity of haemoglobin for oxygen increases again, and oxygen associates with haemoglobin at the alveolar partial pressure.
- Carbonic anhydrase
- The enzyme in red blood cells catalysing the reversible reaction between carbon dioxide and water to form carbonic acid.
- Chloride shift
- The movement of chloride ions into a red blood cell as hydrogencarbonate ions move out, maintaining electrical neutrality.
- Haemoglobinic acid
- Haemoglobin that has taken up hydrogen ions, buffering the contents of the red blood cell.
In the exam
- Quote the numbers for the molecule: four polypeptide chains, four haem groups, four iron(II) ions, four oxygen molecules carried.
- Explain the sigmoid shape by cooperative binding: the first oxygen changes the shape of the molecule so that the next binds more readily.
- A shift to the right means oxygen dissociates more readily at a given partial pressure. State the direction and the consequence together.
- Fetal haemoglobin lies to the left of adult haemoglobin. Placing it on the right reverses the direction of oxygen transfer at the placenta.
- Percentage saturation is not a volume. Where a question supplies a figure such as 20 cm³ of oxygen per 100 cm³ of blood, multiply the percentage difference by it.
- For carbon dioxide transport, name carbonic anhydrase and hydrogencarbonate, and explain the chloride shift in terms of charge balance.
Check yourself
During a sprint, blood leaving a leg muscle is far less saturated with oxygen than blood leaving the same muscle at rest, yet blood leaving the lungs is almost as saturated as ever. Explain both observations.
Answer
A sprinting muscle respires far faster, so the partial pressure of oxygen within it falls, perhaps from around 4 kPa at rest to 2 kPa or lower. On the dissociation curve that region is steep, so a small fall in partial pressure produces a large fall in saturation, and a great deal of oxygen is unloaded.
The muscle is also producing far more carbon dioxide. That carbon dioxide forms carbonic acid, which releases hydrogen ions and lowers the pH of the blood. Hydrogen ions binding to haemoglobin change its shape so that it holds oxygen less tightly, and the dissociation curve shifts to the right. At the same partial pressure the blood is now less saturated still, so even more oxygen is released. The two effects work in the same direction and both are driven by the muscle's own activity.
At the lungs the partial pressure of oxygen is around 12 to 13 kPa, which lies on the flat plateau of the curve. Even the Bohr-shifted curve is above 90 per cent saturated by that partial pressure, so loading is barely affected. Carbon dioxide is also being lost to the alveoli, which raises the pH again and moves the curve back towards its normal position.
The effect of the shift is therefore asymmetric: it changes saturation substantially where the curve is steep and very little where the curve is flat.
Questions
Question 14 marks
Explain why the oxygen dissociation curve of haemoglobin is S-shaped rather than a straight line, and explain why that shape suits the job haemoglobin does.
Mark scheme
- B1 the first oxygen molecule binds with difficulty, because the folded molecule presents its binding sites awkwardly, so the curve is shallow at low partial pressures
- B1 binding changes the quaternary structure so the remaining sites are easier to reach, and the second and third oxygens bind more readily, which is cooperative binding and makes the curve steep
- B1 the curve flattens at the top because only one site is left to find and there is almost no spare capacity above about 90 per cent saturation
- A1 at the alveoli haemoglobin sits on the plateau and loads reliably to about 97 per cent, while in respiring tissue it sits on the steep part where a small fall in partial pressure releases a great deal of oxygen
Question 24 marks
Explain how the Bohr shift increases the oxygen delivered to an exercising muscle, and explain why the same shift costs almost nothing at the lungs.
Mark scheme
- B1 the muscle produces more carbon dioxide, which forms carbonic acid in the blood and releases hydrogen ions, lowering the pH
- B1 hydrogen ions bind to haemoglobin and alter its tertiary and quaternary structure, so it holds oxygen less tightly and the curve shifts to the right
- B1 at the partial pressure found in respiring tissue the curve is steep, so a sideways shift drops the saturation a long way and much more oxygen is unloaded
- A1 at the lungs the partial pressure is around 12 kPa, where the shifted curve has already flattened off and is still over 90 per cent saturated, and blowing off carbon dioxide raises the pH and moves the curve back anyway
Question 34 marks
Describe how carbon dioxide produced by a respiring tissue is carried in the blood, including the chloride shift.
Mark scheme
- B1 carbon dioxide diffuses into the plasma and on into the red blood cells, with about 5 per cent staying dissolved and about 10 per cent binding to haemoglobin as carbaminohaemoglobin
- B1 carbonic anhydrase catalyses its reaction with water to form carbonic acid, which dissociates into hydrogen ions and hydrogencarbonate ions
- B1 hydrogencarbonate ions diffuse out into the plasma, where about 85 per cent of the carbon dioxide is carried, while the hydrogen ions are taken up by haemoglobin as haemoglobinic acid, which buffers them
- A1 chloride ions move into the red blood cell from the plasma to replace the negative charge lost, keeping the cell electrically neutral, which is the chloride shift
Question 44 marks
Compare the saturation of haemoglobin at the two carbon dioxide concentrations at a partial pressure of oxygen of 4 kPa, and compare what this means for oxygen delivery to a respiring muscle.
Mark scheme
- B1 at 0.5 kPa carbon dioxide the haemoglobin is about 60 per cent saturated, and at 1.5 kPa about 40 per cent
- B1 so about 20 per cent more of the haemoglobin has unloaded its oxygen at the higher carbon dioxide concentration, at the same partial pressure of oxygen
- B1 carbon dioxide lowers the affinity of haemoglobin for oxygen, which is the Bohr shift, and shifts the whole curve to the right
- A1 a respiring muscle produces carbon dioxide, so it generates the conditions that make haemoglobin release more oxygen exactly where the oxygen is needed
Question 54 marks
A mouse has a very high metabolic rate for its size and a heart rate of around 600 beats a minute. Its oxygen dissociation curve lies to the right of the human adult curve. Suggest why a curve shifted to the right suits a mouse's tissues, and suggest why the mouse is not disadvantaged by this at its lungs.
Mark scheme
- B1 a curve to the right means lower affinity for oxygen, so oxygen dissociates from haemoglobin more readily at any given partial pressure
- B1 the mouse's very high metabolic rate demands rapid oxygen delivery to its tissues, and lower affinity haemoglobin releases oxygen faster where it is needed
- B1 saturation at the lungs is only slightly reduced by the rightward shift, because the partial pressure of oxygen in the air the mouse breathes is the same as for any other mammal at sea level
- A1 the constraint that matters for a small, fast-metabolising animal is the rate of unloading in the tissues, not the saturation reached at the lungs, so the mouse is not disadvantaged there
Question 64 marks
At rest, a muscle takes up about a third of the oxygen in the blood passing through it; during sprinting, the same muscle can take up four fifths or more. Explain what causes this increase.
Mark scheme
- B1 sprinting muscle respires much faster than resting muscle, so the partial pressure of oxygen within it falls much lower, taking the muscle further down the steep part of the dissociation curve
- B1 the faster respiration also produces far more carbon dioxide, which lowers the pH of the blood in the muscle and shifts the dissociation curve to the right, the Bohr shift
- B1 a lower partial pressure and a rightward shift both reduce the saturation the blood reaches in the muscle
- A1 both effects act in the same direction and both are driven by the muscle's own increased activity, so together they release a far higher fraction of the oxygen in the blood passing through than at rest
Question 74 marks
Blood arriving at a resting muscle is 97 per cent saturated with oxygen, and blood leaving it is 62 per cent saturated. 100 cm³ of fully saturated blood carries 20 cm³ of oxygen. Calculate the volume of oxygen released to the muscle per 100 cm³ of blood, and calculate the volume of oxygen released per litre of blood.
Mark scheme
- M1 the difference in saturation is 97 − 62 = 35 per cent of full capacity
- M1 volume released per 100 cm³ = 0.35 × 20
- A1 7.0 cm³ of oxygen released per 100 cm³ of blood
- A1 70 cm³ (0.070 dm³) of oxygen released per litre (1000 cm³) of blood
Question 83 marks
Blood arriving at a hard-working muscle is 97 per cent saturated with oxygen. Inside the muscle the partial pressure of oxygen falls to 2 kPa, where the dissociation curve gives a saturation of about 17 per cent. Given that 100 cm³ of fully saturated blood carries 20 cm³ of oxygen, calculate the volume of oxygen released to the muscle per 100 cm³ of blood.
Mark scheme
- M1 the fall in saturation is 97 − 17 = 80 per cent of full capacity
- M1 multiply that fraction by the volume carried at full saturation: 0.80 × 20
- A1 16 cm³ of oxygen per 100 cm³ of blood, keeping the percentage and the volume distinct
Question 93 marks
Compare the position of the fetal haemoglobin dissociation curve with that of adult haemoglobin, and compare what each one is adapted to do.
Mark scheme
- B1 the fetal curve lies to the left of the adult curve, so at any given partial pressure fetal haemoglobin is more highly saturated than adult haemoglobin
- B1 fetal haemoglobin therefore has the higher affinity for oxygen and adult haemoglobin the lower
- A1 at the low partial pressure available at the placenta the fetal blood can take oxygen from the maternal blood, whereas adult haemoglobin is adapted to load at the lungs and unload readily in respiring tissue
Question 103 marks
A lugworm lives in a burrow in mud, where the partial pressure of oxygen is low. Suggest where its oxygen dissociation curve lies relative to the human adult curve, and suggest why.
Mark scheme
- B1 its curve lies to the left of the human adult curve
- B1 a curve further to the left means a higher affinity for oxygen, so the pigment is more highly saturated at any given partial pressure
- A1 the only oxygen available in the burrow is at a low partial pressure, so a higher affinity is needed if the pigment is to load properly there
Question 113 marks
Give the partial pressure of oxygen at which each haemoglobin is 50 per cent saturated, and give the difference between them.
Mark scheme
- B1 adult haemoglobin is 50 per cent saturated at about 3.5 kPa, accepting 3.4 to 3.6
- B1 fetal haemoglobin is 50 per cent saturated at about 2.5 kPa, accepting 2.4 to 2.6
- A1 a difference of about 1.0 kPa, consistent with the two values given
Question 123 marks
Explain how the difference between the two curves allows a fetus to take up oxygen from its mother's blood in the placenta.
Mark scheme
- B1 the fetal curve lies above the adult curve at every partial pressure, so fetal haemoglobin has the higher affinity for oxygen
- B1 at the low partial pressure in the placenta (any value on the steep part of the curves, such as 4 kPa), fetal haemoglobin is far more saturated than adult haemoglobin at the same pressure
- A1 so oxygen unloaded by the mother's haemoglobin is taken up by the fetal haemoglobin, and the fetus can saturate its blood at a partial pressure at which the mother's is already unloading
Question 133 marks
A llama living at 4000 m has an oxygen dissociation curve lying to the left of the human adult curve. Explain why this higher affinity suits an animal living at high altitude.
Mark scheme
- B1 at 4000 m the partial pressure of oxygen in the air is only about two thirds of its value at sea level
- B1 a curve to the left means a higher affinity for oxygen, so haemoglobin reaches a high saturation at a lower partial pressure than the human adult curve would
- A1 this restores a high saturation at the lungs despite the lower partial pressure of oxygen available in the air at altitude, whereas a haemoglobin with the human adult's affinity would be poorly saturated there
Question 143 marks
At the lungs, the chemical reactions that carried carbon dioxide in the blood run in reverse. Explain what happens to hydrogencarbonate ions and hydrogen ions there, and explain why this allows carbon dioxide to be breathed out.
Mark scheme
- B1 at the lungs the partial pressure of carbon dioxide is low, so hydrogencarbonate ions move back into the red blood cells from the plasma
- B1 they recombine with hydrogen ions released from haemoglobin, and carbonic anhydrase, which catalyses the reaction in both directions, converts them back into carbon dioxide and water
- A1 the regenerated carbon dioxide diffuses out of the blood into the alveoli, down its concentration gradient, and is breathed out
Question 152 marks
Name the prosthetic group carried by each polypeptide chain of haemoglobin, and state how many molecules of oxygen one haemoglobin molecule carries.
Mark scheme
- A1 the haem group, each holding one iron(II) ion
- A1 four molecules of oxygen in total
Worth remembering
- Haemoglobin is a conjugated globular protein: four chains, four haem groups, four oxygen molecules.
- The curve is sigmoid because binding is cooperative: each oxygen bound makes the next bind more readily.
- Association occurs on the flat upper part of the curve and dissociation on the steep middle section, so saturation at the lungs is consistently high while dissociation in the tissues is sensitive to partial pressure.
- A right shift means oxygen dissociates more readily; a left shift means a higher affinity. Fetal haemoglobin lies to the left of adult.
- Most carbon dioxide is carried as hydrogencarbonate, and the chloride shift maintains electrical neutrality in the red blood cell.
CHECK YOUR PROGRESS
Rate how confident you are with each objective for this lesson. Ratings are saved in this browser, on this device, unless you sign in.
- Describe haemoglobin as a conjugated globular protein and say how many oxygen molecules one molecule carries.
- Explain cooperative binding and use it to account for the sigmoid shape of the dissociation curve.
- Read percentage saturation off a dissociation curve and calculate how much oxygen is unloaded between two partial pressures.
- Explain the Bohr shift and why it is useful in exercising muscle.
- Interpret a curve that lies to the left or to the right of the human adult curve, including fetal, high-altitude and small-mammal haemoglobins.
- Describe how carbon dioxide is carried, including the role of carbonic anhydrase and the chloride shift.
Open the full revision checklist to see every objective in the curriculum in one place.
Practise this lesson
WORKBOOK
The written questions from this topic, on paper with room to work, and a separate book of mark schemes. The 3 questions that are set on a diagram stay on this page, where the diagram can be drawn. Free to use; please do not redistribute or sell.
Used later in Brain imaging, development and learning