Biology › Ecology, populations and environmental change › Succession and environmental change
Succession and environmental change
Succession is directional change in community composition over time. In primary succession, organisms colonise a surface without developed soil; in secondary succession, soil and biological material remain after disturbance. Species alter abiotic and biotic conditions, affecting which species establish later. Management such as grazing, mowing or coppicing can maintain a plagioclimax where this conserves target habitats.
Before this Populations, carrying capacity and competition · Net primary productivity · Field sampling with quadrats and transects · Designing an investigation: correlation and causation · Statistical tests
COMMON MISCONCEPTION
Woodland is the natural state of Britain, so the best thing conservation can do for a piece of land is leave it alone.
Habitats such as chalk grassland, heath, hay meadow and coppiced woodland can depend on continued grazing, cutting or burning. Where local conditions permit, stopping that management may allow scrub and woodland to develop and displace specialist species of the managed habitat.
What you should be able to do
- Describe primary succession from a pioneer species to a climax community, naming what changes at each stage.
- Explain how a pioneer species alters the abiotic environment and why that leads to its own replacement.
- Distinguish primary from secondary succession and explain why secondary succession is faster.
- Explain what a plagioclimax is and why conservation management often maintains one.
- Describe how succession is investigated in the field, including the use of a chronosequence.
- State what a long-term ecological dataset can establish and what it cannot.
- Describe frame, gridded and point quadrats and the ACFOR scale, and choose between them for a given habitat and organism.
- Explain how body temperature, rigor mortis, the extent of decomposition, forensic entomology and the stage of succession are used to estimate the time of death of a mammal.
- Plan a field study of the effect of an abiotic factor on the distribution of a species, choosing random or systematic sampling, the size and number of quadrats, and how each abiotic factor is measured.
- Analyse field data with Spearman's rank, a t-test or chi-squared as the question requires, and compare the population estimates that different sampling methods give.
What succession is, and the model of what drives it
Succession is directional change in the composition of a community over time. In the facilitation model, each community alters the abiotic conditions in ways that suit other species better than itself.
- Succession
- The change over time in the species occupying an area, in which each community alters the environment and makes it more suitable for the community that follows.
- Pioneer species
- The first species to colonise a bare surface, adapted to survive there when almost nothing else can.
- Seral stage
- One identifiable community in the sequence of a succession; the whole sequence is a sere.
- Climax community
- The relatively stable community a succession reaches under the local climate, which persists until something disturbs it.
The species already present change the conditions, and those changed conditions determine which species can establish next. Lichens on bare rock trap dust, hold water and secrete acids that break the rock down, and when they die their remains add organic matter. The result is a thin soil, which a lichen does not require and a moss does, so the moss can then establish where it previously could not.
The mechanism at each handover is competition, usually for light: a taller species shades a shorter one, which then photosynthesises below its compensation point, grows less and is lost from the community. That is why the sequence runs small to large rather than in any other order.
Facilitation, in which each stage makes conditions more suitable for the next, is the model the specifications require, and it fits the classic rock-to-woodland seres. It is one model among several. Succession can also proceed by inhibition, in which early arrivals occupy the ground until disturbance removes them, or by tolerance, in which later species establish under the existing conditions without requiring change by the pioneers; repeated disturbance can redirect a sere. Not every replacement is determined by light; roots compete for water and nutrients as well. Give the facilitation account and state these as its limitations.
Primary succession, stage by stage
Primary succession starts on a surface where no soil and no living thing has been: a new lava flow, a cliff face exposed by a landslide, ground uncovered by a retreating glacier, a sand dune building above the strandline, bare rock exposed by quarrying.

Describe the drawing
Five stages of primary succession animated over the same ground. It begins as bare rock with no soil layer at all. Lichens and mosses appear as a scattering of small discs and a thin band of soil forms beneath them. Grasses and herbs follow, rooted in a soil band several times deeper. Shrubs and small trees replace them, taller and fewer, over deeper soil again. The last stage is oak woodland: five large trees over the deepest soil band of all. A measured arrow at the right and a figure under the ground give the soil depth at each stage, rising from nothing to sixty centimetres.
The pioneers. On bare rock these are lichens, a fungus and an alga together, in which the alga photosynthesises while the fungus grips the rock and holds water, tolerating temperature extremes, drought and near-total absence of nutrients. On a sand dune the pioneer is sea rocket, tolerant of salt spray and burial, and then marram grass, which grows up through accumulating sand and binds it. The functions of a pioneer species, rather than its identity, are what a question requires: stabilising the surface, holding water, and adding the first organic matter on death.
The first soil. Dead pioneers are broken down into humus, which holds water and mineral ions and gives roots something to grip, so mosses and shallow-rooted herbs can follow. Nitrogen is the scarce element on new ground, which is why alders and legumes, both carrying nitrogen-fixing bacteria, turn up early on a glacier foreland or a dune.
Grasses, herbs, then shrubs and small trees. With several centimetres of soil there is water and nutrient enough for larger plants with deeper roots, which add far more organic matter when they die and shade out the mosses that made them possible. Woody plants follow on deeper soil: they cast heavier shade, so the grasses beneath decline, and their bulkier litter changes the soil chemistry again.
The climax. The tallest species that the climate and soil allow come to dominate, and the composition of the community then changes more slowly. It does not become fixed: trees die and gaps open, species turn over, and the climate changes, so describe the climax as relatively stable rather than final. Which community forms depends on climate, soil, disturbance regime and herbivory. In lowland Britain the climax is usually deciduous woodland; in the far north it is coniferous forest or tundra; under low rainfall it may be grassland or scrub, which further time will not convert to forest. Heavy grazing or frequent fire holds a community below the climax the climate would otherwise permit. A climax community is the end point of a particular sere under particular conditions, not a universal end point.
Secondary succession, and why it is quicker
Secondary succession starts on land that has been cleared but still has soil: an abandoned field, a burnt heath, a wood felled by a storm, a garden left alone.
Describe the drawing
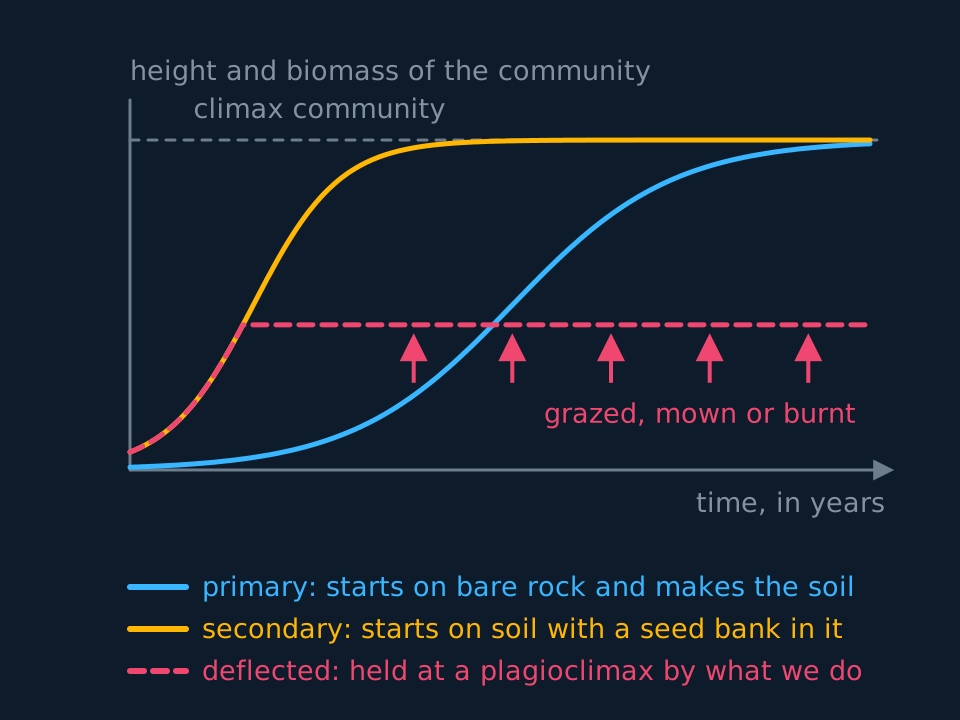
Three curves of community development against time in years. The primary curve starts at nearly nothing, stays low for decades and only then climbs to a dashed line marking the climax community. The secondary curve starts well above zero and reaches the same dashed line in under half the time. The third curve, dashed, follows the secondary one at first and then flattens off well short of the climax, held there by a row of upward arrows marking repeated grazing, mowing or burning.
Secondary succession is faster for three reasons. The soil already exists, so no time is spent on a century of soil formation; it already holds nutrients, water and decomposers; and it holds a seed bank of seeds, roots and rhizomes that survived the clearance, so the plants of middle seral stages appear within a year or two instead of waiting to arrive as windblown seeds or spores. A ploughed field left alone in southern England is scrub within about fifteen years and young woodland within fifty; the same endpoint on bare rock takes centuries.
The end point is often the same, because the climate and the underlying geology are unchanged. There is an exception: if the soil itself was destroyed or the seed bank exhausted, whether by severe erosion, by decades of intensive cultivation or by a change in the climate in the meantime, the community that returns may not be the one that was there before.
What changes as a sere runs
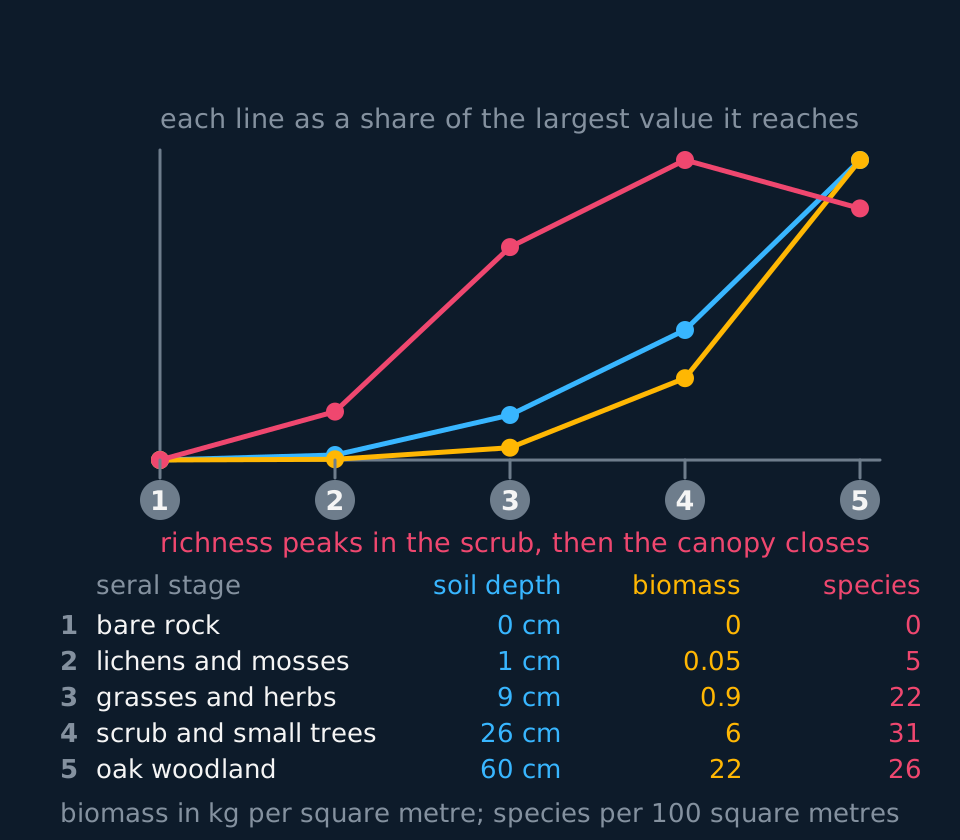
Four quantities change through a sere. Three rise throughout; species richness does not.
Describe the drawing
A line graph with five seral stages along the bottom and three lines above them, each scaled against its own largest value. Soil depth and biomass both climb at every stage and are still climbing steeply at the last one. The number of plant species climbs too, but reaches its highest point at the scrub stage and falls back at the woodland stage. Underneath, the five stages are listed with the soil depth in centimetres, the biomass in kilograms per square metre and the species count each one carries.
Soil depth and organic content rise. Every generation of plants adds litter, and every generation of decomposers turns some of it into humus. The soil also holds more water and more mineral ions as it deepens, so the abiotic environment becomes progressively less hostile.
Biomass rises, and so does productivity. A lichen crust holds a few tens of grams of organic matter per square metre; a mature oak wood holds tens of kilograms. Net primary productivity, meaning gross productivity minus what the producers respire, as set out in the photosynthesis unit, is low in a pioneer community, rises steeply through the middle stages, then falls back somewhat in the climax, because a mature wood has an enormous mass of non-photosynthetic wood to keep alive.
Food webs become more complex. More plant species, more architecture and more litter mean more niches, so more herbivores, predators and decomposers, and a food web with many links can absorb the loss of one species where a two-species chain cannot. That is what makes a climax community more stable.
Species diversity rises, and then often falls. Diversity climbs steeply through the early and middle stages as conditions become tolerable to more species. But a closed canopy casts deep shade and a few dominant trees take most of the light, so many of the light-demanding herbs of the earlier stages are lost and richness at ground level can fall. The community with the most species is frequently not the climax but the stage just before it.
Reading a dune transect
A student runs a belt transect inland from the strandline across a dune system, recording percentage cover with a frame quadrat every ten metres and measuring the organic content of the soil at each station by drying and burning a sample. Organic content rises from 0.4 per cent at 10 m to 8.6 per cent at 200 m, and the number of plant species per quadrat rises from 1 to 17. Explain how these results support the idea of succession, and state the assumption the method depends on.
Show the working
The rise in organic content is the abiotic change succession predicts: pioneer plants such as marram grass die, are decomposed and add humus, so the soil at older stations holds more organic matter, more water and more mineral ions.
The rise in species number follows from that. As the soil develops it becomes tolerable to species that could not survive on bare, dry, salty, nutrient-poor sand, so more species can colonise and the community becomes more diverse.
State the assumption. No change has been observed over time; a spatial gradient has been measured, on the assumption that the far end of the transect is an older stage of the same sere as the near end. That assumption is reasonable on a prograding dune system but is not an observation. Alternative explanations for the gradient should also be given: distance inland also means less salt spray, less burial and less wind.
Deflected succession and the plagioclimax
If something stops a sere before it reaches its climax, and keeps stopping it, the community stabilises at an earlier stage. That arrested community is a plagioclimax, and the process is deflected succession.
- Plagioclimax
- A community held at a stage short of its climax by a repeated interference, usually human or from grazing animals.
- Deflected succession
- Succession that has been diverted from its natural course by an ongoing external factor.
The interference is nearly always grazing, mowing, burning or ploughing. All four remove the tall woody seedlings that would otherwise shade everything else out, and all four must be repeated indefinitely, because the sere resumes the moment they stop.
Britain is largely a country of plagioclimaxes, and conservation exists to protect several of them. Chalk downland grazed by sheep and rabbits can hold several dozen plant species in a square metre, with the orchids and butterflies that depend on them; ungrazed, it becomes hawthorn scrub within a couple of decades and beech woodland after that, and most of those species go. Lowland heath is maintained by grazing and periodic burning, a hay meadow by an annual cut, and coppiced woodland by cutting on a rotation of seven to twenty years, which keeps a patchwork of open and shaded ground that a closed canopy does not offer.
Managing a reserve therefore often means reproducing the interference that created the habitat rather than leaving the site unmanaged. Introducing grazing or reinstating coppicing holds succession at a chosen stage, because the climax that would replace the plagioclimax does not support the species the reserve was designated for. A conservation answer has four parts: name the current stage, the community it would develop into, the species that would be lost, and the management that prevents the change.
Studying succession in the field
Succession runs over decades and centuries and the practical is an afternoon, so ecologists rarely watch it. There are three ways round the problem and each gains something at a cost.
Space for time: the chronosequence. Find a set of sites that differ in age but are otherwise alike, and read the sequence off them. A dune system read as a belt transect inland from the strandline is the classic school version; the ground uncovered by a retreating glacier, where the date of exposure of each band is known, is the classic research one. The cost is the assumption already met above, that the sites really do differ only in age.
Permanent quadrats resurveyed. Mark a fixed area, record it, and come back. Repeated permanent quadrats are one direct way to measure change through time; repeated transects, mapped surveys, photographs and remote sensing can also provide direct temporal evidence. What limits this one is how long somebody has been willing to keep it up. The Park Grass plots at Rothamsted have been cut and recorded since 1856, and a fenced corner of the same farm has been left to succeed since 1882 and is now woodland. Datasets like that are rare, and irreplaceable precisely because they cannot be started retrospectively.
Documentary and stratigraphic evidence. Old maps, estate records and aerial photographs date a clearance. Pollen preserved in peat, counted layer by layer and dated by radiocarbon, records which plants dominated over thousands of years, which is how the post-glacial succession of Britain is known at all.
The field methods belong to the sampling practical and are worth listing because questions ask for them. A belt transect is the right tool where there is a gradient, with quadrats at regular intervals along a line; record percentage cover for plants that grow as a mat and frequency or density where individuals are distinct. Take abiotic measurements at every station too: soil depth with a probe, moisture and organic content by drying and burning a weighed sample, pH, light intensity. A succession answer needs the abiotic change as well as the change in species. Where the question is about a general pattern rather than a gradient, place quadrats at randomly generated coordinates and say how they were generated.
Types of quadrat, and the ACFOR scale
The Edexcel B specification asks for the types of quadrat to be known separately, along with the ACFOR scale.
Frame quadrat. A square frame, commonly 0.5 m × 0.5 m or 1 m × 1 m, in which individuals are counted where they are distinct and percentage cover is estimated where plants grow as a mat.
Gridded quadrat. A frame divided by strings into a grid, usually of 100 small squares, which makes estimates less subjective. Percentage cover is the number of squares more than half filled by a species. Frequency is the number of squares in which the species occurs at all, so a species in 37 of the 100 squares has a local frequency of 37 per cent.
Point quadrat. A frame holding a row of pins, usually ten, lowered one at a time vertically through the vegetation; every species a pin touches counts as a hit. Percentage cover is hits ÷ pins lowered × 100. It is the most objective measure of cover in dense, low vegetation, and because one pin can touch several layers of leaves, the covers of all the species can add up to more than 100 per cent. Small or rare species are often missed unless many pins are dropped.
The ACFOR scale is a quick, subjective estimate of abundance in five steps: Abundant, Common, Frequent, Occasional, Rare. The recorder gives each species a letter for the quadrat or the site. It needs no counting, so it suits a first survey of a large area or organisms such as seaweeds and lichens that are hard to count. But two recorders can give the same quadrat different letters, and categories cannot go into a statistical test that needs measured numbers. Tying each letter to a band of percentage cover before the survey makes it more consistent.
| Technique | Best used for | Main limitation |
|---|---|---|
| Individual counts in a frame quadrat | Distinct individuals, giving density per m² | Impossible for plants that grow as a mat |
| Percentage cover by eye | Mat-forming plants | Subjective; layered vegetation is hard to judge |
| Gridded quadrat | Repeatable cover or frequency | Slower; frequency depends on square size |
| Point quadrat | Dense, low vegetation in layers | Misses small and rare species |
| ACFOR scale | Fast surveys of large areas | Subjective; differs between recorders |
- Point quadrat
- A frame holding a row of pins lowered vertically through vegetation; each species a pin touches is recorded, and hits per pin give percentage cover.
- Gridded quadrat
- A frame quadrat divided into a grid of small squares, usually 100, used to estimate percentage cover or frequency by counting squares.
- ACFOR scale
- A subjective five-point scale of abundance: Abundant, Common, Frequent, Occasional, Rare.
Field practical: quadrats, transects and an abiotic factor
optional
AQA sets required practical 12: investigation into the effect of a named environmental factor on the distribution of a given species. Pearson Edexcel Biology A (9BN0) sets Core Practical 10: Carry out a study on the ecology of a habitat, such as using quadrats and transects to determine distribution and abundance of organisms, and measuring abiotic factors appropriate to the habitat. Biology B (9BI0) Core Practicals 15 and 16 are given below. OCR's PAG3 is Sampling techniques, and Cambridge International 9700 covers the methods under 18.2.
Random or systematic. For a site as a whole, or two sites compared, sample at random: lay two tapes at right angles as axes, generate coordinates with a random number generator, and place a quadrat at each pair. Along a gradient, such as from a wood into a field or up a shore, sample systematically. A line transect records the species touching a tape at regular intervals; a belt transect puts a quadrat at each interval, so it records abundance as well. Run at least three transects from random points along a baseline and take the mean at each distance.
Quadrats. Choose a size that holds several individuals but can still be recorded accurately, often 0.5 m × 0.5 m for short turf, and keep it throughout. To decide how many, plot the running mean of the count or cover against the number of quadrats taken, and stop once further quadrats no longer shift it noticeably. Record density (count ÷ quadrat area) or percentage cover as above. Across a site, frequency is the percentage of quadrats in which the species occurs, so 13 of 20 gives 65 per cent.
Abiotic factors. Take each reading at the quadrat, not once for the site, and take all readings of a factor at the same time of day, since light and temperature change through the day. Light: a light meter at a fixed height, sensor upwards, averaging three readings because cloud changes it. Temperature: a probe at a fixed soil depth, or at a fixed height in shade for air. Soil moisture: weigh a soil sample, dry it in an oven at about 100 °C or below until the mass is constant, and reweigh; water content = (wet mass − dry mass) ÷ wet mass × 100. A hotter oven burns organic matter too and overstates the water. Soil pH: a probe in soil mixed with distilled water.
Choosing the test. Write the null hypothesis before collecting data. For a gradient, with an abiotic reading and an abundance from each quadrat, use Spearman's rank. To compare the mean of one measurement at two sites, use Student's t-test, which assumes roughly normal data with similar spreads; counts often fail that. To test whether two species share quadrats more often than chance predicts, tabulate presence and absence and use chi-squared on counts of quadrats, with (rows − 1)(columns − 1) degrees of freedom.
Light and dog's mercury along a belt transect
The data are idealised. A belt transect runs from under a beech canopy into a clearing, with a quadrat every 5 m. Light intensity at the eight stations was 1.2, 2.0, 3.1, 4.5, 6.8, 9.0, 12.5 and 15.0 kilolux, and the percentage cover of dog's mercury was 64, 70, 52, 40, 31, 18, 22 and 6. Test for a correlation.
Show the working
Null hypothesis: there is no significant correlation between light intensity and the cover of dog's mercury.
Ranks. Light ranks 1 to 8 in station order. Ranked from the lowest, the covers take 7, 8, 6, 5, 4, 2, 3 and 1. No values tie here; tied values would each take the mean of the ranks they share. The differences are −6, −6, −3, −1, 1, 4, 4 and 7, so Σd² = 164.
The statistic. rs = 1 − (6 × 164) ÷ (8 × 63) = 1 − 1.95 = −0.95.
Conclusion. The critical value for n = 8 at p = 0.05 is 0.738, and 0.95, ignoring the sign, exceeds it, so the null hypothesis is rejected: there is a significant negative correlation between light intensity and cover. Moisture, temperature and competition from grasses also change from wood to clearing, so this does not show that light is the cause.
Comparing sampling methods. Edexcel B Core Practical 15: Investigate the effect of different sampling methods on estimates of the size of a population taking into account the safe and ethical use of organisms. For daisies on a playing field, the estimate is mean per quadrat ÷ quadrat area × field area, from random quadrats and again from quadrats placed by eye. Quadrats placed by eye fall where daisies are easy to see, so that estimate is usually too high.
Morphology. Edexcel B Core Practical 16: Investigate the effect of one abiotic factor on the distribution or morphology of one species taking into account the safe and ethical use of organisms. The dependent variable can be a feature of the organism, such as ivy leaf area in shade and in sun. Choose plants at random and take the leaf from the same position on each, so leaf age is controlled.
Limitations. Cover judged by eye differs between recorders; a gridded quadrat and one recorder reduce that. Abiotic readings are a snapshot of one day, which a data logger left on site improves.
Risk assessment. Work in groups within the agreed area, never alone, and check the weather and, on a shore, the tide times. Wear gloves for soil and leaf litter and wash your hands before eating. Drying ovens are hot. Trample as little as possible, put back turned stones as they lay, and return animals where they were found. Your school's risk assessment comes first; where it differs from this page, follow it.
What a long series can and cannot show
Many ecological changes occur over periods longer than a typical research project, so a three-year study can miss a trend or record a run of wet summers as one. Long-term data sets address that.
A long series can establish four things. It can show that a change happened and measure how fast. It can set a baseline, so a later disturbance is measured against something rather than an impression. It can falsify a prediction outright: if a model says a community will recover in twenty years and forty years of data say it has not, the model is wrong. And where the series includes a deliberately untreated plot, it has a control and can do more than describe.
What it cannot do on its own is establish a cause. Two series that move together over fifty years are correlated, and correlation between two things measured over the same period is weak evidence of causation, because almost everything else changed over the same period as well. If nitrogen deposition rose while species richness fell, average temperature and the intensity of grazing changed too, and any of the three could be responsible. Attributing the change requires a mechanism you can state and, ideally, a manipulation: plots that were treated and plots that were not, assigned in advance.
Three further limitations apply. A chronosequence substitutes space for time and inherits every difference between the sites along with their difference in age. A series beginning after a disturbance can make recovery look like a trend, and if each generation treats the state it inherited as normal, the baseline itself drifts. And whether monitoring is representative depends on how the sites were selected, and the selection method is often not reported.
State the claim precisely rather than discounting the data: this community changed in this direction at this rate over this period, this is the proposed mechanism, and this is the evidence that distinguishes it from the alternatives. An evaluation should name the evidence that would discriminate between the competing explanations.
Succession on a body, and the time of death
A forensic pathologist asked when someone died is estimating the post-mortem interval. The Edexcel A specification names five lines of evidence: body temperature, the degree of muscle contraction, the extent of decomposition, forensic entomology and the stage of succession. Each is useful over a different stretch of time and all run faster when it is warm, so the estimate is a range, more reliable where several methods agree.
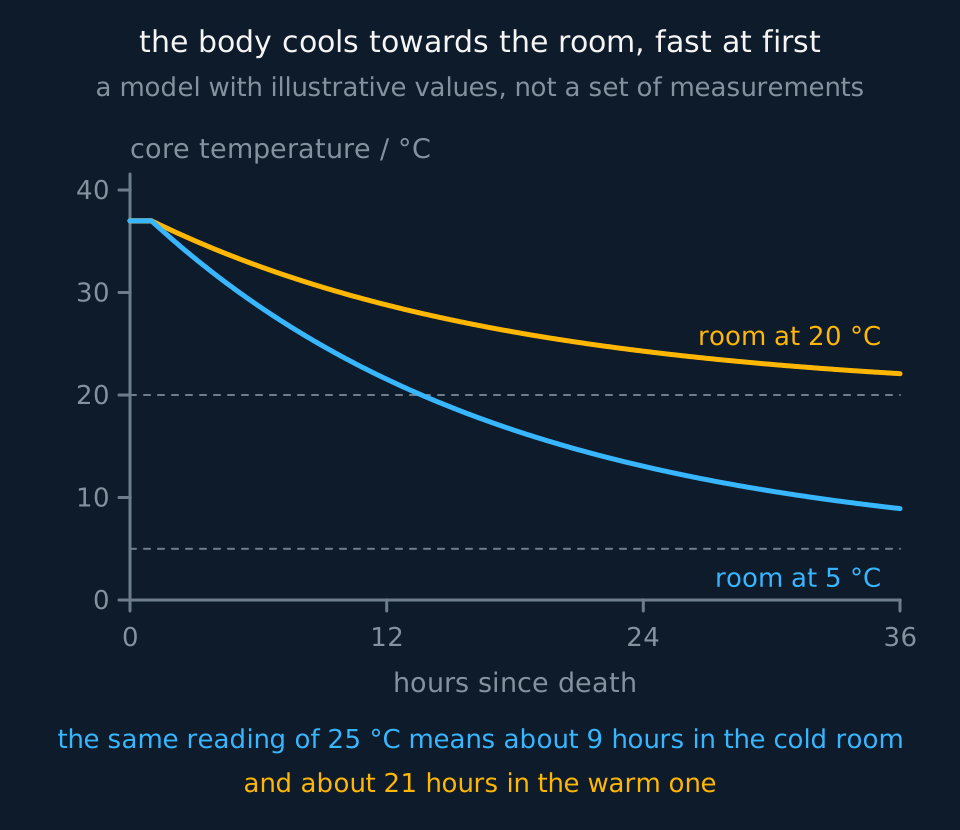
Body temperature. Heat from respiration holds the body's core at about 37 °C. After death the body cools towards the temperature of its surroundings. The core temperature, taken in the rectum or liver, often holds for a plateau of up to a few hours, then falls steeply at first and more slowly as it nears the surroundings. Rules of thumb of about 1 °C an hour are quoted, but the rate depends on body size and fat, since a large body has a smaller surface area to volume ratio; on clothing; on air temperature and movement; on whether the body lies in water, which cools it much faster than air; and on the temperature at death, which fever or hypothermia would have changed. Pathologists use a published chart that corrects for these. Once the body reaches the surrounding temperature, usually within a day or so, the method has nothing more to tell.
Describe the drawing
A graph of core body temperature against hours since death, from nought to thirty-six hours. Both curves start level at 37 degrees for about an hour, then fall, steeply at first and more slowly as they approach the temperature of the room, marked by a dashed line. The cyan curve, for a room at 5 degrees, falls faster and further than the amber curve, for a room at 20 degrees, which levels off just above 20. A note at the foot says that a reading of 25 degrees corresponds to about nine hours in the cold room and about twenty-one in the warm one.
Estimating time since death from a cooling model
A body is found in a room at 15 °C with a core temperature of 28 °C. In a model, the core stays at 37 °C for a plateau of 1 hour, then follows T = Troom + (37 − Troom)e−kt, where t is the time in hours after the plateau and k = 0.06 per hour. The values are illustrative. Estimate the time since death.
Show the working
e−kt = (28 − 15) ÷ (37 − 15) = 13 ÷ 22 = 0.591.
−kt = ln 0.591 = −0.526, so t = 0.526 ÷ 0.06 = 8.8 hours after the plateau, and about 9.8 hours, roughly ten, since death.
Report it as a range. The plateau, k and the temperature at death are all uncertain, and an error of two degrees in the room temperature moves the answer by about an hour.
Degree of muscle contraction: rigor mortis. ATP is needed for relaxation: it detaches myosin heads from actin, and it powers the pumps that return calcium ions to the sarcoplasmic reticulum. After death no oxygen reaches the cells, ATP is made briefly by anaerobic respiration, and then it runs out. Calcium ions leak from the sarcoplasmic reticulum and are not pumped back, so binding sites on actin stay exposed and myosin heads attach; with no ATP to detach them the cross-bridges stay locked and the muscle sets rigid. Stiffness appears first in small muscles such as those of the jaw within a few hours, spreads to the limbs, is fully developed by roughly twelve hours, and passes off over the next day or two as enzymes and then bacteria break down the proteins. It develops faster when warm and after strenuous exertion just before death, which had already used up ATP, and more slowly in the cold.
Extent of decomposition. Decomposition begins with autolysis: enzymes released from the cells' own lysosomes digest them. Bacteria from the gut, many of them anaerobic, then spread through the tissues. They produce a recognisable sequence: greenish discolouration of the abdomen, usually within the first few days in temperate conditions; swelling, called bloat, as bacterial gases build up; blistering and loosening of the skin; then collapse and liquefaction of the soft tissues, leaving bone, hair and dried skin. The order is consistent and the timing is not. These are enzyme-catalysed reactions, so they are much faster when warm, and they are slowed by burial, cold water and dry air, and speeded by insects and wounds.
Forensic entomology is the use of insects to estimate time since death. Blowflies can find a body within minutes to hours and lay eggs in the moist openings of the face and in wounds. The larvae (maggots) feed and grow through three stages called instars, each ended by a moult, then leave the body to pupate in the soil, and adults emerge. The duration of each stage depends on temperature and has been measured in the laboratory for the species that matter. The entomologist identifies the species, finds the oldest stage present, and uses temperatures from the scene and the nearest weather station to work out how long that stage took to reach. One method uses accumulated degree hours: below a base temperature the species does not develop, and each stage needs a fixed total of degrees above the base multiplied by hours. A species needing 1500 degree hours above 10 °C would take, at a steady 16 °C, 1500 ÷ 6 = 250 hours, about ten days; those numbers are for the arithmetic only.
Entomology gives a minimum time since death, because it dates the eggs rather than the death. Blowflies rarely lay at night or in heavy rain, and a body indoors, wrapped or buried may not be reached for days.
Stage of succession. A body is a habitat that changes as it decays, and its community changes in a predictable order: succession. Blowflies are the pioneers on fresh and bloated remains, with flesh flies soon after. Predatory rove beetles and parasitoid wasps follow to feed on the fly larvae. As the remains dry, the flies leave and beetles that eat dried skin and ligament, such as hide beetles, take over, followed by mites and by moths whose larvae eat hair. The groups present show the stage reached over weeks to months, after temperature and rigor have nothing more to say. The sequence varies with region, season and whether the body lies in the open, indoors or buried, so it is read against reference studies made in comparable conditions.
| Evidence | Most useful, roughly | Main source of error |
|---|---|---|
| Body temperature | The first day | Surroundings, body size, clothing, temperature at death |
| Rigor mortis | A few hours to two or three days | Temperature; exertion before death |
| Extent of decomposition | Days to weeks | Temperature, moisture, burial, access by insects |
| Forensic entomology | About a day to several weeks | Gives a minimum; needs accurate temperatures |
| Stage of succession | Weeks to months or longer | Varies with region, season and setting |
- Post-mortem interval
- The time that has passed since death.
- Rigor mortis
- The stiffening of muscles after death, caused by myosin heads staying bound to actin once ATP has run out.
- Autolysis
- The digestion of cells by their own enzymes, released from lysosomes after death.
- Forensic entomology
- The use of insects found on a body, their species and stage of development, to estimate the time since death.
- Instar
- One of the larval stages of an insect, separated from the next by a moult.
In the exam
- State what the pioneer species does to the abiotic environment: 'lichens trap dust and add organic matter when they die, forming a thin soil' rather than 'lichens colonise the rock'.
- Name competition, usually for light, as the mechanism at each replacement: the taller species shades the shorter, which is outcompeted.
- Give at least two reasons secondary succession is faster: the soil, the nutrients, the decomposers and the seed bank are already present.
- Define a climax community as the relatively stable end point for that climate, soil and disturbance regime, rather than as woodland in all cases.
- For a conservation question about a plagioclimax, name the management and what it prevents: 'graze the downland to stop scrub establishing and shading out the herbs'.
- Where a study reads a succession from a transect, state the assumption that distance stands in for time, and name one other factor that varies along the same line.
- Distinguish correlation from cause when evaluating long-term data, and state what would settle it: a control plot, a manipulation, and a stated mechanism.
- For rigor mortis, give both roles of ATP: detaching myosin heads from actin and pumping calcium ions back into the sarcoplasmic reticulum.
- State that forensic entomology gives a minimum time since death, and say why: it dates the eggs, which may have been laid some time after death.
Check yourself
A chalk grassland reserve has been grazed by sheep for two centuries and holds 38 plant species per square metre. Grazing stopped in 1998. By 2010 the reserve held 21 species per square metre and hawthorn scrub covered a third of it; by 2024 the scrub covered most of it and there were 12 species per square metre. Explain the changes, and evaluate the claim that the loss of species was caused by the end of grazing.
Answer
Grazing was deflecting the succession. Sheep eat the seedlings of hawthorn and other woody plants, so the sere was held at a grassland stage, a plagioclimax, and the many small light-demanding herbs of chalk grassland could persist because nothing shaded them.
Once grazing stopped, the woody seedlings survived and grew. Hawthorn is taller than the herbs, so it shades them; a shaded herb photosynthesises below its compensation point, cannot make enough organic matter to grow or set seed, and is outcompeted. That is why richness fell as scrub cover rose, and why it fell further as the scrub closed over.
The succession will continue if nothing is done: scrub gives way to woodland, whose ground flora is quite different from and poorer than chalk grassland. Restoring the reserve means clearing the scrub and reintroducing grazing, and the herbs will only return if a seed bank survives in the soil.
On the evaluation: the evidence is good but it is not by itself conclusive, because it is a single site with no control. The change is correlated in time with the end of grazing, and there is a stated mechanism, shading by scrub, with an observable intermediate step, which is much stronger than bare correlation. But other things changed between 1998 and 2024, including the climate and probably the nitrogen deposited from the air, and either could reduce richness on chalk grassland independently.
A comparison would discriminate between the explanations: a similar area of the same grassland where grazing continued. If richness were maintained there and fell here, the end of grazing is supported as the cause. Name the evidence that would discriminate rather than concluding that more research is needed.
Questions
Question 15 marks
A moorland has been monitored at the same twelve sites since 1975. Over that period the nitrogen deposited from the air has risen and the number of plant species per square metre has fallen. A report concludes that nitrogen deposition caused the loss of species. Evaluate that conclusion.
Mark scheme
- B1 for: the series is long, so a genuine trend can be separated from a run of unusual years, and the fall is measured against a baseline recorded before it began rather than against an impression
- B1 for: a mechanism can be stated. Added nitrogen favours a few vigorous grasses which grow tall and shade the smaller species out, and that is the same competition for light that drives succession, so the claim is more than bare correlation
- B1 against: the two series were measured over the same period, and almost everything else changed over that period as well, so temperature, rainfall, grazing intensity and burning are alternative explanations that have not been excluded
- B1 against: the question does not say how the twelve sites were chosen, so they may not be a random sample of the moor, and there is no untreated plot to compare them against
- B1 judgement: the monitoring cannot establish the cause on its own; what would settle it is a manipulation, with plots assigned in advance to receive added nitrogen and control plots that do not, recorded by the same method. The honest claim from the monitoring alone is that richness fell at this rate over this period, with nitrogen deposition as one candidate cause
Question 25 marks
Describe how you would investigate the effect of light intensity on the distribution of bluebells from inside a wood out into the neighbouring field.
Mark scheme
- B1 lay a belt transect from inside the wood out into the field, across the change in light, with a quadrat at regular intervals along it
- B1 use quadrats of the same size throughout and record the percentage cover, or the number, of bluebells in each
- B1 measure light intensity at each quadrat with a light meter held at the same height, taking all readings over a short period at the same time of day and using a mean of repeat readings
- B1 repeat with further transects started from randomly chosen points along the edge of the wood, and calculate the mean abundance at each distance
- B1 state a null hypothesis and use Spearman's rank correlation between light intensity and abundance, comparing the value with the critical value at p = 0.05
Question 34 marks
Explain why the community occupying a bare rock surface changes in a predictable direction rather than at random.
Mark scheme
- B1 each community alters the abiotic conditions of the place it occupies, and alters them in ways that suit some other species better than itself
- B1 lichens trap dust, hold water and secrete acids that break the rock down, and their remains add organic matter, so a thin soil forms, which is what a moss needs and a lichen does not
- B1 as the soil deepens it holds more water and more mineral ions, so larger plants with deeper roots can establish and add far more organic matter when they die
- B1 the mechanism at each handover is competition, usually for light: a taller species shades a shorter one, which then photosynthesises below its compensation point, grows less and is lost from the community, which is why the sequence runs small to large
Question 44 marks
Explain what a plagioclimax is, and explain why a nature reserve on chalk downland is grazed rather than fenced and left alone.
Mark scheme
- B1 a plagioclimax is a community held at a stage short of its climax by a repeated interference, usually grazing, mowing, burning or ploughing
- B1 grazing animals eat the seedlings of hawthorn and other woody plants, so the sere is held at a grassland stage instead of running on to scrub and then woodland
- B1 the many small light-demanding herbs of chalk grassland, and the orchids and butterflies that depend on them, persist only while nothing is shading them
- B1 if the grazing stops, woody seedlings survive and grow and shade the herbs, which then photosynthesise below their compensation point and are lost, so richness falls
Question 54 marks
Compare a pioneer community with a climax community, referring to species richness, net primary productivity and stability.
Mark scheme
- B1 a pioneer community holds very few species, tolerant of extreme abiotic conditions, whereas a climax community holds far more species in a complex, structured community
- B1 net primary productivity is low in a pioneer community, whereas it is higher in a climax community, though not as high as in the fastest-growing middle stages, because a mature climax community carries a large mass of non-photosynthetic tissue to support
- B1 biomass and soil organic content are very low in a pioneer community and high in a climax community, since each successive generation has added litter that decomposers have converted into humus
- B1 a climax community is more stable than a pioneer community, because its more complex food web, with many links between species, can absorb the loss of one species where a simple pioneer community cannot
Question 64 marks
Describe how ecologists use a chronosequence to study succession, and describe the assumption on which the method depends.
Mark scheme
- B1 a set of sites that differ in age but are otherwise similar is identified, such as stations at increasing distance inland along a transect from a dune's strandline
- B1 each site is treated as representing a different stage of the same sere, so the sequence of stages is read from the differences between the sites rather than watched over time at any one of them
- B1 abiotic and biotic measurements, such as soil organic content and the number of plant species present, are recorded at each site and compared along the sequence
- B1 the method assumes that the sites differ only in age and not in some other factor, such as distance inland also changing exposure to salt spray, which is an assumption rather than an observation
Question 74 marks
A landowner argues that the best thing conservation can do for a species-rich chalk grassland reserve is to fence it off and leave it alone, since deciduous woodland is the natural climax vegetation of lowland Britain. Discuss this argument.
Mark scheme
- B1 for: leaving land unmanaged requires no continued labour or cost, and allows succession to proceed towards the community that the local climate and soil would naturally support
- B1 for: it is true that deciduous woodland is the usual climax vegetation of lowland Britain, so leaving the site alone would eventually produce a stable, self-sustaining community
- B1 against: the grassland's high species richness, and the orchids and butterflies associated with it, persist only because grazing has held the site at a plagioclimax; without continued management, woody seedlings survive and shade out the light-demanding herbs, and most of those species are lost as scrub and then woodland develop
- B1 judgement: leaving the reserve alone is a management decision with a foreseeable consequence rather than the absence of one, so if the reserve was designated to conserve the grassland species, active management such as grazing is needed to hold the community at that stage
Question 84 marks
The table shows the age and the percentage organic content of the soil at four sites along a chronosequence on ground exposed by a retreating glacier, constructed for this question rather than measured. Calculate the mean rate of increase in organic content between the 40-year site and the 120-year site, giving the unit.
| Age of site / years | Organic content of soil / % |
|---|---|
| 5 | 0.3 |
| 40 | 1.8 |
| 120 | 6.6 |
| 300 | 9.4 |
Mark scheme
- M1 mean rate of increase = change in organic content ÷ change in age, using the 40-year value of 1.8% and the 120-year value of 6.6%
- M1 change in organic content = 6.6 − 1.8 = 4.8%, over a change in age of 120 − 40 = 80 years
- A1 4.8 ÷ 80 = 0.060
- A1 about 0.060% of organic content per year, with the unit given
Question 94 marks
Explain why the muscles of a mammal become rigid a few hours after death.
Mark scheme
- B1 after death respiration stops being aerobic because the cells receive no oxygen, and ATP runs out once anaerobic respiration ends
- B1 without ATP, calcium ions are not pumped back into the sarcoplasmic reticulum, so they stay in the sarcoplasm and the binding sites on actin remain exposed
- B1 myosin heads bind to actin, forming cross-bridges
- B1 ATP is needed to detach the myosin heads from actin, so the cross-bridges cannot break and the muscle is locked rigid
Question 104 marks
A body is found in a room at 10 °C with a core temperature of 25 °C. In a model of cooling, the core stays at 37 °C for a plateau of 2 hours and then follows T = Troom + (37 − Troom)e−kt, where t is the time in hours after the plateau and k = 0.05 per hour. Calculate the estimated time since death.
Mark scheme
- M1 e−kt = (25 − 10) ÷ (37 − 10) = 15 ÷ 27 = 0.556
- M1 −0.05t = ln 0.556 = −0.588
- A1 t = 0.588 ÷ 0.05 = 11.8 hours after the plateau
- A1 time since death = 11.8 + 2 = 13.8 hours, about 14 hours
Question 114 marks
In an exercise with invented values, a blowfly species needs 1800 degree hours above a base temperature of 10 °C to develop from egg to third-instar larva. Third-instar larvae are the oldest stage on a body. Calculate the minimum time since death if the mean temperature at the scene was 19 °C, and again if it was 14 °C.
Mark scheme
- M1 at 19 °C, degree hours gained each hour = 19 − 10 = 9
- A1 1800 ÷ 9 = 200 hours, about 8.3 days
- M1 at 14 °C, degree hours gained each hour = 14 − 10 = 4
- A1 1800 ÷ 4 = 450 hours, about 18.8 days
Question 124 marks
Describe the succession of insects on a body exposed on land, and describe how it is used to estimate the time since death.
Mark scheme
- B1 blowflies arrive first, within minutes to hours, and lay eggs in the moist openings and wounds; flesh flies follow
- B1 predatory beetles and parasitoid wasps arrive to feed on the fly larvae
- B1 as the remains dry, beetles that eat dried skin and ligament, such as hide beetles, replace the flies, followed by mites and moths that eat hair
- B1 the groups present show which stage the body has reached, compared with reference data for the same region, season and setting, giving an estimate over weeks to months
Question 134 marks
A body is found outdoors in summer. Its core temperature is the same as the air temperature, the limbs are no longer rigid, the abdomen is swollen with gas, and blowfly larvae in their second and third instars are present but there are no pupae. Suggest an approximate time since death, using each piece of evidence.
Mark scheme
- B1 core temperature equal to the surroundings means the body has finished cooling, so death was more than about a day ago
- B1 rigor has developed and passed off, which takes a day or two or more, especially in warm weather
- B1 bloating shows bacterial decomposition is under way but the soft tissues have not collapsed, which fits days rather than weeks
- B1 third-instar larvae with no pupae show the oldest insects have not finished feeding, giving a minimum of several days at summer temperatures; together the evidence suggests roughly three days to a week
Question 144 marks
A student ran a belt transect from a dry bank down into a wet hollow. In each of eight quadrats she measured the water content of the soil and counted the soft rush plants. The data are idealised. Water content (%): 12, 18, 21, 25, 30, 34, 41, 47. Number of soft rush plants: 1, 3, 2, 6, 5, 9, 8, 12. Use rs = 1 − [6Σd² ÷ n(n² − 1)] to calculate Spearman's rank correlation coefficient, and use the critical value of 0.738 for n = 8 at p = 0.05 to write a conclusion.
Mark scheme
- M1 both variables ranked, giving squared rank differences of 0, 1, 1, 1, 1, 1, 1 and 0, so Σd² = 6
- M1 rs = 1 − (6 × 6) ÷ (8 × 63) = 1 − 36 ÷ 504
- A1 rs = 0.93; accept 0.929
- B1 0.93 is greater than 0.738, so the null hypothesis is rejected: there is a significant positive correlation between soil water content and the number of soft rush plants
Question 154 marks
Two students estimated the number of daisies on a playing field 60 m by 40 m, each using twenty quadrats of 0.25 m². One placed the quadrats at random coordinates and counted 46 daisies in total. The other placed each quadrat where he could see daisies and counted 130 in total. The data are idealised. Calculate the estimate of the population from the random quadrats, and explain which estimate is more valid.
Mark scheme
- M1 mean of 46 ÷ 20 = 2.3 daisies per quadrat, so a density of 2.3 ÷ 0.25 = 9.2 daisies per m²
- A1 9.2 × (60 × 40) = 9.2 × 2400 = 22 080, about 22 000 daisies
- B1 the quadrats placed by eye fell where daisies were easy to see, so they over-represent dense patches and overestimate the population
- B1 the random estimate is more valid, because every part of the field had an equal chance of being sampled, so the sample is not biased by the observer's choice
Question 163 marks
Explain why secondary succession on an abandoned field reaches woodland far sooner than primary succession on bare rock.
Mark scheme
- B1 the soil already exists, so no part of the sequence has to be spent building it from a bare surface, which is the slowest step of all
- B1 that soil already holds nutrients, water and decomposers, so conditions are tolerable to larger plants from the start
- B1 it also holds a seed bank of seeds, roots and rhizomes that survived the clearance, so the plants of middle seral stages appear within a year or two rather than waiting to arrive as windblown seeds or spores
Question 173 marks
A chalk grassland held 38 plant species per square metre while it was grazed. Twenty-six years after grazing stopped it held 12 species per square metre. Calculate the percentage decrease in the number of species per square metre.
Mark scheme
- M1 percentage change = (change ÷ original value) × 100, and the original value is the grazed figure of 38
- M1 the decrease is 38 − 12 = 26 species per square metre, so 26 ÷ 38 = 0.684
- A1 a decrease of 68.4 per cent, or 68 per cent to two significant figures
Question 183 marks
Outline the sequence of plant communities in primary succession on a sand dune, from bare sand near the strandline to a stage with shrubs.
Mark scheme
- B1 sea rocket colonises the bare, mobile sand nearest the strandline, tolerating salt spray and occasional burial by blown sand
- B1 marram grass follows, growing up through accumulating sand and binding it, with nitrogen-fixing plants such as legumes also establishing early because nitrogen is scarce on new, undeveloped ground
- B1 as organic matter and nutrients accumulate in the developing soil, grasses and herbs are followed by shrubs, in a sequence of increasing height and decreasing exposure to salt and burial
Question 193 marks
Explain the difference between the facilitation model of succession and the inhibition model, and state which of the two describes the classic sere from bare rock to woodland.
Mark scheme
- B1 in the facilitation model, each community alters the abiotic conditions of the place it occupies in ways that make those conditions more suitable for the species that replace it
- B1 in the inhibition model, early-arriving species occupy the ground and resist replacement, so a later species establishes only once disturbance removes the earlier occupants, rather than because conditions have been made more suitable for it
- B1 the facilitation model describes the classic sere from bare rock to woodland, in which pioneers such as lichens begin the soil that later species need; it is one model among several, since not every replacement in nature is one species preparing the ground for the next
Question 203 marks
Alders and legumes, both of which carry nitrogen-fixing bacteria in root nodules, are often among the first shrubs to establish on bare ground left by a retreating glacier. Suggest why.
Mark scheme
- B1 nitrogen is the scarce element on newly exposed ground, since none has yet been added by the ammonification of dead organic matter
- B1 a plant carrying nitrogen-fixing bacteria in root nodules can obtain nitrogen from the atmosphere rather than depending on nitrate already present in the thin, undeveloped soil
- B1 this gives it access to a resource other early colonists lack, so it can establish and grow where a plant without that association would be limited by the shortage of nitrogen
Question 213 marks
Explain why the net primary productivity of a climax woodland is somewhat lower than that of the middle stages of succession that preceded it, even though the climax holds far more biomass.
Mark scheme
- B1 net primary productivity is gross photosynthesis minus the respiration of the producers themselves, not simply the rate of photosynthesis
- B1 a mature woodland's producers include an enormous mass of non-photosynthetic tissue, mostly the wood of trunks, branches and roots, which is living and must be kept alive by respiration even though it captures no light
- B1 that respiration subtracts a large amount from gross photosynthesis, so despite having the greatest biomass of any stage, the climax does not have the greatest net primary productivity, which instead comes at a stage where growth is fast and there is less non-photosynthetic tissue to support
Question 223 marks
A nature reserve has resurveyed the same twenty permanent quadrats every five years since 1960, to track succession directly. Suggest one advantage this method has over a chronosequence, and suggest one limitation of the method itself.
Mark scheme
- B1 because the same quadrats are followed through time, the sites are guaranteed to differ only in time and not in some other factor, unlike a chronosequence, which assumes without observing it that its sites differ only in age
- B1 the record only continues for as long as somebody keeps returning to survey the same quadrats, so a change of staff, funding or ownership can end a series decades before its full value is realised
- B1 repeated visits to mark and record the same quadrats can themselves disturb the ground being studied, for example by trampling, which is a source of change the method introduces rather than observes
Question 233 marks
A student lowers the pins of a point quadrat 50 times in a grassland. Cocksfoot grass is hit 35 times, red fescue 18 times and white clover 12 times. Calculate the percentage cover of each species, and explain why the three values add up to more than 100 per cent.
Mark scheme
- M1 percentage cover = number of hits ÷ number of pins lowered × 100
- A1 cocksfoot 35 ÷ 50 × 100 = 70 per cent; red fescue 36 per cent; white clover 24 per cent
- B1 a pin can touch more than one species where leaves overlap in layers, so one pin can give several hits and the total, 130 per cent, exceeds 100
Question 243 marks
Explain one advantage and two disadvantages of using the ACFOR scale to compare the abundance of seaweeds on two rocky shores.
Mark scheme
- B1 advantage: it is quick and needs no counting or cover estimate, so a large area or many quadrats can be surveyed, which suits seaweeds that are hard to count
- B1 disadvantage: it is subjective, so two recorders may give the same quadrat different letters and results from the two shores may not be comparable
- B1 disadvantage: it gives categories rather than measured numbers, so the difference between the shores cannot be analysed with a statistical test that needs measured data
Question 253 marks
Suggest the most suitable sampling technique for each of the following, giving a reason each time: the cover of grasses in a dense, layered meadow; the number of limpets on a rock face; the abundance of lichens on the trunks of trees across a large woodland.
Mark scheme
- B1 point quadrat, because grasses grow as a mat with overlapping layers and pins give an objective measure of cover
- B1 individual counts in a frame or gridded quadrat, because limpets are distinct individuals that can be counted
- B1 the ACFOR scale, because lichens are hard to count and the area is large, so a quick subjective estimate allows many trees to be surveyed
Question 263 marks
Two bodies with the same core temperature are found at the same time. One is a large adult found clothed indoors; the other is a small adult found lightly dressed in a cold stream. Explain why they are unlikely to have died at the same time.
Mark scheme
- B1 a body cools towards the temperature of its surroundings, and cools faster the colder they are and in water, which conducts heat away much faster than air
- B1 the small body has a larger surface area to volume ratio and less insulating fat, and light clothing insulates less, so it loses heat faster
- B1 so the body in the stream reached the same temperature much sooner, meaning it died more recently than the body indoors
Question 272 marks
State what is meant by a pioneer species, and state what pioneers do to a bare surface.
Mark scheme
- B1 the first species to colonise a bare surface, adapted to survive there when almost nothing else can
- B1 they stabilise the surface and hold water, and when they die their remains add the first organic matter, so a thin soil begins to form
Question 282 marks
Explain why forensic entomology gives a minimum time since death rather than the time of death itself.
Mark scheme
- B1 it measures the age of the oldest insects, which dates when the eggs were laid rather than when the person died
- B1 flies may not lay eggs for some time after death, for example at night, in heavy rain, or if the body was indoors, wrapped or buried
Worth remembering
- In the facilitation model, succession proceeds because each community changes the abiotic environment in ways that suit other species better than itself. Inhibition and tolerance are alternative models.
- Pioneers stabilise the surface, hold water and add the first organic matter when they die.
- Each replacement in the model results from competition, usually for light.
- Secondary succession is faster because soil, nutrients, decomposers and a seed bank are already present.
- Soil depth and biomass rise to the climax; species richness often peaks at the stage before it.
- A plagioclimax is a community held below its climax by repeated management, and much British conservation maintains one.
- A long dataset can measure a change and falsify a prediction; only a control or a manipulation can establish its cause.
- A point quadrat gives cover as hits per pin; a gridded quadrat gives cover or frequency from counted squares; ACFOR is quick and subjective.
- Time of death: body temperature for the first day, rigor for hours to days, then decomposition, insect development and succession.
- Rigor mortis sets in when ATP runs out and myosin heads cannot detach from actin.
CHECK YOUR PROGRESS
Rate how confident you are with each objective for this lesson. Ratings are saved in this browser, on this device, unless you sign in.
- Describe primary succession from a pioneer species to a climax community, naming what changes at each stage.
- Explain how a pioneer species alters the abiotic environment and why that leads to its own replacement.
- Distinguish primary from secondary succession and explain why secondary succession is faster.
- Explain what a plagioclimax is and why conservation management often maintains one.
- Describe how succession is investigated in the field, including the use of a chronosequence.
- State what a long-term ecological dataset can establish and what it cannot.
- Describe frame, gridded and point quadrats and the ACFOR scale, and choose between them for a given habitat and organism.
- Explain how body temperature, rigor mortis, the extent of decomposition, forensic entomology and the stage of succession are used to estimate the time of death of a mammal.
- Plan a field study of the effect of an abiotic factor on the distribution of a species, choosing random or systematic sampling, the size and number of quadrats, and how each abiotic factor is measured.
- Analyse field data with Spearman's rank, a t-test or chi-squared as the question requires, and compare the population estimates that different sampling methods give.
Open the full revision checklist to see every objective in the curriculum in one place.
Practise this lesson
WORKBOOK
The written questions from this topic, on paper with room to work, and a separate book of mark schemes. The question that is set on a diagram stays on this page, where the diagram can be drawn. Free to use; please do not redistribute or sell.
Used later in Managing ecosystems sustainably