Biology › Photosynthesis and primary productivity › Limiting factors and primary productivity
Limiting factors and primary productivity
At any moment one factor holds the rate of photosynthesis back, and the shape of a rate graph identifies which. The same principle governs glasshouse management, the compensation point at which photosynthesis equals respiration, and the productivity figures that explain why energy transfer limits the length of a food chain.
Before this The light-dependent stage · The Calvin cycle · Respiration and its rate · Factors affecting enzyme rate
COMMON MISCONCEPTION
Plants photosynthesise during the day and respire at night.
Every living plant cell respires day and night, and root cells never see light at all. What changes with the light is photosynthesis, which in daylight usually outruns respiration, so what looks like a switch is a change in the net exchange of gases.
What you should be able to do
- Identify the limiting factor from any region of a rate graph and justify the choice.
- Explain what changes the gradient of such a graph and what changes the height of the plateau.
- Use the principle of limiting factors to explain what a commercial grower controls, and why.
- Define the compensation point and explain what it means for a plant's carbon balance.
- Distinguish gross from net primary productivity and quote productivity in the correct units.
- Calculate the percentage of energy transferred between trophic levels and explain why it is small.
- Describe how biomass is measured as dry mass and its energy found by calorimetry, and use N = I − (F + R) for the net production of a consumer.
- Describe how to measure the rate of photosynthesis of a whole plant, and how light intensity, carbon dioxide, temperature and wavelength are each varied.
- Use the inverse square law to compare the light intensity from a lamp at different distances.
- Compare pyramids of numbers, biomass and energy, with an advantage and a disadvantage of each.
- Explain how farming raises the efficiency of energy transfer, by simplifying food webs to reduce energy losses to non-human food chains and by reducing respiratory losses within a human food chain.
One factor at a time
A process made of many steps runs at the pace its slowest step allows. Photosynthesis needs light energy, carbon dioxide as raw material and a workable temperature for its enzymes, and at any moment one of the three is holding the rate back. That one is the limiting factor: the factor in shortest supply, and the only one whose increase would speed things up.
Describe the drawing
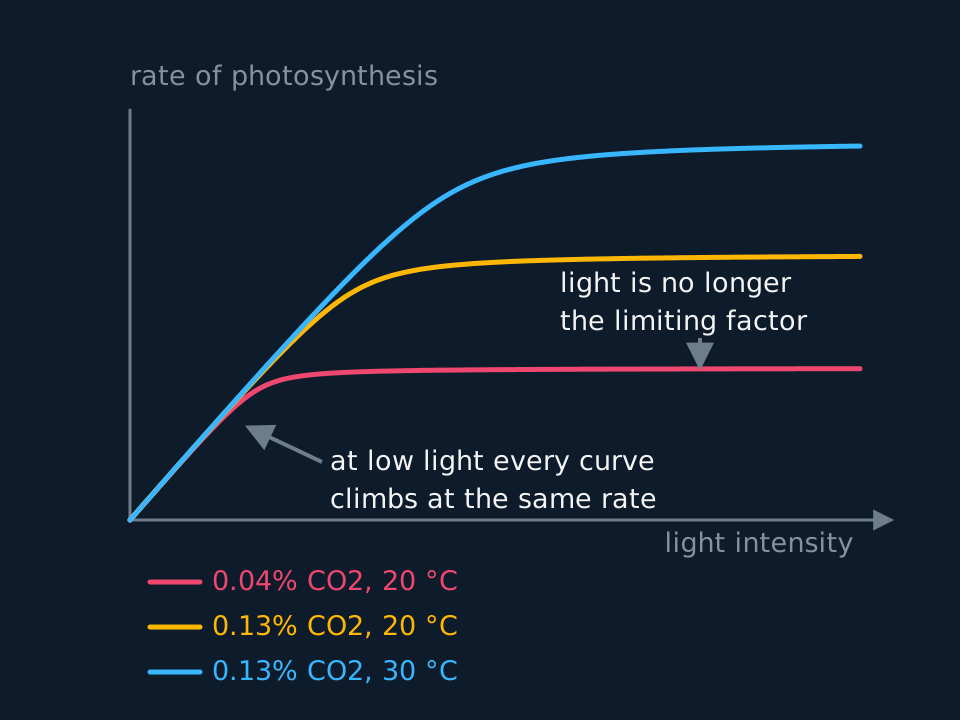
A graph of the rate of photosynthesis against light intensity carrying three curves. All three rise together from the origin along the same steep straight line while the light is low, then peel apart and flatten off at three different heights: lowest at the low carbon dioxide concentration, higher when the carbon dioxide is raised, and higher still when the temperature is raised as well. Annotations mark the shared gradient at low light and the levelling off at high light, and a key names the conditions for each curve.
That overlap on the left is the whole argument. Where the curves coincide the rate depends only on how much light there is, so light is limiting and the extra carbon dioxide is doing nothing, because there is not enough energy to use what is already there. Where the curves flatten and separate, more light no longer helps, and whatever is different between the curves is what is now limiting.
Read a plateau carefully. A plateau does not mean the plant has hit some absolute maximum; it means the factor on the x-axis has stopped being the one that matters. Raise something else and the plateau moves up. If raising carbon dioxide lifts the plateau, carbon dioxide was limiting there; if raising the temperature lifts it further, temperature was limiting after that.
Temperature behaves differently from the other two. Light intensity and carbon dioxide concentration feed the reaction; temperature affects the enzymes catalysing it. So a temperature graph rises to an optimum and then falls, because beyond roughly 40 °C the enzymes of the Calvin cycle, rubisco among them, begin to denature. Across the range used in these experiments the light and carbon dioxide curves flatten out rather than falling, although photoinhibition can reduce the rate at very high irradiance.
- Limiting factor
- The factor, of all those a process requires, whose shortage is holding the rate back at that moment.
- Plateau
- The region of a rate graph where increasing the factor on the horizontal axis no longer increases the rate, because something else has become limiting.
Measuring the rate in a whole plant
Curves like these come from experiments, and on a school bench the experiment uses an aquatic plant or algae. What is measured is the gas the plant exchanges with the water around it: oxygen given off, or carbon dioxide taken up. Either way it is the net rate, photosynthesis minus the plant's own respiration, because the plant respires throughout. Cambridge International asks for investigations with whole plants, aquatic plants included; OCR asks for practical investigations of the factors affecting the rate; AQA suggests aquatic plants, algae or immobilised algal beads; and Pearson Edexcel's Biology B core practical 10, on wavelength, can use the same apparatus.
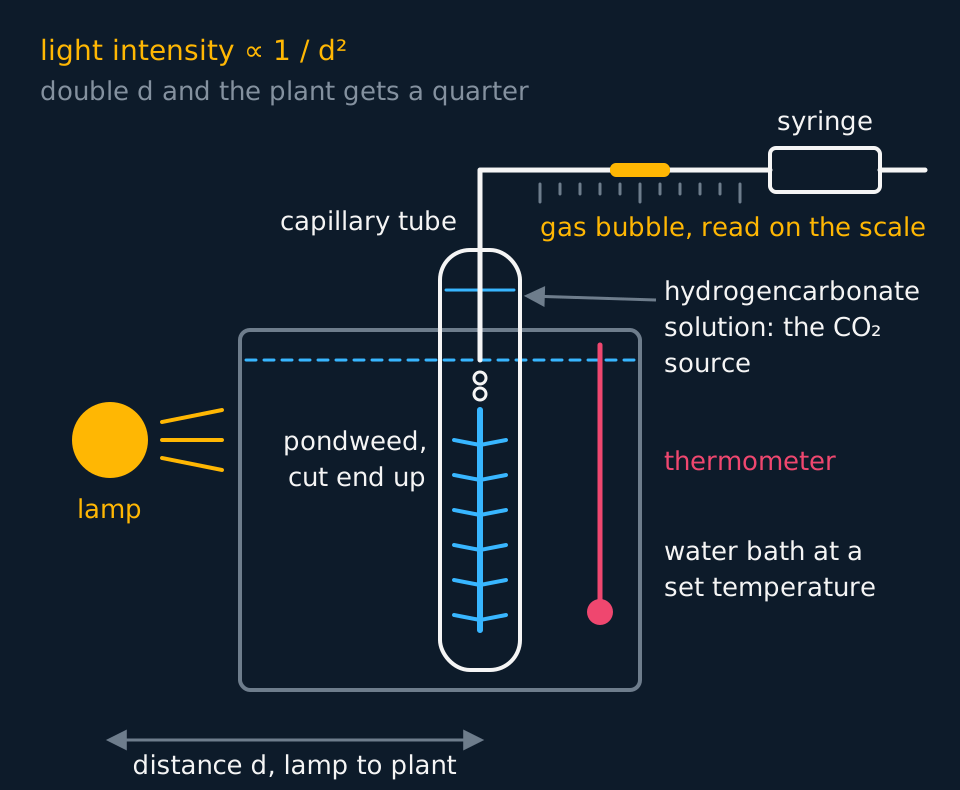
A sprig of pondweed such as Elodea or Cabomba is placed, cut end uppermost, in a boiling tube of dilute sodium hydrogencarbonate solution. The hydrogencarbonate ions supply carbon dioxide, so carbon dioxide does not limit the rate unless it is the variable being changed. The tube stands in a water bath to hold its temperature, and the plant is left for a few minutes in each new condition before a reading is taken, so that the rate has settled.
Counting bubbles is quick and imprecise: bubbles differ in size, and a fast stream cannot be counted. A photosynthometer collects the gas instead. The mouth of its capillary tube sits just above the cut end, gas gathers there for a fixed time, and a syringe then draws the bubble along the capillary beside a scale. The bubble's length and the capillary's radius give its volume, V = πr²l, and volume divided by time is the rate.
Describe the drawing
Apparatus for measuring the rate of photosynthesis of pondweed. A lamp on the left is a measured distance d from a boiling tube standing in a water bath with a thermometer. The tube holds hydrogencarbonate solution and a sprig of pondweed with its cut end at the top, giving off bubbles. The mouth of a capillary tube sits just above the cut; the capillary rises out of the tube and runs sideways along a scale to a syringe, which draws the collected gas bubble along the scale so its length can be read. A note gives light intensity as proportional to one over d squared.
The gas collected is mostly oxygen, though not all of it. Nitrogen dissolved in the water comes out with it, some of the oxygen dissolves instead of collecting, and the plant uses some in respiration. Rates measured the same way can still be compared with each other; a volume of gas is not an exact measure of the oxygen produced.
Light intensity. Move the lamp. Light from a small lamp spreads out as it travels, so its intensity is proportional to 1/d², where d is the distance from lamp to plant: the inverse square law. Halve the distance and the intensity is four times as great. Plot the rate against 1/d², or against a light-meter reading, rather than against d. Work in a darkened room so the lamp is the only light, and stop the lamp warming the water, with an LED or a beaker of water as a heat shield, reading the thermometer to show the temperature stayed the same.
Carbon dioxide concentration. Use a range of sodium hydrogencarbonate concentrations, with the lamp at a fixed distance and the water bath at a fixed temperature.
Temperature. Set the water bath to each temperature in turn and let the tube reach it before timing. Keep the light bright and the hydrogencarbonate concentration fixed, so that temperature is the factor that limits.
Wavelength. Put coloured filters between the lamp and the plant, or use coloured LEDs. Filters of different colours also pass different amounts of light, so the intensity reaching the plant has to be measured with a light meter and matched; otherwise the experiment compares brightness rather than colour. Red and blue light give the highest rates and green the lowest, as the action spectrum predicts.
Algal beads. A single-celled alga such as Chlorella, trapped in beads of sodium alginate, gives many near-identical replicates. Equal numbers of beads go into tubes of hydrogencarbonate indicator, whose colour depends on the carbon dioxide concentration through pH. As the algae remove carbon dioxide the indicator moves from orange-red towards purple; where respiration outpaces photosynthesis it moves towards yellow. The colour after a fixed time, or the absorbance read in a colorimeter, measures the net rate. A tube wrapped in foil, where the algae can only respire, is the control showing that the change in the lit tubes was caused by photosynthesis.
Lamps and water are used together here, so keep the electrics away from the water bath and let lamps cool before handling them. Check the CLEAPSS guidance and your school's risk assessment for the indicator and the alginate method.
From a bubble to a rate, and from distance to intensity
With a lamp 10 cm from the pondweed, a bubble 18 mm long collects in 5 minutes in a capillary of internal diameter 1.0 mm. Calculate the rate of gas production in mm³ min⁻¹, and the light intensity with the lamp at 20 cm as a fraction of the intensity at 10 cm.
Show the working
The radius is half the diameter, 0.50 mm. The volume is π × 0.50² × 18 = 14.1 mm³, and the rate is 14.1 ÷ 5 = 2.8 mm³ min⁻¹.
Intensity is proportional to 1/d². At 10 cm that is 1/100 and at 20 cm 1/400, so the intensity at 20 cm is a quarter of the intensity at 10 cm.
The rate at 20 cm need not be a quarter of 2.8. Rate is proportional to light intensity only on the straight part of the curve, where light is the limiting factor; if something else was limiting at 10 cm, moving the lamp back may barely change the rate at all.
- Photosynthometer
- Apparatus that collects the gas given off by an aquatic plant at the mouth of a capillary tube, so its volume can be measured against a scale.
- Inverse square law
- Light intensity from a small source is proportional to 1/d², where d is the distance from the source.
- Hydrogencarbonate indicator
- A pH indicator that shows carbon dioxide concentration: yellow when it is raised, orange-red in equilibrium with air, purple when it is lowered.
- Immobilised algae
- Algal cells trapped in beads of sodium alginate, so equal numbers can be put into each tube of an experiment.
The compensation point
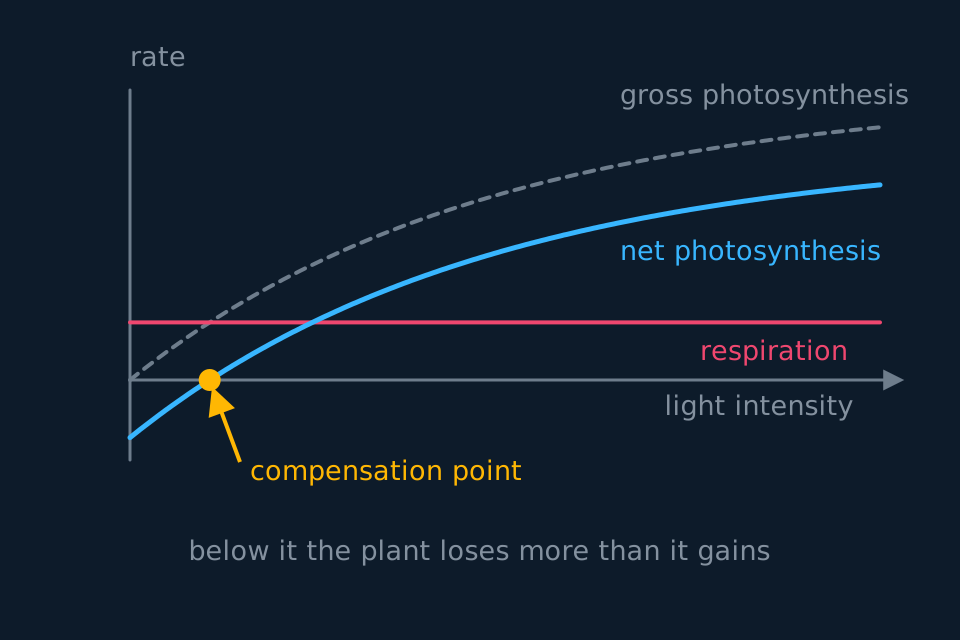
A plant is doing two opposite things at once. Photosynthesis takes carbon dioxide in and gives oxygen out; respiration does the reverse, and never stops. What you measure from outside is the difference between them.
Describe the drawing
A graph against light intensity with zero marked by the horizontal axis. A dashed curve shows gross photosynthesis rising from zero and flattening; a straight coral line shows respiration going on at the same rate whatever the light; and a solid cyan curve, the net rate, is the gap between them. The net curve starts below the axis in the dark, crosses zero at a marked point where photosynthesis and respiration are equal, and rises above it thereafter.
At dawn, light intensity is low and photosynthesis is slower than respiration, so the plant releases carbon dioxide overall: it is running at a loss, living off stores. As the light strengthens, photosynthesis speeds up until it exactly matches respiration. At that intensity there is no net gas exchange at all, which is the compensation point, and above it the plant begins to accumulate organic matter.
- Compensation point
- The light intensity at which the rate of photosynthesis exactly equals the rate of respiration, so there is no net exchange of carbon dioxide or oxygen.
- Compensation period
- The time taken from first light for a plant to reach its compensation point. None of the A-level specifications this site follows uses the term.
Species differ in where their compensation point sits, and it explains a good deal about where they grow. A shade plant on a woodland floor reaches compensation at a low intensity, so it can survive under a closed canopy; a sun plant of open ground needs far more light before it breaks even and would starve in the same spot. It also explains why seedlings under dense weeds die: they never spend enough of the day above their compensation point to build anything.
Applying limiting factors in a glasshouse
Commercial growers control all three factors, and the arithmetic decides whether doing so is profitable. The figures below are typical commercial values rather than fixed thresholds; the settings that pay vary with crop, season and site.
Carbon dioxide. Outdoor air is about 0.04 per cent carbon dioxide, which is well below what rubisco could use. Enriching a glasshouse to around 0.10 per cent typically lifts yield by a fifth to a third in tomatoes and cucumbers. The gas often comes from burning natural gas or propane, which conveniently supplies heat at the same time. Above roughly 0.15 per cent the benefit tails off and the plants may be damaged, so more is not better indefinitely.
Temperature. Most glasshouse crops are run somewhere between 20 and 25 °C. Warmer speeds the enzymes of the Calvin cycle, but it also speeds respiration, which spends the sugars the crop is supposed to accumulate, and past about 30 °C the stomata begin to close and rubisco takes up more oxygen. There is an optimum and it is not simply 'as hot as possible'.
Light. Supplementary lamps extend the effective day through a northern winter, which is why glasshouse tomatoes are available in February. Lamps are the expensive option, and a grower will only run them while the extra crop is worth more than the electricity.
Is the enrichment worth it?
A grower's 400 m² glasshouse yields 24 kg of tomatoes per square metre per year. Enriching the air to 0.10 per cent carbon dioxide raises the yield by 25 per cent, and the enrichment costs £3200 a year to run. Tomatoes sell for £1.60 per kilogram. Should the grower do it?
Show the working
Work out the extra crop first. The increase is 25 per cent of 24, so 6 kg per square metre per year, and over 400 m² that is 6 × 400 = 2400 kg of extra tomatoes.
Now the money: 2400 × £1.60 = £3840 of extra income against £3200 of cost, leaving £640. On these figures the grower should do it, but the margin is 20 per cent of the cost, which is thin.
The biology behind the answer is the limiting-factor principle. Enrichment only pays while carbon dioxide is the limiting factor. Run it on a dull winter afternoon when light is limiting instead and the yield does not rise at all, and the £3200 is spent for nothing, which is exactly why commercial systems dose carbon dioxide on a light sensor rather than continuously.
Net primary productivity and transfer to consumers
Step back from the single leaf to a whole field, and the question becomes how much chemical energy the plants there capture in a year. Gross primary productivity is the total: everything fixed by photosynthesis. But the plants respire a substantial share of it themselves, commonly 20 to 50 per cent, and what is left is what actually accumulates as new plant material.
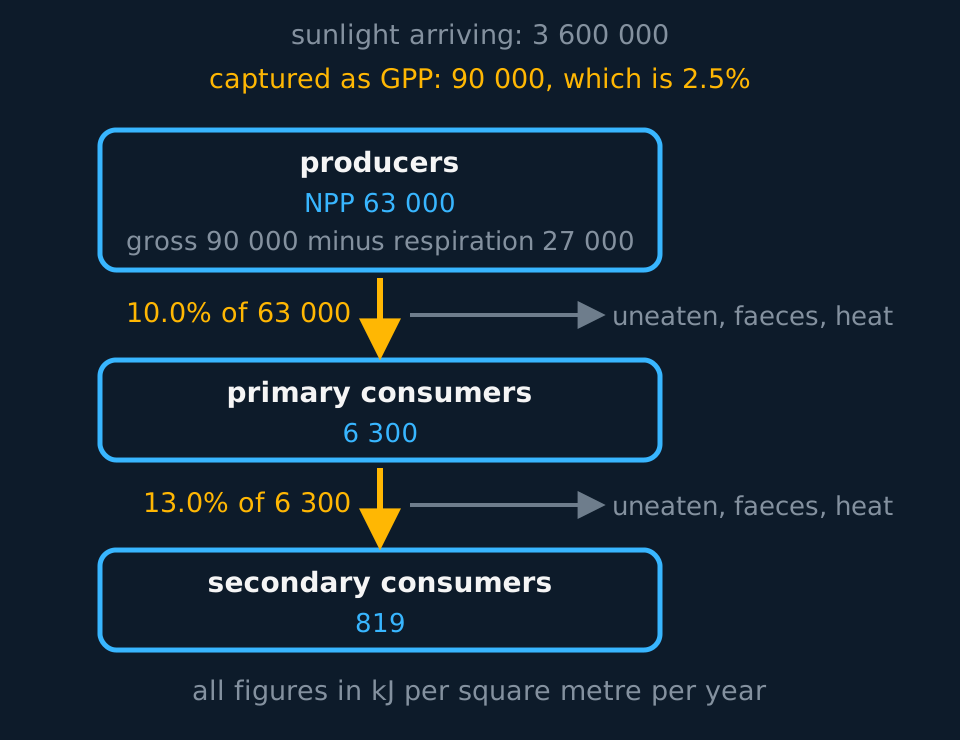
NPP = GPP − RNet primary productivity is gross primary productivity minus the energy lost in respiration by the producers. NPP is what is available to the organisms that eat them.
Describe the drawing
A downward cascade of energy. Two lines at the top give the sunlight arriving on a square metre in a year and the far smaller amount fixed as gross primary productivity. Beneath them three boxes, one for producers carrying their net primary productivity after respiration is subtracted, one for primary consumers and one for secondary consumers, each holding roughly a tenth of the energy of the box above. Arrows between the boxes are labelled with the percentage passed on, and side arrows show where the rest of the energy goes.
Productivity is a rate per unit area, so it is quoted as energy per square metre per year: kJ m⁻² year⁻¹. Both parts of the unit are needed, because a number of kilojoules alone cannot be compared between a field and a forest.
Most of the sunlight falling on a field is never captured. Some misses the leaves entirely and lands on soil; some is reflected off the waxy cuticle; some is transmitted straight through; much of it is at wavelengths the pigments do not absorb, the green band among them. What is absorbed usefully typically fixes one to three per cent of the incoming energy.
percentage transfer = (energy in the level ÷ energy in the level below) × 100Use the same units on top and bottom, and be clear which two levels you are comparing before you divide.
Between trophic levels the losses have four familiar causes. Not all of the plant is eaten: roots, wood and litter are left behind. Not all of what is eaten is digested; the indigestible part leaves as faeces. Some of what is absorbed is excreted, as urea in mammals. And a large share is respired to power movement, and in birds and mammals to maintain body temperature. Only what is left builds new tissue and is available to the next level.
That last cause explains a pattern worth quoting. Transfer to a mammal or a bird is often only 5 to 10 per cent, because keeping a constant body temperature is expensive; transfer to an insect or a fish can be considerably higher. It is also the argument behind eating lower down the chain: feeding grain to people rather than to cattle avoids one ninety-per-cent loss.
TRY IT: Working with productivity figures
In a grassland, gross primary productivity is 24 000 kJ m⁻² year⁻¹ and the plants lose 8 400 kJ m⁻² year⁻¹ in respiration. The primary consumers accumulate 1 248 kJ m⁻² year⁻¹. Calculate the net primary productivity and the percentage of it transferred to the primary consumers, and suggest two reasons why the percentage is not higher.
Check your answer
Net primary productivity is gross minus respiration: 24 000 − 8 400 = 15 600 kJ m⁻² year⁻¹. Keep the units on the answer; they are part of it.
The transfer is 1 248 ÷ 15 600 × 100 = 8.0 per cent. Divide by the NPP, not by the GPP: the energy the plants have already respired away was never available to a herbivore.
Two reasons from the standard list, each phrased as a loss: much of the plant material is not eaten at all, including roots and dead litter, and much of what is eaten is not digested and passes out as faeces. Respiration by the consumers themselves is a third, and if they are mammals, maintaining body temperature accounts for a large part of it.
Dividing by 24 000 gives 5.2 per cent, which is the transfer as a proportion of gross productivity rather than of net productivity. Identify which productivity the question gives before dividing.
Where those numbers come from, and the consumer's version
Every figure above is an energy per unit area per year, but energy cannot be weighed directly. What is measured is biomass, which is then converted.
Biomass is measured as dry mass, because fresh mass is mostly water and the water content of a sample varies with the weather on the morning it was cut. A sample is dried in an oven at around 80 °C and reweighed repeatedly until the mass stops falling, and that constant mass is the figure used. Waiting for constant mass is the whole technique: weigh once and you have measured how damp the sample was.
Turning that dry mass into energy needs a calorimeter. A known dry mass is burned in oxygen inside a sealed vessel surrounded by a known volume of water, and the temperature rise of the water gives the energy released. Divide by the mass and you have the energy per gram, which scales up to the kJ m⁻² year⁻¹ the tables quote. Neither step leaves the sample usable afterwards, so a figure of this kind is obtained once from a set of organisms and never again from those same ones.
Consumers have their own productivity expression. A herbivore does not photosynthesise, so its production starts from the energy it ingests and subtracts the energy it does not retain.
N = I − (F + R)Net production of a consumer is the chemical energy in the food it ingests, minus the energy lost in faeces and urine, minus the energy lost in respiration. What is left is new tissue, and only that is available to the next trophic level.
The bracket is part of the expression. F and R are subtracted together because both are losses from the same intake. Writing N = I − F + R adds the respiratory loss back in and, whenever R exceeds F, gives a net production larger than the energy ingested, so a value of N greater than I indicates the bracket has been dropped.
Pyramids of numbers, biomass and energy
A food chain can be drawn as a pyramid: one horizontal bar for each trophic level, producers at the base, each bar as wide as the quantity at that level. Pearson Edexcel's Biology B names three kinds, and they measure different things.
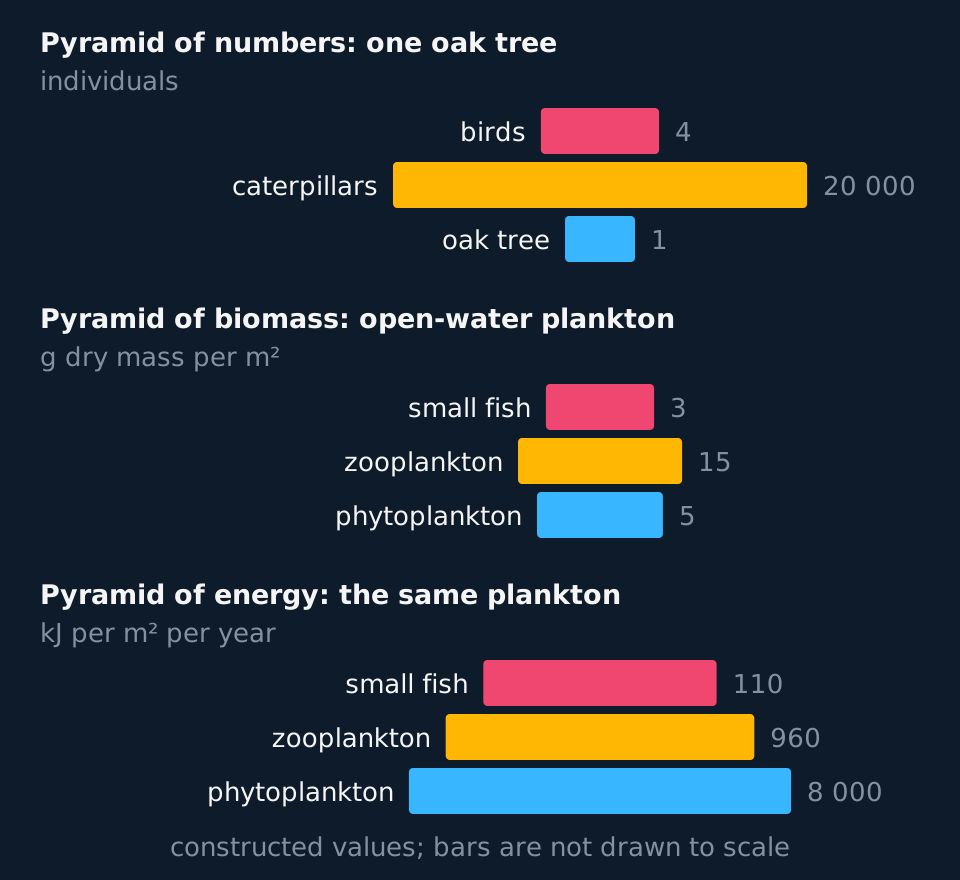
A pyramid of numbers counts the individuals at each level in an area. It is the easiest to obtain: counting needs no special equipment and leaves the organisms alive. It takes no account of size, though, so one oak counts the same as one caterpillar, and a single large producer feeding thousands of herbivores gives a pyramid with a narrow base, inverted at the bottom. Parasites do the same higher up, many fleas on one host. The numbers can also span so many powers of ten that the bars cannot be drawn to scale.
A pyramid of biomass gives the dry mass of the organisms at each level per unit area, at one time, in g m⁻². It allows for size, so the oak counts for its mass, and most are upright. Measuring dry mass means killing the organisms, so the figures are estimates from samples. The pyramid is also a snapshot, which hides how fast each level is replaced, and equal masses of different tissue can hold different amounts of energy: a gram of fat holds about twice the energy of a gram of carbohydrate.
A pyramid of energy gives the energy passing through each level per unit area per year, in kJ m⁻² year⁻¹: the productivity figures from earlier in this lesson. It can never be inverted, because every level gets its energy from the level below and loses most of it, and the efficiency of each transfer can be read straight off it. It is the hardest to obtain, needing biomass measured through a whole year and its energy found by calorimetry. All three share one difficulty: an omnivore feeds at more than one level and has to be divided between them.
Describe the drawing
Three ecological pyramids stacked one above the other, each with producers at the bottom. The pyramid of numbers for one oak tree has a narrow base of one tree under a wide bar of twenty thousand caterpillars and a narrow bar of four birds. The pyramid of biomass for open-water plankton is also inverted at its base: 5 grams of phytoplankton per square metre under 15 grams of zooplankton, with 3 grams of small fish above. The pyramid of energy for the same plankton narrows at every level, from 8000 to 960 to 110 kilojoules per square metre per year.
The plankton pair in the figure is the case to understand. When the sample is taken there are 5 g of phytoplankton per square metre under 15 g of zooplankton. That is possible because phytoplankton cells can divide within a day or so, and they are eaten about as fast as they grow, so over a year the producers make many times their own standing biomass. The energy pyramid for the same water is built on that production over the year, and it is upright.
| Pyramid | Each bar shows | Advantage | Disadvantage |
|---|---|---|---|
| Numbers | Individuals per area | Quick to obtain; nothing is killed | Ignores size, so it can be inverted |
| Biomass | Dry mass per area, at one time | Allows for the size of organisms | Destructive; a snapshot that ignores turnover |
| Energy | Energy per area per year | Never inverted; shows each transfer | Hardest to measure; needs a year of data |
- Pyramid of numbers
- A diagram of the number of individual organisms at each trophic level in an area.
- Pyramid of biomass
- A diagram of the dry mass of organisms at each trophic level per unit area, at one time.
- Pyramid of energy
- A diagram of the energy passing through each trophic level per unit area per year; it is never inverted.
Farming for a more efficient transfer
AQA's specification asks how production is affected by farming practices designed to increase the efficiency of energy transfer, and names two: simplifying food webs to reduce energy losses to non-human food chains, and reducing respiratory losses within a human food chain. OCR asks for the same idea as the ways human activities can manipulate the transfer of biomass through ecosystems.
A field of wheat is the base of a food web. Weeds compete with the crop for light, water and mineral ions, so some of the sunlight that wheat could have fixed is fixed by plants nobody harvests. Insects and fungi eat or infect the crop, and the energy in what they take passes into non-human food chains. Herbicides remove weeds, insecticides and fungicides control pests, and biological control does the same job with a predator or parasite of the pest. Each cuts the energy lost to non-human food chains, so a larger share of the net primary productivity ends up in the harvested crop.
In livestock the loss to cut is respiration, R in N = I − (F + R). Animals kept in warm sheds lose less heat to their surroundings, so they respire less to keep their body temperature up. Animals kept in pens move less, so less energy goes on muscle contraction. Both leave more of the energy ingested as net production, which is growth. Feed that is easily digested and rich in protein cuts F as well, and animals are slaughtered young, while most of what they eat still goes into growth rather than into maintaining an adult body.
Each method has costs as well as a gain in yield. Herbicides and pesticides remove species that other wildlife depends on, and pests evolve resistance to them. Keeping animals indoors and confined raises welfare concerns, and disease spreads quickly between animals kept close together. An evaluation answer names the gain in energy transfer and at least one cost.
TRY IT: Indoors or outdoors
Two groups of beef cattle eat the same food. Per animal per year, each ingests 40 000 MJ and loses 14 000 MJ in faeces and urine. Respiration uses 24 400 MJ in the cattle kept outdoors and 23 200 MJ in the cattle kept in a shed. Calculate the net production of each as a percentage of the energy ingested, and explain the difference. The figures are constructed for this example.
Check your answer
Outdoors: N = 40 000 − (14 000 + 24 400) = 1 600 MJ, which is 1 600 ÷ 40 000 × 100 = 4.0 per cent.
In the shed: N = 40 000 − (14 000 + 23 200) = 2 800 MJ, which is 7.0 per cent.
The housed cattle respire less. They lose less heat in a warm shed, so less respiration goes on keeping their body temperature up, and they move less, so less goes on muscle contraction. With F the same, the energy saved from R goes into growth.
In the exam
- Justify the limiting factor from the graph rather than naming it alone: light is limiting where the rate increases as light intensity increases.
- A plateau means the factor on the x-axis is no longer limiting. It does not mean the plant is at its maximum possible rate.
- Productivity needs both parts of its unit, an area and a time: kJ m⁻² year⁻¹ here, and AQA's specification writes kJ ha⁻¹ year⁻¹.
- NPP = GPP − R. If a question gives you gross productivity and asks about food available to consumers, you have a subtraction to do first.
- Percentage transfer is calculated from the level below, and from net productivity rather than gross. Check which figure the question has given you before dividing.
- Define the compensation point as the light intensity at which photosynthesis equals respiration, not as the point at which photosynthesis begins.
- Plot a light-intensity experiment against 1/d², or a light-meter reading. Distance itself runs the wrong way.
- Give a pyramid's disadvantage with its reason: 'a pyramid of numbers ignores the size of organisms' says more than 'it can be inverted'.
- Link each farming method to the loss it cuts, such as competition, pests, heat loss or movement, and to F or R in N = I − (F + R).
Check yourself
A grower measures the rate of photosynthesis of a tomato crop through a clear spring day. The rate rises through the morning, levels off from about 11 am to 3 pm despite the light continuing to brighten until 1 pm, and then falls through the afternoon. Explain the shape of this curve, and suggest one change the grower could make to raise the midday part of it.
Answer
Through the morning the rate rises because light intensity is increasing and light is the limiting factor: more light means more photoionisation, more ATP and reduced NADP, and a faster Calvin cycle.
From about 11 am the rate levels off even though the light is still brightening, so light has stopped being limiting. Something else has taken over, most likely the carbon dioxide concentration around the leaves, which the crop itself has been depleting all morning, or the temperature if it is high enough to be closing stomata.
The afternoon fall follows the light back down: once the intensity drops far enough, light becomes limiting again and the rate falls with it.
To raise the middle of the curve the grower should increase the factor that is limiting there, which means carbon dioxide, enriching the air to about 0.10 per cent. Adding more light during the plateau would not raise the rate, because light is not limiting there.
Questions
Question 16 marks
Two groups of pigs are given the same food. Per pig per day, each ingests 30 000 kJ and loses 9 000 kJ in faeces and urine. Respiration uses 18 600 kJ in pigs kept outdoors and 16 800 kJ in pigs kept in a heated shed with restricted movement. Calculate the net production of each group as a percentage of the energy ingested, and explain the difference. The figures are constructed for this question.
Mark scheme
- M1 outdoors: N = I − (F + R) = 30 000 − (9 000 + 18 600)
- A1 2 400 kJ, which is 8.0 per cent of the energy ingested
- M1 indoors: N = 30 000 − (9 000 + 16 800)
- A1 4 200 kJ, which is 14 per cent of the energy ingested
- B1 in the heated shed the pigs lose less heat to their surroundings, so less respiration is needed to keep their body temperature up
- B1 with movement restricted, less energy is used in muscle contraction, so with F unchanged the energy saved from respiration goes into growth
Question 26 marks
Describe how you would investigate the effect of carbon dioxide concentration on the rate of photosynthesis of pondweed.
Mark scheme
- B1 pondweed such as Elodea, the same length or mass each time, placed cut end uppermost in a boiling tube of sodium hydrogencarbonate solution
- B1 a range of at least five concentrations of sodium hydrogencarbonate as the source of carbon dioxide
- B1 the lamp kept at a fixed distance in a darkened room, with an LED or a heat shield so it does not warm the water
- B1 the tube kept in a water bath at a fixed temperature, checked with a thermometer
- B1 the plant left for a few minutes at each new concentration before measuring, so the rate settles
- B1 gas collected for a fixed time in a photosynthometer and its volume found from the bubble length, repeated at each concentration and a mean rate calculated
Question 35 marks
A population of caterpillars in a field ingests 8 400 kJ m⁻² year⁻¹ of leaf material. Of this, 5 200 kJ m⁻² year⁻¹ is lost in faeces, and a further 1 900 kJ m⁻² year⁻¹ is lost in respiration. Calculate the net production of the caterpillars, and calculate what percentage of the energy they ingested it represents.
Mark scheme
- M1 N = I − (F + R), so add the two losses together first: 5 200 + 1 900 = 7 100 kJ m⁻² year⁻¹
- M1 N = 8 400 − 7 100
- A1 N = 1 300 kJ m⁻² year⁻¹
- M1 percentage = net production ÷ energy ingested × 100 = 1 300 ÷ 8 400 × 100
- A1 15 per cent, to two significant figures
Question 45 marks
The table gives constructed values for the plankton of an area of open water. Calculate the percentage of energy transferred from the phytoplankton to the zooplankton, and explain why a pyramid of biomass for this water is inverted while its pyramid of energy is not.
| Trophic level | Dry biomass at one time / g m⁻² | Energy / kJ m⁻² year⁻¹ |
|---|---|---|
| Phytoplankton | 5 | 8 000 |
| Zooplankton | 15 | 960 |
| Small fish | 3 | 110 |
Mark scheme
- M1 960 ÷ 8 000 × 100
- A1 12 per cent of the energy is transferred
- B1 the pyramid of biomass is measured at one moment, so it shows only the standing biomass at that time
- B1 phytoplankton reproduce very quickly and are eaten about as fast as they grow, so a small standing biomass produces many times its own mass over a year
- B1 the pyramid of energy measures energy flow over a year; each level receives its energy only from the level below and loses most of it, so it can never be inverted
Question 55 marks
A student used a photosynthometer with a capillary tube of internal diameter 0.80 mm to collect the gas given off by pondweed for 5 minutes at each lamp distance. The table gives constructed results. Calculate the rate of gas production at 20 cm in mm³ min⁻¹, and use the data to evaluate the student's claim that the rate is proportional to light intensity.
| Distance of lamp / cm | Length of gas bubble / mm |
|---|---|
| 10 | 28.6 |
| 15 | 21.0 |
| 20 | 15.4 |
| 30 | 8.7 |
Mark scheme
- M1 radius 0.40 mm and volume = πr²l = π × 0.40² × 15.4
- A1 volume of the bubble = 7.7 mm³
- A1 7.7 ÷ 5 = 1.5 mm³ min⁻¹
- B1 moving the lamp from 20 cm to 10 cm makes the light four times as intense, by the inverse square law, but the bubble length rises only from 15.4 mm to 28.6 mm, less than double, so the rate is not proportional to light intensity across the range
- B1 at the higher intensities another factor, such as carbon dioxide concentration or temperature, is becoming limiting; accept that the gas collected is not pure oxygen, or that there are no repeats
Question 64 marks
A graph shows the rate of photosynthesis against light intensity, with three curves obtained at three different carbon dioxide concentrations. The curves lie on top of one another at low light intensity and level off at different heights. Explain how to identify the limiting factor in each region of this graph.
Mark scheme
- B1 on the steep part at low light intensity the rate rises as light intensity rises, so light is the limiting factor there
- B1 the three curves coincide in that region, which shows the extra carbon dioxide is doing nothing, because there is not enough light energy to use what is already present
- B1 where a curve levels off, more light no longer raises the rate, so light has stopped being limiting and something else has taken over
- B1 the curves plateau at different heights, and since carbon dioxide concentration is what differs between them, carbon dioxide is the factor limiting the rate on the plateaux of the two lower curves, while the graph cannot show what limits the highest one (accept another factor such as temperature); a plateau marks the point where the factor on the horizontal axis stopped mattering, not an absolute maximum
Question 74 marks
In a grassland the gross primary productivity is 18 000 kJ m⁻² year⁻¹ and the producers lose 6 000 kJ m⁻² year⁻¹ in respiration. The primary consumers accumulate 1 080 kJ m⁻² year⁻¹. Calculate the net primary productivity and the percentage of it transferred to the primary consumers.
Mark scheme
- M1 net primary productivity = gross primary productivity minus the energy lost in respiration by the producers
- A1 18 000 − 6 000 = 12 000 kJ m⁻² year⁻¹, with both parts of the unit kept
- M1 percentage transfer = energy in the consumers ÷ net primary productivity × 100 = 1 080 ÷ 12 000 × 100
- A1 9.0 per cent; dividing by the gross figure would be wrong, because the energy the producers had already respired away was never available to a herbivore
Question 84 marks
Explain why only about ten per cent of the energy in one trophic level reaches the level above it.
Mark scheme
- B1 not all of the material in the level below is eaten: roots, wood and dead litter are left behind
- B1 not all of what is eaten is digested, and the indigestible part leaves the body as faeces
- B1 some of what is absorbed is lost in excretion, as urea in mammals
- B1 a large share of the rest is respired to power movement and, in birds and mammals, to maintain a constant body temperature, so only what is left builds new tissue; transfer to a bird or mammal is often only 5 to 10 per cent, while transfer to an insect or a fish can be higher
Question 94 marks
A grower runs carbon dioxide enrichment continuously in a glasshouse through a dull week in December and finds no increase in yield at all. Suggest why the enrichment failed to work, and suggest how the system should be run instead.
Mark scheme
- B1 enrichment raises the rate only while carbon dioxide is genuinely the limiting factor
- B1 through a dull December week the light intensity is low, so light is limiting and the extra carbon dioxide cannot be used: there is not enough energy to drive the light-dependent stage and supply the Calvin cycle
- B1 the rate is set by whichever factor is in shortest supply, so raising any other factor changes nothing and the cost of the gas is spent for no return
- B1 the enrichment should be dosed on a light sensor, so gas is released only when the light is bright enough for carbon dioxide to become limiting, and supplementary lamps are the change that would help on the dull days
Question 104 marks
Explain why a graph of the rate of photosynthesis against temperature rises to a peak and then falls, whereas a graph against light intensity or carbon dioxide concentration only rises and then levels off.
Mark scheme
- B1 light intensity and carbon dioxide concentration are the energy and the raw material the reaction itself needs, so supplying more of either lets the existing enzymes work faster up to the point where something else becomes limiting, at which point the rate levels off rather than falling
- B1 temperature instead acts on the enzymes of the Calvin cycle, rubisco among them, rather than being a raw material
- B1 below the optimum, raising temperature increases the rate as usual, since molecules have more kinetic energy and collide more often and more successfully
- A1 above the optimum the enzymes, rubisco among them, begin to denature, so the rate falls even though light and carbon dioxide may both still be plentiful; accept also that respiration, or the share of rubisco's reactions taking oxygen, rises with temperature, or that stomata close
Question 114 marks
Describe how the energy content of a sample of plant biomass is measured, from collecting the sample to obtaining a value in kilojoules.
Mark scheme
- B1 the fresh sample is dried in an oven at around 80 °C and reweighed repeatedly until its mass stops falling, because fresh mass is mostly water and would otherwise vary with recent weather
- B1 that constant mass is recorded as the dry mass of the sample
- B1 a known dry mass is then burned in oxygen inside a calorimeter, a sealed vessel surrounded by a known volume of water
- A1 the temperature rise of that water is used to calculate the energy released, and dividing by the mass burned gives the energy per gram, which is then scaled up to the kJ m⁻² year⁻¹ productivity figures quote
Question 124 marks
On a still, overcast day a plant's net carbon dioxide uptake becomes measurably positive only two hours after sunrise, whereas on a bright, clear day it becomes positive within twenty minutes of sunrise. Suggest why, using the concept of the compensation point.
Mark scheme
- B1 respiration continues at a similar rate throughout, day or night, using up organic matter and releasing carbon dioxide regardless of how bright it is outside
- B1 the plant only shows a net uptake of carbon dioxide once its rate of photosynthesis exceeds its rate of respiration, which is the compensation point
- B1 on the overcast day light intensity rises far more slowly after sunrise than on the clear day, so it takes longer for photosynthesis to catch up with and then overtake the constant rate of respiration
- A1 on the clear day light intensity rises quickly, so the compensation point is reached, and passed, much sooner after sunrise
Question 134 marks
Compare gross primary productivity with net primary productivity, and compare the situation of a fast-growing crop plant with that of a large forest tree in terms of the proportion of GPP that is available as NPP.
Mark scheme
- B1 gross primary productivity is the total energy fixed by photosynthesis, whereas net primary productivity is what remains once the plants' own respiration has been subtracted, so NPP is always less than GPP
- B1 NPP, not GPP, is what is available to be eaten by consumers or to accumulate as new plant material
- B1 a large forest tree has a substantial mass of non-photosynthetic tissue, wood, bark and roots, to respire and maintain, so a large share of its GPP, commonly nearer 50 per cent, is lost in its own respiration
- A1 a fast-growing crop plant carries much less non-photosynthetic tissue relative to its leaf area, so a smaller share of its GPP is spent on respiration and a correspondingly larger share is left as NPP
Question 144 marks
Compare a pyramid of biomass with a pyramid of energy as ways of representing the same ecosystem.
Mark scheme
- B1 a pyramid of biomass shows dry mass per unit area at one time, in g m⁻², whereas a pyramid of energy shows energy per unit area per year, in kJ m⁻² year⁻¹
- B1 both allow for the size of the organisms, and both need organisms to be killed, by drying, and for energy also by burning in a calorimeter
- B1 a pyramid of biomass can be inverted because it ignores how quickly each level is replaced, whereas a pyramid of energy is never inverted
- B1 a pyramid of energy is harder to obtain, needing measurements through a whole year, whereas biomass needs one sample; but equal masses can hold different amounts of energy, so biomass is a less reliable guide to energy transfer
Question 154 marks
Explain how spraying a wheat crop with a herbicide and an insecticide increases the efficiency of energy transfer from sunlight to humans.
Mark scheme
- B1 the herbicide kills weeds, which compete with the wheat for light, water and mineral ions
- B1 so more of the light falling on the field is absorbed by the wheat, and more of the field's primary productivity is in the crop
- B1 the insecticide kills insects that eat the crop, so less of the crop's energy passes into food chains that do not end in humans
- B1 the food web is simplified, so a larger share of the net primary productivity ends up in the harvested grain that humans eat
Question 164 marks
Equal numbers of algal beads were put into two tubes of hydrogencarbonate indicator, which was orange-red at the start. Tube A was lit and tube B was wrapped in foil. After an hour tube A was purple and tube B was yellow. Explain these results and the purpose of tube B.
Mark scheme
- B1 in tube A the rate of photosynthesis was greater than the rate of respiration, so there was a net uptake of carbon dioxide from the solution
- B1 less carbon dioxide raises the pH, which turns the indicator purple
- B1 in tube B there was no light, so the algae only respired; the carbon dioxide released lowered the pH and turned the indicator yellow
- B1 tube B is a control showing that the change in tube A was caused by light, through photosynthesis, rather than by the beads or the indicator alone
Question 173 marks
Explain what is happening to a plant at its compensation point, and explain why a shade plant on a woodland floor can survive there while a sun plant of open ground would not.
Mark scheme
- B1 every living plant cell respires continuously, day and night, while photosynthesis happens only in the light, so what is measured from outside is the difference between the two rates
- B1 at the compensation point the rate of photosynthesis exactly equals the rate of respiration, so there is no net exchange of carbon dioxide or of oxygen and no organic matter accumulates
- B1 a shade plant reaches its compensation point at a low light intensity, so under a closed canopy it still spends much of the day above it and gains, whereas a sun plant needs far more light to break even and would spend the day running at a loss on its stores
Question 183 marks
Explain why a single group of plants can only be used once to obtain a productivity figure by the biomass and calorimetry method, rather than being measured repeatedly over a season.
Mark scheme
- B1 obtaining a dry mass requires drying the sample to constant mass, which kills and dehydrates the plant material completely
- B1 obtaining its energy content then requires burning that dry mass in a calorimeter, which destroys the sample entirely
- A1 neither step leaves anything of the original plants to measure again, so a productivity figure is measured once from a given batch of organisms and a fresh batch must be collected for every further measurement
Question 193 marks
A student calculates a consumer's net production as N = I − F + R and obtains a value larger than the energy the consumer ingested. Explain what has gone wrong, and explain what the correct form of the equation should give instead.
Mark scheme
- B1 faeces and respiration are both energy the consumer has lost from what it ingested, so both must be subtracted from the intake, not just one of them
- B1 writing N = I − F + R instead adds the respiratory loss back on rather than subtracting it, which is why the student's answer came out larger than the energy ingested in the first place
- A1 the correct form keeps both losses inside a bracket subtracted together, N = I − (F + R), so that net production can never exceed the energy ingested
Question 203 marks
In a lake, the primary consumers have a net productivity of 640 kJ m⁻² year⁻¹, and the secondary consumers that eat them accumulate 76.8 kJ m⁻² year⁻¹. Calculate the percentage of energy transferred from the primary consumers to the secondary consumers.
Mark scheme
- M1 percentage transfer = energy in the level above ÷ energy in the level below × 100
- M1 76.8 ÷ 640 × 100
- A1 12 per cent
Question 213 marks
Explain why a pyramid of numbers for a food chain based on a single oak tree can be inverted, and give one advantage of a pyramid of numbers.
Mark scheme
- B1 a pyramid of numbers counts individuals and takes no account of their size or mass
- B1 one oak tree is very large and supports thousands of small herbivores such as caterpillars, so the producer bar is narrower than the primary consumer bar above it
- B1 advantage: it is quick and easy to obtain, needing no special equipment, and the organisms are not killed
Question 223 marks
A lamp is moved from 10 cm to 25 cm away from a piece of pondweed. Calculate the light intensity reaching the pondweed at 25 cm as a percentage of the intensity at 10 cm.
Mark scheme
- M1 light intensity is proportional to 1/d², the inverse square law
- M1 (1/25²) ÷ (1/10²) = 100 ÷ 625
- A1 0.16, so 16 per cent
Question 233 marks
A student investigates the effect of the colour of light on the rate of photosynthesis of pondweed using coloured filters. Explain why the student must measure the light intensity reaching the plant through each filter, and predict which colours give the highest and lowest rates.
Mark scheme
- B1 filters of different colours transmit different amounts of light, so intensity would change with colour and the experiment would compare brightness; intensity is measured with a light meter and matched, for example by moving the lamp
- B1 blue and red light give the highest rates, because chlorophyll and the accessory pigments absorb them strongly
- B1 green light gives the lowest rate, because little of it is absorbed; most is reflected or transmitted
Question 242 marks
State what is meant by a limiting factor, and state the units in which primary productivity is measured.
Mark scheme
- B1 a limiting factor is the factor, of all those a process requires, whose shortage is holding the rate back at that moment, and the only one whose increase would speed the process up
- B1 productivity is measured as energy per unit area per unit time, such as kJ m⁻² year⁻¹ or kJ ha⁻¹ year⁻¹
Question 252 marks
State what is meant by gross primary productivity, and state the equation linking it to net primary productivity.
Mark scheme
- B1 gross primary productivity is the total chemical energy fixed by photosynthesis in a given area in a given time, before any of it is used
- B1 net primary productivity = gross primary productivity − respiration by the producers, that is NPP = GPP − R
Worth remembering
- The limiting factor is the one in shortest supply, and increasing anything else changes nothing.
- Where the curve rises, the factor on the x-axis is limiting; where it levels off, something else is.
- At the compensation point photosynthesis exactly equals respiration, and plants respire all day and all night.
- NPP = GPP − R, and productivity is measured in kJ m⁻² year⁻¹.
- Roughly a tenth of the energy gets through each trophic level, which is why food chains are short.
- Biomass is dry mass, dried to constant mass; its energy comes from a calorimeter, and neither step leaves the sample usable afterwards.
- N = I − (F + R) for a consumer. Keep the bracket: F and R are both losses from the same intake.
- Light intensity from a lamp is proportional to 1/d²: double the distance, a quarter of the light.
- Pyramids of numbers and biomass can be inverted; a pyramid of energy never can.
- Farming raises transfer by cutting out competing food chains and by cutting livestock respiration.
CHECK YOUR PROGRESS
Rate how confident you are with each objective for this lesson. Ratings are saved in this browser, on this device, unless you sign in.
- Identify the limiting factor from any region of a rate graph and justify the choice.
- Explain what changes the gradient of such a graph and what changes the height of the plateau.
- Use the principle of limiting factors to explain what a commercial grower controls, and why.
- Define the compensation point and explain what it means for a plant's carbon balance.
- Distinguish gross from net primary productivity and quote productivity in the correct units.
- Calculate the percentage of energy transferred between trophic levels and explain why it is small.
- Describe how biomass is measured as dry mass and its energy found by calorimetry, and use N = I − (F + R) for the net production of a consumer.
- Describe how to measure the rate of photosynthesis of a whole plant, and how light intensity, carbon dioxide, temperature and wavelength are each varied.
- Use the inverse square law to compare the light intensity from a lamp at different distances.
- Compare pyramids of numbers, biomass and energy, with an advantage and a disadvantage of each.
- Explain how farming raises the efficiency of energy transfer, by simplifying food webs to reduce energy losses to non-human food chains and by reducing respiratory losses within a human food chain.
Open the full revision checklist to see every objective in the curriculum in one place.
Practise this lesson
WORKBOOK
The written questions from this topic, on paper with room to work, and a separate book of mark schemes. The 3 questions that are set on a diagram stay on this page, where the diagram can be drawn. Free to use; please do not redistribute or sell.