Biology › Enzymes and metabolic control › Factors affecting enzyme rate: temperature, pH and concentration
Factors affecting enzyme rate: temperature, pH and concentration
Temperature, pH, substrate concentration and enzyme concentration each change the rate of an enzyme-controlled reaction in a characteristic way. The four curves and the reasons for their shapes are set out here, beginning with the measurement of initial rate in a reaction whose rate falls as it proceeds.
Before this Enzyme action and the active site · Denaturation as loss of tertiary structure
COMMON MISCONCEPTION
A denatured enzyme is one that has been switched off, so cooling it down should switch it back on.
Cooling reverses slowing, not denaturation. Below the optimum the molecules simply collide less often. Denaturation is the tertiary structure coming apart as hydrogen and ionic bonds break, and a cooled protein does not refold reliably into a working active site.
What you should be able to do
- Explain why the rate of an enzyme-catalysed reaction falls during a run, and why initial rate is the only fair comparison between conditions.
- Account for the shape of the temperature curve as the sum of two opposing effects, and calculate a Q10.
- Explain the effect of pH in terms of charge on R groups and the bonds that depend on it.
- Interpret a substrate-concentration curve, naming what is limiting the rate in each part of it.
- Draw all four curves with the right shape, including the asymmetry of the temperature curve.
- Measure the initial rate of an enzyme-controlled reaction with a buffer, separate equilibration and controls, and calculate Q10 from two of your own runs.
Measuring initial rate
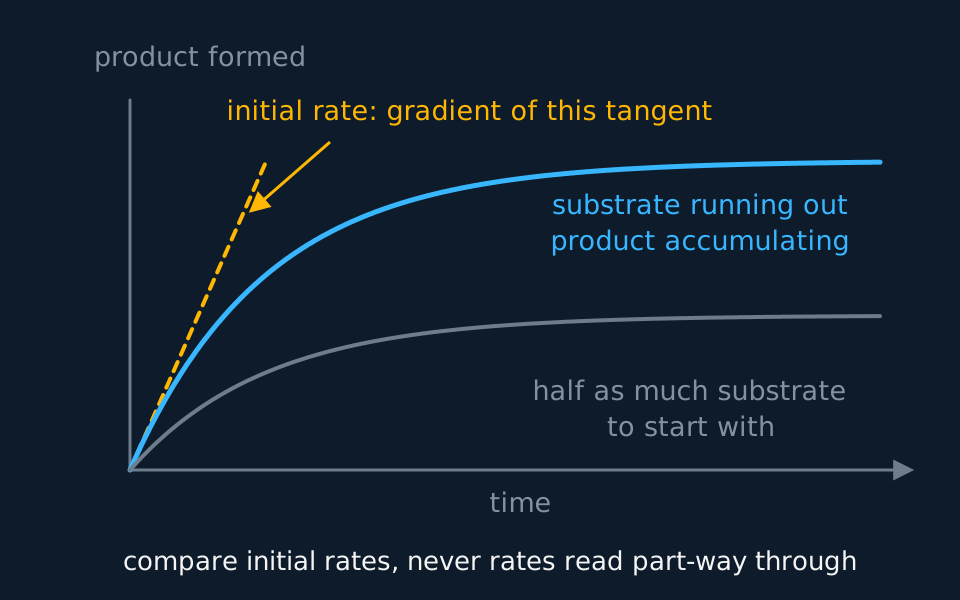
The rate of an enzyme-controlled reaction usually decreases during a closed experiment. Substrate concentration falls as substrate is used; product accumulates and may inhibit the enzyme; and prolonged exposure to warm conditions may denature some enzyme molecules. A rate measured later therefore reflects changed reaction conditions.
Describe the drawing
A graph of product formed against time. The upper cyan curve rises steeply from the origin, bends over and flattens into a plateau. A dashed amber straight line touches it at the origin and runs above it everywhere else, marking the initial rate. A lower grey curve made with half the substrate has the same shape but levels off at a lower plateau.
Compare conditions using the initial rate: the gradient of the tangent at time zero, before substrate concentration has changed appreciably and before much product has accumulated. An alternative is the reciprocal of the time taken to reach the same early endpoint, provided that endpoint occurs near the start of the reaction.
In practice, either draw the tangent at the origin, or time a fixed small change, such as the seconds until an iodine test stops giving a blue-black colour, and use 1/time.
- Initial rate
- The rate of reaction at time zero, found from the gradient of the tangent to a progress curve at the origin.
- Limiting factor
- The factor that, of all those affecting a rate, is the one restricting it at that moment.
- Optimum
- The value of a variable at which an enzyme's rate is highest.
Temperature: two opposing effects
Warming a reaction mixture has two effects at once, and the temperature curve is the sum of them.
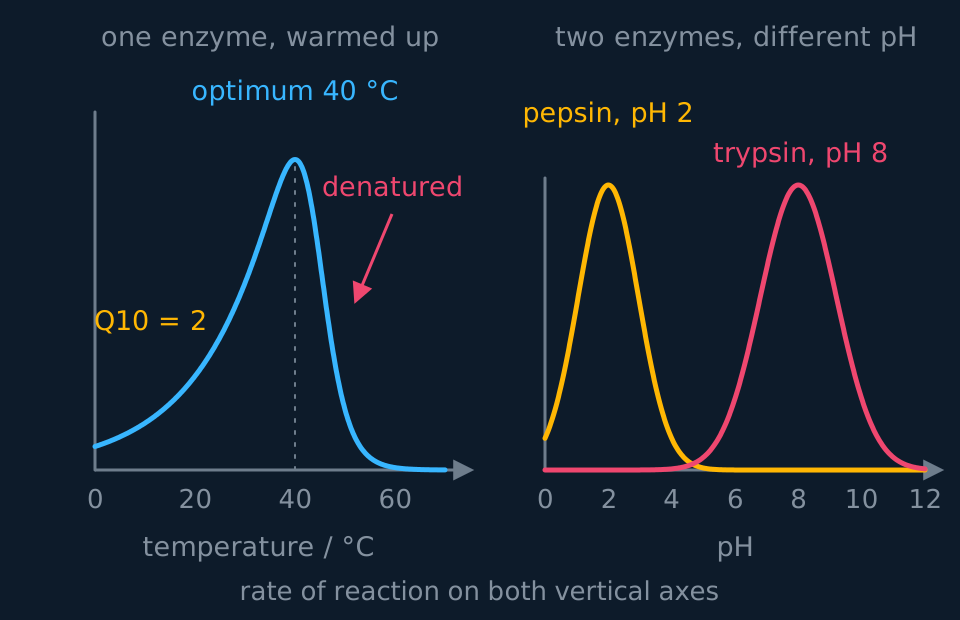
The first is increased kinetic energy. Molecules move faster and collide more often and more energetically, so a greater proportion of collisions between substrate and active site have sufficient energy to react. Below about 40 °C this effect dominates and the rate roughly doubles for every 10 °C rise. That ratio is the temperature coefficient, Q10, the rate at a temperature divided by the rate ten degrees lower.
The second is increased vibration within the protein itself. The hydrogen and ionic bonds holding its tertiary structure are weak, and above a certain temperature they break faster than they re-form, the chain unfolds, and the active site is no longer complementary to the substrate.
Describe the drawing
Two graphs side by side. On the left, rate against temperature for one enzyme: the curve doubles every ten degrees up to a peak at forty degrees Celsius, then drops away far more steeply than it rose and reaches zero by about sixty. On the right, rate against pH for two enzymes: pepsin gives a narrow peak at pH two and trypsin a narrow peak at pH eight, each falling to nothing a few units either side.
The optimum is therefore the temperature at which the two effects balance: the highest temperature at which the gain in kinetic energy still outweighs the loss of activity to denaturation. Most human enzymes have an optimum near 37 to 40 °C. Taq polymerase, from a bacterium living in hot springs, has an optimum near 72 °C and survives brief periods at 95 °C, which is why it is used in PCR.
Distinguish cooling from heating. Taking an enzyme from 37 °C down to 4 °C reduces the rate through fewer successful collisions; the tertiary structure is intact and activity is restored on rewarming. Taking it from 37 °C up to 70 °C breaks bonds and the tertiary structure is lost, and activity is usually not recovered on cooling. A few small proteins can refold when conditions return, so denaturation is not universally irreversible, but for most enzymes it is not reversed by cooling.
Calculating Q10 and stating its limits
An enzyme gives an initial rate of 12 arbitrary units at 15 °C and 25 units at 25 °C. Calculate Q10, predict the rate at 35 °C, and say why the same method should not be used to predict the rate at 45 °C.
Show the working
Q10 is the ratio of the rates ten degrees apart: 25 ÷ 12 = 2.08, close to the doubling expected well below the optimum.
Predicting 35 °C means multiplying by that ratio once more: 25 × 2.08 = 52 units. Acceptable, because 35 °C is still on the rising part of the curve where kinetic energy is the only thing changing much.
At 45 °C the prediction would be 108 units, which the enzyme cannot reach. By then a significant fraction has denatured, so the second effect is no longer negligible and the curve has turned downwards. Q10 describes the rising limb only.
pH: charge, bonding and active-site shape
The pH curve is typically sharper than the temperature curve, and the mechanism is chemical rather than thermal.
Several of the twenty amino acids have side chains that carry a charge, and whether they carry it depends on the concentration of hydrogen ions around them. A change in pH protonates or deprotonates those side chains; the ionic bonds between them fail, hydrogen bonds are disrupted too, and the tertiary structure changes. The active site is a product of that structure, so its shape changes and the substrate stops being complementary. Charged groups taking part in the catalysis directly are affected as well.
Small deviations are reversible. Return the enzyme to its optimum and the bonds re-form. Large ones usually denature it for good, in the same way and for much the same reason as excessive heat.
Learn the optima as a set. Pepsin works in the stomach at around pH 2. Salivary amylase works in the mouth at around pH 7. Swallowing ends its work in two stages: stomach acid strips its activity first, an effect that on its own would be at least partly reversible, and pepsin then digests the amylase itself, which cannot be undone. Trypsin, secreted by the pancreas into the small intestine, works at around pH 8, which is why the pancreas also secretes hydrogencarbonate to neutralise the acid arriving from the stomach.
| Enzyme | Where it works | Optimum pH | What it acts on |
|---|---|---|---|
| Pepsin | Stomach | about 2 | Proteins |
| Salivary amylase | Mouth | about 7 | Starch |
| Trypsin | Small intestine | about 8 | Proteins |
| Catalase | Peroxisomes of most cells | about 7 | Hydrogen peroxide |
Substrate and enzyme concentration
The two concentration curves have different shapes, and the difference follows from which factor is limiting in each case.
Describe the drawing
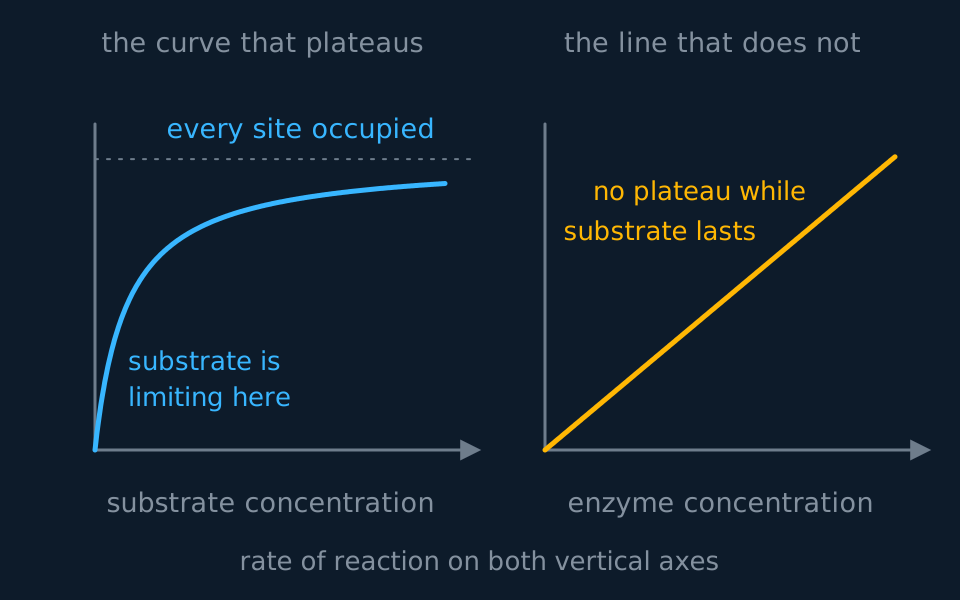
Two graphs side by side, both with rate of reaction up the vertical axis. On the left, rate against substrate concentration: the curve climbs steeply at first, bends over and flattens against a dashed horizontal line marking the maximum rate. On the right, rate against enzyme concentration: a straight line from the origin that keeps climbing with no plateau.
Raise the substrate concentration from zero and the rate climbs steeply. Active sites are sitting empty, so every extra substrate molecule finds one quickly and substrate concentration is the limiting factor. Keep going and the climb eases, because more and more of the sites are already occupied when the next substrate molecule arrives. Eventually the curve levels off: every active site is occupied as soon as it becomes free, and the rate is limited by the number of active sites and the rate at which each turns over. The enzyme is saturated, and the plateau height is Vmax. Adding more substrate beyond that point does not increase the rate.
Raising the enzyme concentration with substrate in excess gives a straight line through the origin. Twice the enzyme gives twice the number of active sites and twice the rate, with no plateau for as long as substrate remains in excess. If substrate becomes limiting, this line also levels off; include that qualification in a full answer.
TRY IT: Interpreting a plateau on a substrate curve
A student measures the initial rate of a catalase-catalysed reaction at five hydrogen peroxide concentrations. The rate rises with concentration up to 0.4 mol dm⁻³ and is then the same at 0.5 and 0.6 mol dm⁻³. She concludes that the enzyme has been denatured at the higher concentrations. Explain why that conclusion is wrong, and say what the plateau does show.
Check your answer
The conclusion does not fit the data. Denaturation at the higher concentrations would give a falling rate there, not a constant one. Hydrogen peroxide is a reactive oxidant and very high concentrations can damage catalase over a long run, which is a further reason for using initial rates, but a constant initial rate is not evidence of denaturation.
The plateau is consistent with saturation, which is the explanation to give. Above about 0.4 mol dm⁻³ every active site is occupied as soon as it becomes free, so substrate concentration has stopped being the limiting factor. What limits the rate now is the number of active sites available, which is set by the enzyme concentration, and the speed at which each site works.
Test that explanation with a prediction: adding more catalase should raise the rate again, while adding more peroxide should not. A plateau alone is consistent with saturation but does not prove it.
Enzyme rate practical: trypsin and milk
optional
AQA sets this as required practical 1: Investigation into the effect of a named variable on the rate of an enzyme-controlled reaction. Pearson Edexcel Biology A (9BN0) sets Core Practical 4: Investigate the effect of enzyme and substrate concentrations on the initial rates of reactions, and Core Practical 12: Investigate the effect of temperature on the initial rate of an enzyme-catalysed reaction, to include Q10. Pearson Edexcel Biology B (9BI0) sets Core Practical 1, on any one factor affecting the initial rate. OCR A assesses it in PAG4, and Cambridge International examines the same method in Papers 3 and 5. Casein makes a milk-powder suspension cloudy. Trypsin hydrolyses it to soluble peptides, so the suspension clears and its absorbance falls.
| Step | What to do | Why |
|---|---|---|
| 1 | Make the milk suspension and the trypsin solution in the same buffer, for example pH 8 | Hydrolysis can change the pH; the buffer holds it constant |
| 2 | Zero the colorimeter with buffer and trypsin but no milk, and keep one filter throughout | The reading is then the cloudiness of the milk alone |
| 3 | Stand the milk and the trypsin in separate tubes in the water bath for 10 minutes, and check each with a thermometer | Both start at the test temperature, so the reaction does too |
| 4 | Mix fixed volumes by syringe, start the stopwatch as they mix, and read the absorbance every 30 s for 5 minutes | Close early readings fix the shape of the curve near t = 0, where the tangent is drawn |
Without a colorimeter, keep the tube in the bath in front of a card marked with a cross, and time until the cross can be seen through the mixture.
Change one variable. For temperature, use baths at 20, 30, 40, 50 and 60 °C. For concentration, dilute one stock with buffer: 2, 4, 6 and 8 cm³ of 1% trypsin, each made up to 10 cm³, give 0.2, 0.4, 0.6 and 0.8%. The milk series is made the same way. Control the volumes, the pH, the temperature, the concentration that is not being varied, the batch of milk powder and the time in the bath. Boiled trypsin, cooled to the test temperature, shows that clearing needs active enzyme. Buffer in place of trypsin shows whether the milk clears or settles by itself. Run at least three repeats of each value.
Amylase and starch give a spotting-tile version. Put a drop of iodine solution in each well, and every 10 s transfer a drop of the reaction mixture to the next well. The end point is the first well that stays orange-brown.
Risk assessment. Enzymes can cause allergic reactions, especially as powders: avoid raising dust and wash off splashes. Anyone allergic to milk says so beforehand. Iodine solution stains skin and clothing. Wear eye protection, lift tubes from a hot bath with a holder, and keep cables clear of the water. Check the CLEAPSS Hazcard for each substance and your school's risk assessment before starting; where they differ from this page, follow them.
Enzyme rate practical: initial rate, 1/time and Q10
optional
These readings are idealised; real readings scatter about the curve.
| Time / s | Absorbance at 35 °C |
|---|---|
| 0 | 0.80 |
| 30 | 0.68 |
| 60 | 0.59 |
| 90 | 0.52 |
| 120 | 0.47 |
| 180 | 0.40 |
| 240 | 0.36 |
| 300 | 0.33 |
Initial rate from a tangent
Find the initial rate from the readings in the table, and compare it with the mean rate over the whole run.
Show the working
Plot absorbance against time and draw a smooth curve. At t = 0, rule a tangent that touches the curve without crossing it, as long as the graph allows. This one passes through (0, 0.80) and (100, 0.35).
Gradient = (0.35 − 0.80) ÷ 100 = −0.0045 s⁻¹. Absorbance is falling, so the initial rate is 0.0045 absorbance units per second.
The mean over 300 s is (0.80 − 0.33) ÷ 300 = 0.0016 s⁻¹, about a third of the initial rate, because casein was being used up throughout.
An end-point method gives a time, not a gradient. The rate is taken as 1/t, in s⁻¹, so twice the time means half the rate. That is a mean rate from mixing to the end point. It is close to the initial rate only when the end point comes early, before much substrate has gone. The iodine end point comes late, when almost all the starch has been hydrolysed.
Take the mean of the repeats at each value. A repeat far from the others is an anomaly: look for a cause, such as a late start, leave it out of the mean and say so. Where the ranges of neighbouring values overlap, the data do not show a difference between them.
Q10 from two runs
The same method at 25 °C gave an initial rate of 0.0021 s⁻¹. Calculate Q10 between 25 and 35 °C.
Show the working
Q10 = R(T + 10) ÷ R(T) = 0.0045 ÷ 0.0021 = 2.1.
From times to an end point, the ratio is inverted: a cross seen after 210 s at 25 °C and 100 s at 35 °C gives (1/100) ÷ (1/210) = 210 ÷ 100 = 2.1. Use temperatures below the optimum, where denaturation during the run is negligible.
| Limitation | Effect | Improvement |
|---|---|---|
| The cuvette cools or warms outside the bath | The run is not at the bath temperature | Read quickly, return the tube to the bath between readings, and check the temperature at the end |
| Delay between mixing and the first reading | The steepest part of the curve is missed | Start timing on mixing; use a data logger |
| End point judged by eye | Different times for the same rate | Use a colorimeter, or one observer against a colour standard |
| Milk powder settles | Absorbance falls without hydrolysis | Invert the cuvette before each reading; the no-enzyme tube shows the size of the effect |
| Trypsin denatures while equilibrating at 50 or 60 °C | The rate measured is below the rate at time zero | Equilibrate for the same time at every temperature, and no longer than the mixture needs |
| Spotting at 10 s intervals | The end point is known only to the nearest 10 s | Spot more often, or dilute the enzyme so the run is longer |
In the exam
- To explain the fall above the optimum temperature, state that hydrogen bonds and ionic interactions are disrupted, tertiary structure changes, the active site is no longer complementary to the substrate and fewer enzyme-substrate complexes form. Cooling reduces molecular kinetic energy and collision frequency; it does not reverse denaturation reliably.
- Below the optimum an enzyme is slowed but not denatured; above it, the tertiary structure is disrupted. State that distinction when a question cools a sample after heating it.
- On a substrate-concentration graph, name the limiting factor for each region separately: substrate concentration on the rising part, number of active sites or enzyme concentration at the plateau.
- Sketch the temperature curve with the fall steeper than the rise, and bring it down to the axis.
- 'Initial rate' means the tangent at time zero, or 1/time to a fixed early endpoint. A rate read from the middle of a run is a different quantity and cannot be compared across conditions.
- Quote values where they are known: 37 to 40 °C for most human enzymes, pH 2 for pepsin, pH 8 for trypsin.
- In a rate method, bring the enzyme and the substrate to the test temperature in separate tubes before mixing, name the buffer, and give a no-enzyme or boiled-enzyme control. A rate from 1/time is a mean rate to the end point.
Check yourself
Two students investigate how temperature affects amylase. One times how long a starch solution takes to stop giving a blue-black colour with iodine and calculates 1/time. The other measures the mass of reducing sugar formed after ten minutes. They disagree about whether 45 °C or 35 °C is better. Explain how the same enzyme can give them opposite answers, and say which method you would trust.
Answer
The two methods measure different quantities, and the difference is greatest at the temperature they disagree about.
Timing to an early end point is close to an initial-rate measurement. It samples the first part of the run, before much enzyme has denatured, so at 45 °C it records the genuinely high rate that the extra kinetic energy delivers. That method will report 45 °C as the better temperature.
Measuring product after ten minutes gives a mean rate over the whole period. At 45 °C the enzyme denatures steadily during those ten minutes, so the reaction that began quickly slows and may stop altogether, while at 35 °C the enzyme survives and keeps working. The mean rate over ten minutes can therefore be higher at 35 °C even though the initial rate is higher at 45 °C. Both students have measured correctly, but they have measured different quantities.
Which to trust depends on what is being asked. For how temperature affects the enzyme's activity, the initial-rate method is the fair comparison. For which temperature to run a ten-minute process at, the second student's answer applies. State that stability over time is a second variable, and that a full investigation would record a progress curve at each temperature.
Questions
Question 14 marks
Explain why the rate of an enzyme-catalysed reaction climbs gradually as the temperature is raised towards the optimum, and then falls steeply above it.
Mark scheme
- B1 raising the temperature gives the molecules more kinetic energy, so substrate and active site collide more often and with more energy
- B1 more of those collisions are successful, so more enzyme-substrate complexes form and the rate roughly doubles for each 10 °C rise
- B1 above the optimum the increased vibration breaks the hydrogen bonds and ionic bonds holding the tertiary structure, so the enzyme denatures
- B1 the active site is then no longer complementary to the substrate, and denaturation proceeds far faster than a doubling per 10 °C, which is why the fall is steeper than the climb
Question 24 marks
A student collects the oxygen released by catalase every thirty seconds for ten minutes and finds that the rate falls steadily throughout the run. Suggest three reasons for the fall, and suggest what she should measure instead if she wants to compare different temperatures fairly.
Mark scheme
- B1 substrate is being used up, so collisions between hydrogen peroxide and active sites become less frequent
- B1 hydrogen peroxide is a reactive oxidant and inactivates some of the catalase as the run goes on; product inhibition does not apply, since the products are water and oxygen
- B1 a fraction of the enzyme denatures over a long warm run
- B1 she should compare initial rates, taken from the gradient of the tangent at time zero or from 1/time to a fixed early end point
Question 34 marks
Compare a graph of initial rate against substrate concentration with a graph of initial rate against enzyme concentration when substrate is in excess, referring to the overall shape and to the limiting factor in each case.
Mark scheme
- B1 the substrate-concentration graph rises and then plateaus, whereas the enzyme-concentration graph, with substrate in excess, is a straight line through the origin with no plateau
- B1 the substrate-concentration graph plateaus because every active site becomes occupied as soon as it is vacated, so the number of active sites becomes limiting
- B1 on the enzyme-concentration graph, with substrate in excess, substrate concentration never becomes limiting, so doubling the enzyme keeps doubling the rate
- B1 both graphs pass through the origin, since no enzyme or no substrate gives no reaction
Question 44 marks
A student adds pepsin to a test tube of egg albumen at pH 8 and observes almost no digestion. Suggest why, and suggest what she should do differently to demonstrate pepsin's activity.
Mark scheme
- B1 pepsin's optimum pH is around 2, the acidity of the stomach
- B1 at pH 8 the hydrogen ion concentration is far from this optimum, so the ionic and hydrogen bonds holding pepsin's tertiary structure fail to hold it in shape, and the active site is not complementary to albumen
- B1 few or no enzyme-substrate complexes form, so almost no digestion occurs
- B1 she should repeat the investigation with the reaction mixture adjusted to a low pH, around pH 2, using dilute hydrochloric acid, to bring the enzyme close to its optimum
Question 54 marks
Explain why cooling an enzyme from 37 °C to 4 °C and then rewarming it to 37 °C restores its original rate of reaction, whereas heating the same enzyme to 70 °C and then cooling it back to 37 °C usually does not.
Mark scheme
- B1 cooling to 4 °C only reduces the kinetic energy of the enzyme and substrate molecules, so collisions between them become less frequent and less energetic, and the rate falls
- B1 the hydrogen and ionic bonds holding the enzyme's tertiary structure are not broken by cooling, so the active site keeps its shape and rewarming restores the original rate
- B1 heating to 70 °C breaks those hydrogen and ionic bonds, so the tertiary structure unfolds and the active site is no longer complementary to the substrate: the enzyme is denatured
- B1 cooling a denatured enzyme does not reform the original bonds in most cases, so the tertiary structure, and with it activity, is usually not recovered
Question 64 marks
An enzyme has an initial rate of 3.0 arbitrary units at 30 °C, and its Q10 over the range below its optimum is 2.0. Calculate the rate you would predict at 20 °C, and calculate the rate you would predict at 10 °C.
Mark scheme
- M1 going down ten degrees means dividing by Q10 rather than multiplying: rate at 20 °C = 3.0 ÷ 2.0
- A1 1.5 arbitrary units
- M1 rate at 10 °C = 1.5 ÷ 2.0
- A1 0.75 arbitrary units
Question 74 marks
A biologist wants to identify a bacterial enzyme's optimum pH by adding a fixed volume of enzyme extract to substrate solutions buffered at pH 4, 6, 8 and 10, and comparing the volume of product formed after twenty minutes at each pH. Evaluate this experimental design as a way of finding the true optimum pH.
Mark scheme
- B1 twenty minutes is not an initial rate, so a lower reading at an extreme pH could reflect a slower start, ongoing denaturation over the twenty minutes, or both, and the design cannot separate these
- B1 near the optimum the substrate may be used up well before twenty minutes, so several pH values give the same final volume and the readings cannot show which is fastest
- B1 testing only four pH values, two units apart, could miss an optimum that falls between them, for example at pH 7 if only 6 and 8 are tested
- B1 judgement: the design is a reasonable first survey to locate roughly where the optimum lies, but should be refined with initial-rate measurements and pH values spaced more closely once that rough region is found
Question 84 marks
A student investigated the effect of temperature on the initial rate at which trypsin clears a milk suspension. Explain why she kept the trypsin and the milk in separate tubes in the water bath for ten minutes before mixing them, why both were made up in a buffer, why she set up a tube of milk with boiled trypsin, and why she set up a tube of milk with buffer in place of trypsin.
Mark scheme
- B1 separate tubes bring enzyme and substrate to the test temperature before the reaction starts, so the initial rate is measured at that temperature and not during warming or cooling
- B1 hydrolysis can change the pH, and pH affects the enzyme's tertiary structure and rate, so the buffer keeps pH constant as a control variable
- B1 boiled trypsin is denatured, so no clearing in that tube shows that clearing in the test tubes is caused by active enzyme
- B1 the tube with buffer instead of trypsin shows whether the milk clears or settles by itself, so any change in absorbance without enzyme can be allowed for
Question 93 marks
Explain how a change in pH away from the optimum reduces the rate of an enzyme-catalysed reaction.
Mark scheme
- B1 a change in hydrogen ion concentration protonates or deprotonates the side chains, altering the charge they carry
- B1 ionic bonds between those side chains fail and hydrogen bonds are disrupted, so the tertiary structure shifts
- B1 the active site is a product of that structure, so its shape changes and the substrate is no longer complementary to it
Question 103 marks
An enzyme has an initial rate of 0.8 µmol per minute at 10 °C and 1.8 µmol per minute at 20 °C. Calculate the Q10 for this enzyme, and calculate the rate you would predict for it at 30 °C.
Mark scheme
- M1 Q10 is the rate at one temperature divided by the rate ten degrees lower, so 1.8 divided by 0.8
- A1 a Q10 of 2.25, or 2.3 to two significant figures
- A1 a predicted rate of 1.8 × 2.25 = 4.05, so about 4.1 µmol per minute at 30 °C
Question 113 marks
Describe the shape of a graph of initial rate against substrate concentration, and describe what is limiting the rate in each part of that graph.
Mark scheme
- B1 the rate climbs steeply from the origin and the climb then eases, before the curve levels off at a plateau
- B1 on the rising part the limiting factor is substrate concentration, because active sites are sitting empty and each extra substrate molecule finds one
- B1 at the plateau every active site is occupied, so the limiting factor is the number of active sites, set by the enzyme concentration
Question 123 marks
A disc of potato was placed in hydrogen peroxide solution and the oxygen released was collected. Calculate the mean rate of oxygen production over the first 20 s of the run, giving the unit.
Mark scheme
- M1 reads 24 cm³ from the curve at 20 s
- M1 mean rate = volume collected ÷ time taken = 24 ÷ 20
- A1 1.2 cm³ s⁻¹, with the unit
Question 133 marks
The rate of oxygen production over the whole 90 s of the run is lower than the rate over the first 20 s. Explain why, and explain why only an initial rate should be used to compare two enzymes.
Mark scheme
- B1 the gradient falls throughout the run, so the rate at any later moment is lower than the rate at the start
- B1 hydrogen peroxide is being used up, so fewer substrate molecules collide with active sites in a given time and the rate falls
- B1 the initial rate is the only one measured with the substrate concentration still at its starting value, so it is the only rate that compares the enzymes rather than how much substrate happened to be left
Question 143 marks
Describe the shape of a graph of initial rate against enzyme concentration when substrate is present in excess, and describe what would happen to that graph if the substrate concentration became limiting instead.
Mark scheme
- B1 the graph is a straight line through the origin: rate is directly proportional to enzyme concentration
- B1 this is because each extra enzyme molecule adds more active sites, and with excess substrate every site can find a substrate molecule
- B1 if substrate became limiting, the graph would level off at higher enzyme concentrations instead of climbing indefinitely, because there would not be enough substrate for the added active sites to bind
Question 153 marks
A student mixed trypsin with a milk suspension and recorded the absorbance as the suspension cleared. A tangent drawn to the absorbance-time curve at time zero passes through an absorbance of 0.90 at 0 s and 0.30 at 120 s. After 300 s the absorbance was 0.40. The data are idealised for this question. Calculate the initial rate, and calculate the mean rate over the first 300 s.
Mark scheme
- M1 initial rate is the gradient of the tangent: (0.90 − 0.30) ÷ 120
- A1 0.0050 absorbance units per second, or s⁻¹; accept 0.30 per minute
- B1 mean rate (0.90 − 0.40) ÷ 300 = 0.0017 absorbanceunits per second, or s⁻¹; accept 0.00167
Question 163 marks
A cross behind a tube of milk suspension and trypsin became visible after 150 s at 30 °C and after 70 s at 40 °C. The data are idealised for this question. Taking rate as 1/time, calculate the rate at each temperature and the Q10 between 30 and 40 °C.
Mark scheme
- M1 rates 1 ÷ 150 = 0.0067 s⁻¹ at 30 °C and 1 ÷ 70 = 0.014 s⁻¹ at 40 °C
- M1 Q10 = rate at 40 °C ÷ rate at 30 °C, or 150 ÷ 70
- A1 Q10 = 2.1; accept 2.14
Question 172 marks
Give the optimum pH of pepsin and the optimum pH of trypsin, naming where in the gut each of these enzymes works.
Mark scheme
- B1 pepsin has an optimum of about pH 2 and works in the stomach
- B1 trypsin has an optimum of about pH 8 and works in the small intestine
Question 182 marks
State the approximate optimum temperature of most human enzymes, and state what is meant by an enzyme's optimum temperature.
Mark scheme
- B1 most human enzymes have an optimum near 37 to 40 °C
- B1 the optimum temperature is the temperature at which the enzyme's rate of reaction is highest
Worth remembering
- Compare initial rates, never rates read part-way through a run.
- The temperature optimum is a balance between rising kinetic energy and rising denaturation, so the curve is lopsided: gentle up, steep down.
- Q10 is roughly 2 below the optimum, and meaningless above it.
- pH acts by changing charge on R groups, which breaks ionic and hydrogen bonds and alters the shape of the active site.
- Substrate concentration gives a curve that plateaus at saturation; enzyme concentration gives a straight line, for as long as substrate stays in excess.
CHECK YOUR PROGRESS
Rate how confident you are with each objective for this lesson. Ratings are saved in this browser, on this device, unless you sign in.
- Explain why the rate of an enzyme-catalysed reaction falls during a run, and why initial rate is the only fair comparison between conditions.
- Account for the shape of the temperature curve as the sum of two opposing effects, and calculate a Q10.
- Explain the effect of pH in terms of charge on R groups and the bonds that depend on it.
- Interpret a substrate-concentration curve, naming what is limiting the rate in each part of it.
- Draw all four curves with the right shape, including the asymmetry of the temperature curve.
- Measure the initial rate of an enzyme-controlled reaction with a buffer, separate equilibration and controls, and calculate Q10 from two of your own runs.
Open the full revision checklist to see every objective in the curriculum in one place.
Practise this lesson
WORKBOOK
The written questions from this topic, on paper with room to work, and a separate book of mark schemes. The 2 questions that are set on a diagram stay on this page, where the diagram can be drawn. Free to use; please do not redistribute or sell.
Used later in Limiting factors and primary productivity · Thermoregulation in endotherms and ectotherms · Industrial biotechnology and fermentation