Chemistry › Organic analysis › Chromatography: TLC, column and gas
Chromatography: TLC, column and gas
Chromatography separates a mixture by passing it through a stationary phase in a moving phase; each component travels at a speed set by how strongly it is held by one and how readily it dissolves in the other. Thin-layer chromatography gives Rf values, a column collects the separated components, and gas chromatography gives retention times and peak areas.
Key terms Every definition in organic analysis, lesson by lesson
Before this Electronegativity, polarity and intermolecular forces – polar groups and hydrogen bonding · Test-tube reactions for functional groups, and high-resolution mass spectrometry – the mass spectrum of a compound
COMMON MISCONCEPTION
A spot with the same Rf as a known compound must be that compound.
Many compounds share an Rf in one solvent, because Rf only summarises a balance between adsorption on the plate and solubility in the solvent. A match is consistent with identity, not proof of it. Running the plate in a second solvent, or comparing a mass spectrum, is needed before the spot can be named.
What you should be able to do
- Explain how a mixture is separated by the balance between adsorption to the stationary phase and solubility in the mobile phase.
- Calculate Rf values from a thin-layer chromatogram and use them to identify components against standards.
- Carry out the thin-layer chromatography practical, separating a mixture by TLC and locating colourless spots.
- Describe column chromatography and gas chromatography, and use retention times and peak areas to identify and compare components.
- Explain the advantage of GC–MS over GC alone, and state the limits of chromatography for identifying a compound.
- Describe high-performance liquid chromatography, and use a calibration curve of peak area against concentration.Edexcel
Two phases and a balance
Chromatography separates the components of a mixture because they move at different speeds through a material that holds them back. Black felt-tip ink, spotted on filter paper with the bottom of the paper in water, spreads into rings of blue, yellow and pink: the dyes in it travel at different speeds, and so they separate.
There are two phases. The stationary phase stays put: the paper, a layer of silica on a plate, or a liquid coated on a solid inside a tube. The mobile phase moves over it: a solvent or a gas. Each component of the mixture spends part of its time held on the stationary phase and part dissolved in the mobile phase, carried along.
The balance decides the speed. A component that is strongly adsorbed onto the stationary phase, or only slightly soluble in the mobile phase, spends most of its time stationary and moves slowly. One that is weakly held and very soluble moves almost as fast as the mobile phase. Different components strike different balances and so separate.
- Stationary phase
- The phase that does not move, on or in which the components of a mixture are held, such as silica on a TLC plate.
- Mobile phase
- The liquid or gas that moves through or over the stationary phase and carries the components with it.
- Adsorption
- The holding of molecules on the surface of a solid by intermolecular forces.
Thin-layer chromatography
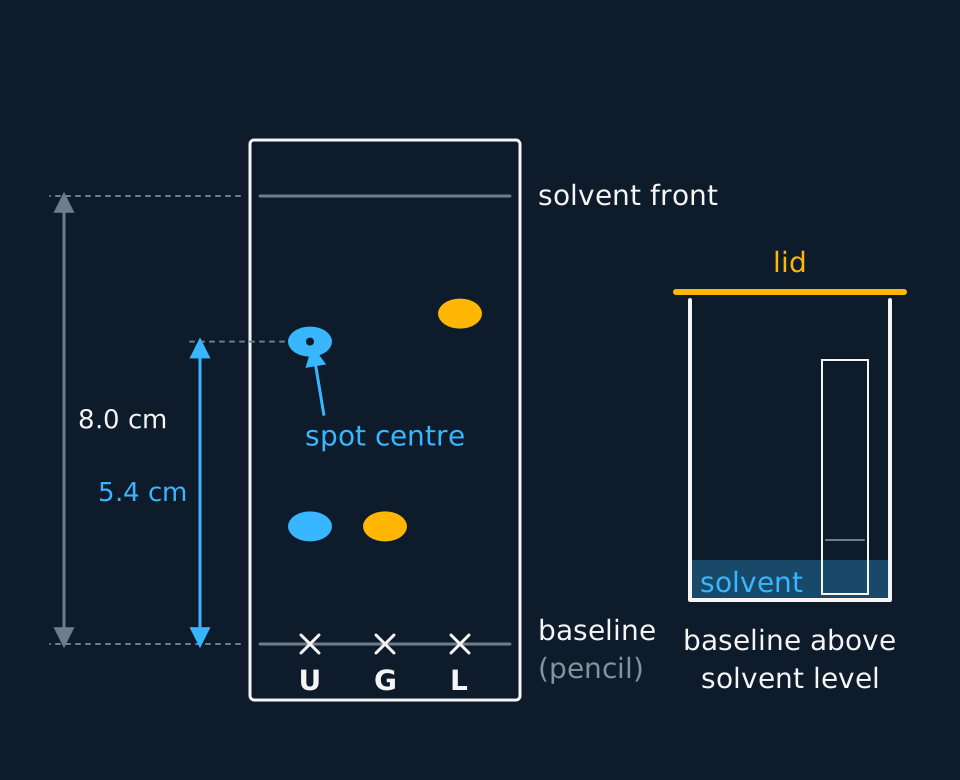
A TLC plate is a sheet of glass, aluminium or plastic coated with a thin layer of silica gel or alumina, the stationary phase. Spots of the samples go on a pencil line near the bottom, the plate stands in a little solvent in a covered tank, and the solvent rises through the layer by capillary action, carrying the components with it.
Silica is polar, its surface covered in O–H groups. Polar molecules, especially those that can hydrogen bond, are adsorbed strongly and move only a short distance. Non-polar molecules are held weakly and travel nearly as far as the solvent. A more polar solvent competes better for the silica surface and carries every component further.
Describe the drawing
A developed thin-layer plate with a pencil baseline near the bottom and the solvent front 8.0 cm above it. Three lanes are marked U, G and L. The unknown U has two spots, at 2.1 and 5.4 cm; glycine has one spot at 2.1 cm level with U's lower spot; leucine has one at 5.9 cm, above U's upper spot. Dimension arrows measure 5.4 cm from the baseline to the centre of U's upper spot and 8.0 cm to the front. An inset shows the plate in a lidded beaker with the solvent below the baseline.
Each component is described by its Rf value, the distance the spot travels as a fraction of the distance the solvent travels. It has no unit and always lies between 0 and 1. It is constant for one compound only on the same stationary phase, with the same solvent and at the same temperature.
Rf = distance moved by the spot ÷ distance moved by the solvent front
- Rf value
- The distance moved by a component divided by the distance moved by the solvent front, both measured from the baseline.
- Solvent front
- The furthest point reached by the solvent on a chromatogram, marked as soon as the plate is removed from the tank.
Rf values from a plate
On a TLC plate the solvent front is 8.0 cm above the baseline. An unknown amino acid mixture gives spots at 2.1 cm and 5.4 cm. Standards run on the same plate give glycine at 2.1 cm and leucine at 5.9 cm. Calculate the Rf values and identify what can be identified.
Show the working
Rf of the lower spot = 2.1 ÷ 8.0 = 0.26. Rf of glycine = 2.1 ÷ 8.0 = 0.26.
Rf of the upper spot = 5.4 ÷ 8.0 = 0.68. Rf of leucine = 5.9 ÷ 8.0 = 0.74.
The lower spot matches glycine run on the same plate, so the mixture probably contains glycine. The upper spot does not match leucine, so it is some other amino acid, which needs another standard to name.
Many organic compounds are colourless, so the spots have to be made visible. A plate with a fluorescent additive glows under ultraviolet light and the compounds show as dark spots, which are circled in pencil. Iodine vapour in a closed jar stains most organic spots brown. Ninhydrin sprayed on and warmed turns amino acids purple.
Required practical 12: separating amino acids by TLC
AQA required practical; optional reading for other boards
AQA sets this as required practical 12: separation of species by thin-layer chromatography. The method below separates amino acids; food dyes or analgesics work the same way, located by eye or by ultraviolet light.
Apparatus: a silica TLC plate held by its edges in gloves, a pencil and ruler, capillary tubes, a beaker with a watch-glass lid as the tank, the solvent (butan-1-ol, ethanoic acid and water in the ratio 12:3:5 is a common choice for amino acids), solutions of the unknown and of known amino acids, ninhydrin spray and an oven or hairdryer.
| Step | What to do | Why |
|---|---|---|
| 1 | Draw a pencil line 1 cm from the bottom of the plate and mark evenly spaced crosses on it | Pencil is graphite and does not dissolve or run; ink would |
| 2 | Spot the unknown and each standard on its own cross with a capillary tube; let it dry and re-spot to keep each spot small | Small, concentrated spots give compact, separate spots on the chromatogram |
| 3 | Pour solvent into the tank to a depth below 1 cm, cover it and leave it for a few minutes | The baseline must be above the solvent, or the spots dissolve into it; the lid saturates the air with vapour |
| 4 | Stand the plate in the tank, replace the lid and leave it until the solvent is about 1 cm from the top | The lid stops solvent evaporating from the plate as it rises |
| 5 | Remove the plate and at once mark the solvent front in pencil | The front is invisible once the solvent evaporates |
| 6 | Dry the plate in a fume cupboard, spray with ninhydrin and warm; circle each purple spot | Amino acids are colourless until ninhydrin reacts with them |
| 7 | Measure from the baseline to the centre of each spot and to the front, and calculate each Rf | Rf values from one plate are directly comparable |
The errors that matter: spots that are too large or too concentrated streak and overlap, so the distance to the centre is uncertain. Touching the face of the plate leaves amino acids from the skin, which ninhydrin shows up as extra spots. A tank without a lid lets the solvent evaporate from the plate, so the front runs unevenly. Running the standards on the same plate as the unknown removes any difference in solvent, temperature or plate between runs.
Risk assessment. The solvent mixture is flammable and ethanoic acid is corrosive; keep it away from flames and use it in a well-ventilated room. Ninhydrin is harmful and is sprayed only in a fume cupboard. Ultraviolet light damages eyes, so never look into the lamp. Wear eye protection and gloves. Check the CLEAPSS Hazcards and the school's risk assessment; where they differ from the advice here, follow them.
Column chromatography
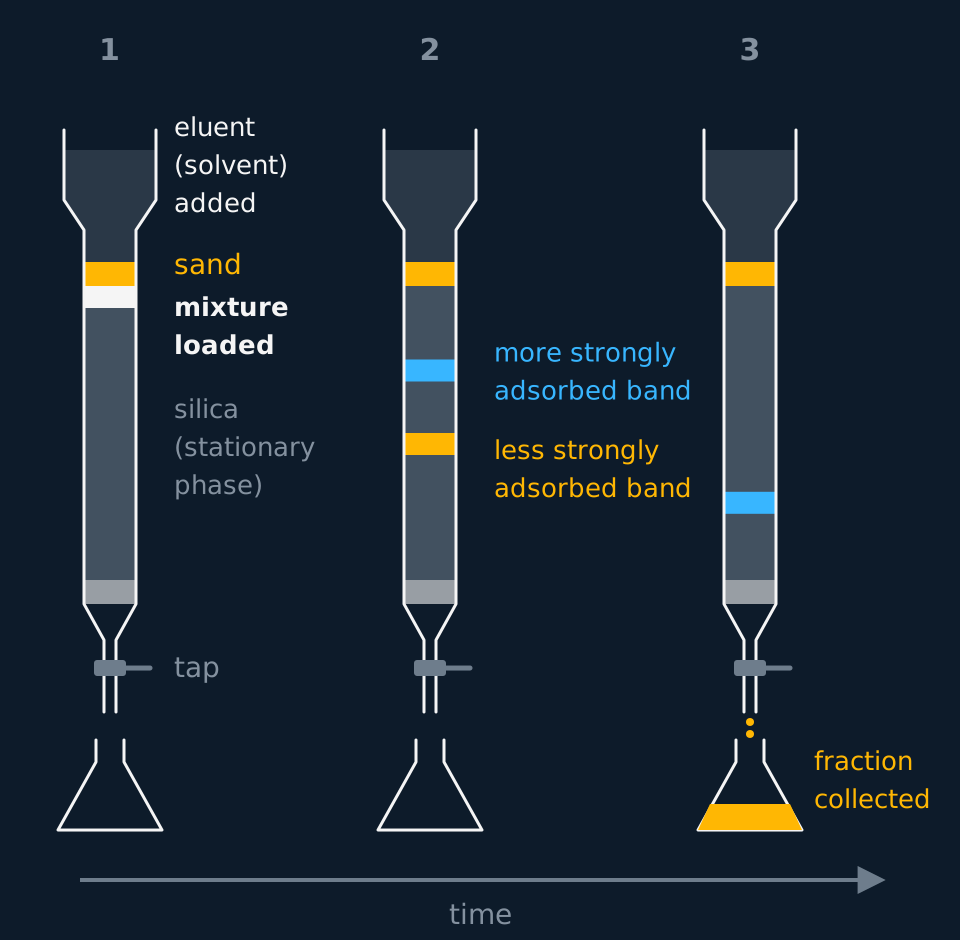
TLC separates a few micrograms on a plate. To separate grams and keep the components, the same stationary phase is packed into a vertical glass column with a tap at the bottom. Silica or alumina is poured in as a slurry with the solvent, so no air bubbles are trapped, the mixture is added at the top, and more solvent, the eluent, is run through continuously.
Describe the drawing
Three snapshots of a glass chromatography column side by side, each with a solvent reservoir, a sand layer, a tall silica bed, a cotton wool plug, a tap and a flask. In the first a single band of mixture sits at the top of the silica. In the second it has split into an amber band halfway down, the less strongly adsorbed component, and a cyan band a quarter of the way down. In the third the amber band has dripped into the flask while the cyan band is still in the column. An arrow marked time runs beneath.
The components move down as separate bands and leave the column at different times. Each is collected in its own flask as a fraction, and the solvent is evaporated to recover it. Column chromatography is the standard way to purify a product in a research laboratory.
The solvent can be changed during the run. Starting with a non-polar eluent such as hexane washes the least polar component through first while the others stay near the top. Switching to a more polar eluent, a mixture of hexane and ethyl ethanoate, then moves the more strongly adsorbed components. A chemist chooses the eluent by running TLC plates first: a solvent that gives the wanted compound an Rf of about 0.3 on a plate separates it well in a column of the same stationary phase.
- Eluent
- The solvent run continuously through a chromatography column as the mobile phase, carrying the components down it.
Gas chromatography and GC–MS
In gas chromatography the mobile phase is an unreactive carrier gas, usually helium or nitrogen. The stationary phase is a liquid with a high boiling point coated on the inside of a long, thin coiled column, or on a solid support packed into it, inside an oven. A tiny sample is injected, vaporises, and is carried through. Components that are more soluble in the liquid, or less volatile, take longer to come out.
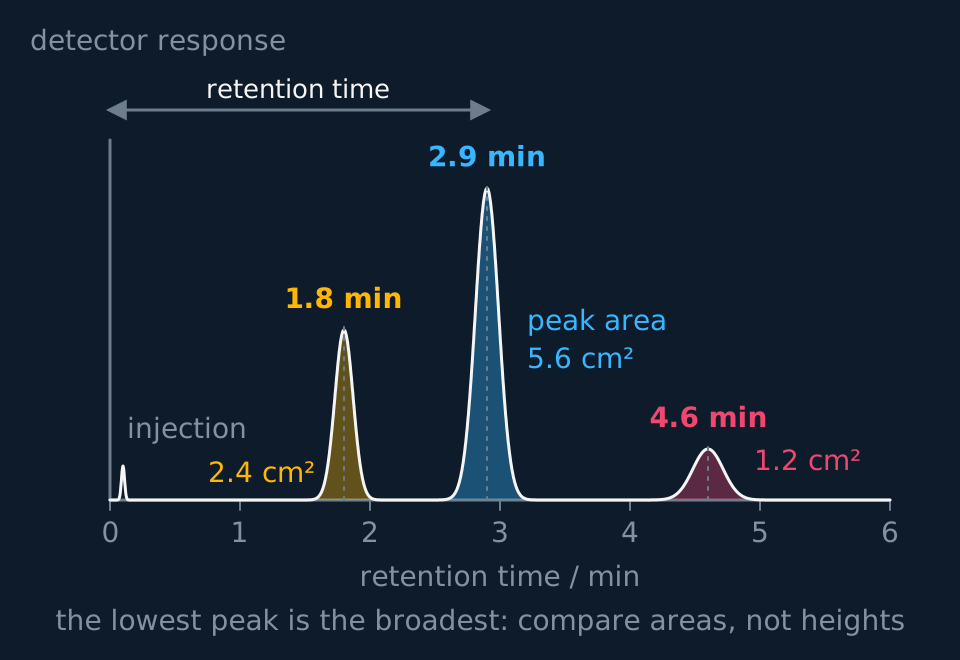
A detector at the end records each component as a peak. The time from injection to the peak is the retention time. Under fixed conditions of column, temperature and gas flow rate it is the same for a given compound, so a component is identified by running a known standard under the same conditions and matching the time.
Two properties set the retention time. A component with a low boiling point spends more of its time as vapour in the carrier gas and comes out early. A component with stronger intermolecular forces to the liquid stationary phase dissolves in it more and comes out late. Raising the oven temperature shortens every retention time, and a longer column separates components with similar times better but takes longer to run.
Describe the drawing
A gas chromatogram, detector response against retention time from 0 to 6 minutes. A small injection spike sits at the start, then three peaks with their areas shaded: a sharp peak at 1.8 minutes of area 2.4 cm², the tallest at 2.9 minutes of area 5.6 cm², and a low, visibly broader peak at 4.6 minutes of area 1.2 cm². A dimension arrow marks the retention time from injection to the middle peak.
- Retention time
- The time taken for a component to pass from the injection point to the detector in gas chromatography.
- Carrier gas
- The unreactive gas, usually helium or nitrogen, that is the mobile phase in gas chromatography.
The area under each peak is proportional to the amount of that component. The percentage of a component is its peak area divided by the total area of all the peaks, assuming the detector responds equally to each of them.
Percentage composition from peak areas
A sample of a solvent mixture gives three peaks with areas of 2.4, 5.6 and 1.2 cm². Calculate the percentage of each component.
Show the working
Total area = 2.4 + 5.6 + 1.2 = 9.2 cm².
First component: 2.4 ÷ 9.2 × 100 = 26%. Second: 5.6 ÷ 9.2 × 100 = 61%. Third: 1.2 ÷ 9.2 × 100 = 13%.
So the mixture is 26%, 61% and 13%, to two significant figures as the areas were given. The three add to 100%, which is the check.
TRY IT: Is the ethanol pure
A sample of ethanol made by fermentation and distilled gives a gas chromatogram with two peaks: retention time 2.1 min, area 47.6 units; retention time 3.4 min, area 2.4 units. Pure ethanol run under the same conditions has a retention time of 2.1 min. Calculate the percentage of ethanol and comment on the second peak.
Check your answer
The peak at 2.1 min matches the ethanol standard, so it is ethanol. Total area = 47.6 + 2.4 = 50.0 units.
Percentage of ethanol = 47.6 ÷ 50.0 × 100 = 95.2%.
The peak at 3.4 min is an impurity making up 4.8%. GC cannot name it from the retention time alone; a standard of a suspected impurity, or a mass spectrum, would.
In GC–MS the column outlet feeds straight into a mass spectrometer, which can name a component, such as that impurity, for which no standard was run. GC separates the components and gives a retention time; the mass spectrometer records the mass spectrum of each as it emerges, and a computer matches it against a database. Forensic scientists, airport security and drug testing laboratories use it to identify traces in a mixture.
Chromatography has limits as a means of identification. Compounds with similar properties can have the same Rf or the same retention time. A match needs a standard of the right compound run under the same conditions, so a compound nobody has thought to test for, or a new one, cannot be identified. A matching Rf is therefore evidence, not proof, and GC is often paired with a mass spectrometer. Write 'consistent with' rather than 'proves' when a spot or a peak matches a standard.
Other boards: external calibration and HPLC
OCR assesses TLC within its practical endorsement, Edexcel sets Rf values in its written papers, and Cambridge examines the method in its practical papers.
Peak areas give percentages only if the detector responds equally to every component, and it rarely does exactly. To measure the concentration of one compound, the instrument is calibrated with that compound. Solutions of it at several known concentrations are run under the same conditions, the area of its peak is measured for each, and area is plotted against concentration. The sample is then run and its concentration read from the line. OCR sets this external calibration by name.
Ethanol in a blood sample
Standards of ethanol at 20, 40, 60 and 80 mg per 100 cm³ give ethanol peaks of area 1.05, 2.10, 3.15 and 4.20 units. A blood sample run under the same conditions gives an ethanol peak of area 2.73 units. Calculate the concentration of ethanol in the blood and compare it with the driving limit in England and Wales, 80 mg per 100 cm³.
Show the working
Area is proportional to concentration: 1.05 ÷ 20 = 0.0525 and 4.20 ÷ 80 = 0.0525 units per mg per 100 cm³. The calibration line passes through the origin with this gradient.
Concentration = 2.73 ÷ 0.0525 = 52.0 mg per 100 cm³, to three significant figures as the areas were given.
This is below the limit of 80 mg per 100 cm³. Read from a plotted calibration line, the answer is the same.
- Calibration curve
- A graph of peak area against concentration for standards of known concentration, from which the concentration in a sample is read.
Gas chromatography needs a sample that vaporises without decomposing. Many drugs, sugars and food dyes do not, and for them the mobile phase is a liquid instead. In high-performance liquid chromatography, HPLC, the stationary phase is silica in particles a few micrometres across, packed into a narrow steel column; often hydrocarbon chains are bonded to the silica so that its surface is non-polar. A pump forces the liquid mobile phase through at high pressure, because the tiny particles pack so tightly that the solvent would barely move under gravity.
The small particles give a very large surface area, so the components separate far more sharply than in an ordinary column. A detector at the outlet, often one measuring ultraviolet absorption, records each component as a peak. As in GC, a component is identified by its retention time against a standard run under the same conditions, its amount comes from the peak area and a calibration curve, and the column can feed a mass spectrometer. Edexcel sets HPLC by name, alongside GC, and a calibration curve from HPLC peak areas is calculated exactly as for GC.
| TLC | Column | GC | HPLC | |
|---|---|---|---|---|
| Stationary phase | Silica or alumina on a plate | Silica or alumina in a glass column | High-boiling liquid on a solid support | Fine silica particles in a steel column |
| Mobile phase | Solvent rising by capillary action | Solvent running down under gravity | Unreactive carrier gas | Solvent pumped at high pressure |
| Identifies by | Rf against a standard | TLC of each fraction | Retention time against a standard | Retention time against a standard |
| Measures amount | No | Mass of each fraction recovered | Peak area | Peak area |
| Suited to | Quick checks on micrograms | Purifying grams of product | Volatile compounds stable when heated | Involatile or heat-sensitive compounds |
- HPLC
- High-performance liquid chromatography, in which a liquid mobile phase is pumped at high pressure through a column packed with very small particles of stationary phase.
In the exam
- Give Rf as a decimal with no unit, both distances measured from the baseline, and the spot distance measured to its centre. Schemes reject an Rf greater than 1, which can only come from dividing the wrong way round.
- A TLC method earns its marks for a pencil baseline above the solvent level, a covered tank, and the solvent front marked at once; each needs its reason for the full credit.
- For a separation, say what each component is attracted to: 'more strongly adsorbed onto the stationary phase' or 'more soluble in the mobile phase'. 'Absorbed' for 'adsorbed' is not accepted.
- For a percentage from GC, use the areas of the peaks, not their heights, and divide each by the total area.
- Identifying by Rf or retention time needs a standard run under the same conditions. A match is consistent with an identity, not proof of it.
Check yourself
Two amino acids have the same Rf value, 0.45, on a silica plate run in solvent A. A student says they cannot be separated by TLC. Explain whether she is right.
Answer
She is right only for solvent A. The Rf of a compound depends on its balance between adsorption to the stationary phase and solubility in the mobile phase, and changing the solvent changes the second half of that balance.
The two amino acids have different structures, so their solubilities change by different amounts in a new solvent. Run in solvent B, they will usually give different Rf values and separate.
A plate can even be run in solvent A, dried, turned through 90° and run in solvent B: two-way chromatography. Spots that overlapped in the first direction separate in the second.
Questions
Question 16 marks
Describe how thin-layer chromatography is used to identify the amino acids in a mixture, using standards of known amino acids.
Mark scheme
Indicative content
- a pencil baseline is drawn about 1 cm from the bottom of a silica plate, handled only by its edges
- small spots of the mixture and of each standard are placed on the baseline with capillary tubes and allowed to dry
- the plate stands in a covered tank of solvent whose level is below the baseline, until the solvent nears the top
- the solvent front is marked in pencil as soon as the plate is removed, and the plate is dried
- the plate is sprayed with ninhydrin in a fume cupboard and warmed, so the amino acids show as purple spots
- the Rf of each spot is calculated and compared with the standards on the same plate; a match identifies the amino acid
Levels
- Level 3 (5–6 marks) all stages are present in order: the pencil baseline, small spots of the mixture and each standard, the covered tank with the solvent below the baseline, marking the solvent front, developing with ninhydrin in a fume cupboard, and the Rf comparison with standards on the same plate
- Level 2 (3–4 marks) the plate is spotted, run and compared with the standards; the solvent level below the baseline, the marked solvent front, the ninhydrin step or the Rf values are not there
- Level 1 (1–2 marks) the mixture is spotted and run, often with the baseline drawn in ink or the solvent above the spots, and the colourless amino acids are never made visible
Question 24 marks
Calculate the Rf value of each spot given by a mixture of two amino acids, at 2.9 cm and 6.1 cm from the baseline with the solvent front 7.6 cm from it, and identify each amino acid from the Rf values in the table, measured on the same kind of plate in the same solvent.
| Amino acid | Rf |
|---|---|
| Serine | 0.27 |
| Alanine | 0.38 |
| Valine | 0.60 |
| Phenylalanine | 0.80 |
Mark scheme
- M1 Rf = distance moved by the spot ÷ distance moved by the solvent front = 2.9 ÷ 7.6
- A1 Rf = 0.38, with no unit, so the lower spot is alanine
- M1 Rf of the upper spot = 6.1 ÷ 7.6
- A1 Rf = 0.80, to two significant figures, so the upper spot is phenylalanine; reject an answer with a unit
Question 34 marks
Calculate the percentage of each component in a mixture from the gas chromatogram peak areas in the table, assuming the detector responds equally to each.
| Retention time / min | Peak area / cm² |
|---|---|
| 1.5 | 3.6 |
| 2.2 | 8.1 |
| 3.0 | 1.3 |
| 4.4 | 2.0 |
Mark scheme
- M1 total area = 3.6 + 8.1 + 1.3 + 2.0 = 15.0 cm²
- M1 percentage of each = its area ÷ 15.0 × 100; reject the use of peak heights
- A1 24% and 54% for the first two components
- A1 8.7% and 13% for the last two, to two significant figures
All 20 questions with mark schemes, the other 17 set out in full on the question page.
Worth remembering
- 'The polar one moves less' is incomplete without saying it is more strongly adsorbed onto the stationary phase.
- Measure Rf to the centre of the spot and from the baseline, not from the edge of the plate.
- An ink baseline, or one below the solvent, ruins the plate before it is run.
- Peak heights understate a broad peak: compare areas.
- An Rf from another day's plate cannot identify anything.
CHECK YOUR PROGRESS
Rate how confident you are with each objective for this lesson. Ratings are saved in this browser, on this device, unless you sign in.
- Explain how a mixture is separated by the balance between adsorption to the stationary phase and solubility in the mobile phase.
- Calculate Rf values from a thin-layer chromatogram and use them to identify components against standards.
- Carry out the thin-layer chromatography practical, separating a mixture by TLC and locating colourless spots.
- Describe column chromatography and gas chromatography, and use retention times and peak areas to identify and compare components.
- Explain the advantage of GC–MS over GC alone, and state the limits of chromatography for identifying a compound.
- Describe high-performance liquid chromatography, and use a calibration curve of peak area against concentration.Edexcel
Open the full revision checklist to see every objective in the curriculum in one place.
Practise this lesson
WORKBOOK
The written questions from this topic, on paper with room to work, and a separate book of mark schemes. The 5 questions that are set on a diagram stay on this page, where the diagram can be drawn. Free to use; please do not redistribute or sell.