Maths › Further Statistics 2 › Correlation coefficients: product moment and Spearman
Correlation coefficients: product moment and Spearman
The product moment correlation coefficient measures how close a set of points lies to a straight line; Spearman's rank coefficient measures only how far the two orderings agree. Both take values between −1 and 1, and they answer different questions.
Builds on Least squares regression and residuals and Correlation and regression.
IN THIS TOPIC
- Calculate the product moment correlation coefficient from summary statistics.
- State the conditions under which it is the appropriate measure.
- Predict the effect of coding on it without recalculating.
- Rank data, handle ties, and calculate Spearman's coefficient.
- Say what each coefficient measures and the values it can take.
COMMON MISCONCEPTION
A correlation coefficient near zero means the two variables are unrelated.
The product moment coefficient measures linear association only. Points lying exactly on a parabola can give r near zero while one variable determines the other, so a small r indicates little linear association and rules out no other relationship. Read it beside the scatter diagram, and rank the data for Spearman's coefficient when the association is monotonic without being linear.
Product moment correlation
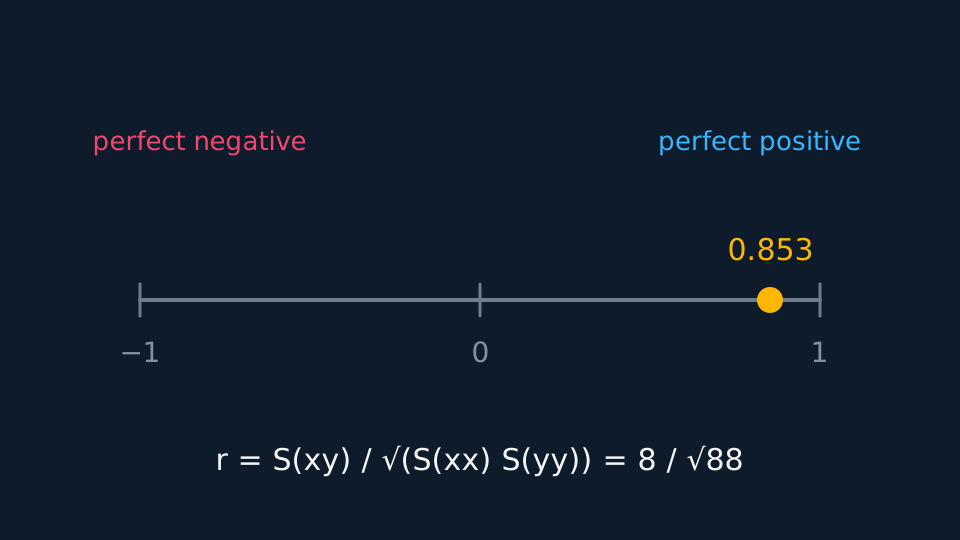
The product moment correlation coefficient scales the covariance so that it always lies between −1 and 1:
Pearson Edexcel 9FM0 formulae booklet: included, under Correlation and regression, with three equivalent expanded forms, and critical values for r tabulated separately. It measures linear association only. Points lying exactly on a parabola can give r near zero while one variable determines the other. A small r therefore indicates little linear association; it does not rule out a non-linear relationship. Examine the scatter diagram alongside the value.
Three conditions apply before quoting r. The two variables must both be quantitative. The association being described must be a linear one. And r is sensitive to a single extreme point, so identify outliers first: one extreme reading can change a coefficient substantially.
WORKED EXAMPLE
The coefficient from summary statistics
For the five points (1, 2), (2, 4), (3, 5), (4, 4), (5, 6), find r.
From before, Sxx = 10 and Sxy = 8, and Syy = 97 − 21²/5 = 8.8.
r = 8/√(10 × 8.8) = 8/√88 = 0.853 to three decimal places.
Strong positive linear correlation, which matches the scatter and the small residual sum of squares found earlier.
What coding does to r
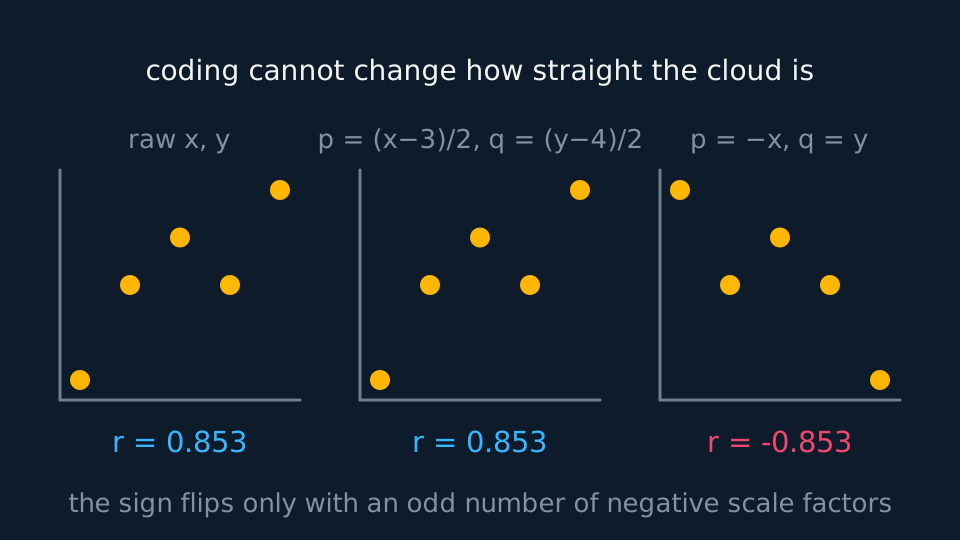
Coding by a linear rule cannot alter how straight the scatter is, so it cannot alter the size of r. Replace x by (x − a)/b and y by (y − c)/d, and the coefficient of the coded data has exactly the same magnitude as the original.
The sign is the one thing that can move. When b and d are both positive, r is unchanged outright. When exactly one of them is negative, one axis has been reflected and r changes sign. Two negatives cancel and leave r unchanged. So r can be computed from the coded totals and then stated for the original data, with the sign adjusted if exactly one scale factor is negative.
Describe the drawing
Three small scatter graphs of the same five points. The raw data and the positively coded data make identical rising clouds, both with a correlation of nought point eight five three. In the third panel the x-axis has been flipped by a negative scale factor, the cloud falls instead of rises, and the coefficient is minus nought point eight five three, the same size with the opposite sign.
WORKED EXAMPLE
Coding in practice
Heights x in cm and masses y in kg are coded as p = (x − 150)/5 and q = y − 60. The coded data give r = 0.74. State r for the original data.
Both scale factors are positive, being 1/5 and 1, so the sign and the size both survive.
r = 0.74 for the original heights and masses; recomputing from the raw values returns the same coefficient.
Spearman's rank correlation coefficient
Spearman's rank correlation coefficient replaces each value by its rank and measures how well the two orderings agree. It is the appropriate measure when the data are already ranks, when the association is monotonic without being linear, or when an extreme value would distort the product moment coefficient. It uses only the order of the observations, not the sizes of the gaps between them.
Pearson Edexcel 9FM0 formulae booklet: included, directly under the product moment coefficient, with Spearman's critical values tabulated alongside those for r. Here d is the difference in ranks for each item.
For Spearman's coefficient, assign tied observations their mean rank, so two items tied for third and fourth both take 3.5. The shortcut formula above is exact without ties; with ties, calculate the product moment correlation of the ranks, or use the calculator procedure required by the board. State which you used. Pearson Edexcel 9FM0 sets numerical Spearman questions that may contain tied ranks; Cambridge OCR H245 excludes tied ranks from them.
GUIDED PRACTICE
Two judges disagree slightly
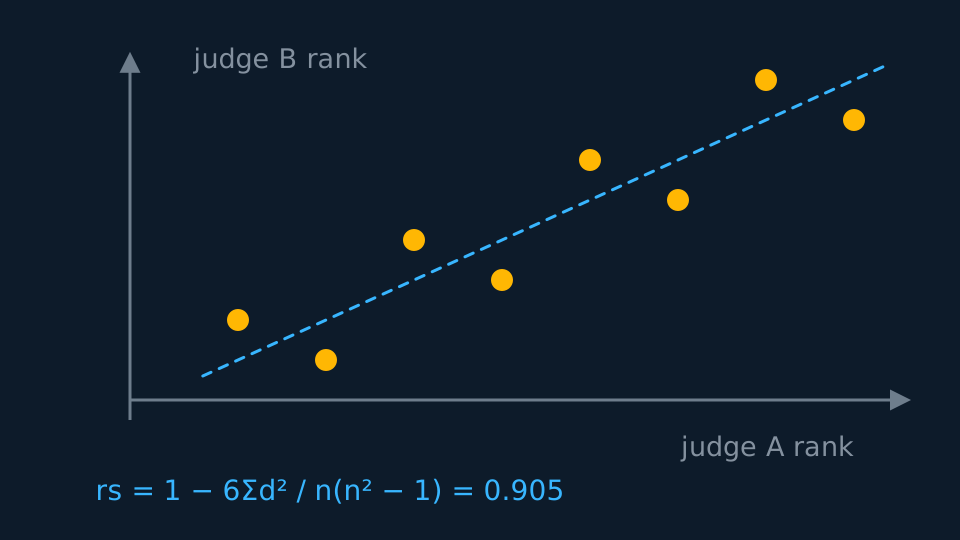
Judge A ranks eight competitors 1 to 8 in order. Judge B ranks them 2, 1, 4, 3, 6, 5, 8, 7. Calculate Spearman's coefficient and interpret it.
Show the working
The differences are −1, 1, −1, 1, −1, 1, −1, 1, so d² = 1 each time and Σd² = 8.
n(n² − 1) = 8 × 63 = 504, so rs = 1 − 48/504 = 1 − 0.0952.
That is 0.905 to three decimal places. The judges agree very closely, differing only by swapping adjacent pairs.
ASSESSMENT FOCUS
- Quote the formula and show the summary statistics substituted into it.
- Say what r measures in context, and add that it detects linear association only.
- For Spearman, set the ranks out in a table with a d column and a d² column.
- Coding leaves the size of r alone, so state the coded value as the answer instead of recalculating.
CHECK YOURSELF
Six items are ranked by two people. The rank differences are 1, −1, 0, 2, −1, −1. Find Spearman's coefficient.
Show a hint
Square, sum, then substitute with n = 6.
Show the answer
Σd² = 1 + 1 + 0 + 4 + 1 + 1 = 8. n(n² − 1) = 6 × 35 = 210, so rs = 1 − 48/210 = 1 − 0.2286 = 0.771 to three decimal places.
The product moment coefficient r = S(xy)/√(S(xx)S(yy)) measures linear association only, and linear coding leaves its size unchanged.
Spearman's rs = 1 − 6Σd²/[n(n² − 1)] measures agreement of orderings and is exact without ties; tied values take the mean rank, and with ties the product moment correlation of the ranks is the exact coefficient.
WORKBOOK
Printable practice for this topic: original exam-style questions with room to work, and a fully worked answer book. Free to use; please do not redistribute or sell.
Or read them with their worked answers on the correlation coefficients: product moment and Spearman questions page.
CHECK YOUR PROGRESS
Rate how confident you feel with each objective for this lesson. Ratings are saved in this browser, on this device, unless you sign in.
- Calculate the product moment correlation coefficient from summary statistics.
- State the conditions under which it is the appropriate measure.
- Predict the effect of coding on it without recalculating.
- Rank data, handle ties, and calculate Spearman's coefficient.
- Say what each coefficient measures and the values it can take.
Open the full revision checklist to see every objective in the course in one place.