Maths › Further Statistics 2 › The continuous uniform distribution
The continuous uniform distribution
The continuous uniform distribution has a constant density over an interval, so probabilities are proportions of length. It is used to model rounding error and a wait for a regularly repeating event. Write down its density and distribution function and derive its mean and variance from the general integrals.
Builds on Mean, variance and skewness and Density and distribution functions and Definite integrals and areas.
IN THIS TOPIC
- Write down the density and distribution function of U(a, b) and read probabilities off as lengths.
- Derive its mean and variance from the general integrals.
COMMON MISCONCEPTION
The variance of the uniform distribution on a to b is (b − a)²/4, since the range is b − a.
The denominator is 12: Var(X) = (b − a)²/12, so the standard deviation is (b − a)/√12, about 29% of the range. Dividing by 4 would make it half the range instead. Integrating x² against the constant density 1/(b − a) across the interval and subtracting the square of the midpoint (a + b)/2 produces the 12.
The density and distribution function
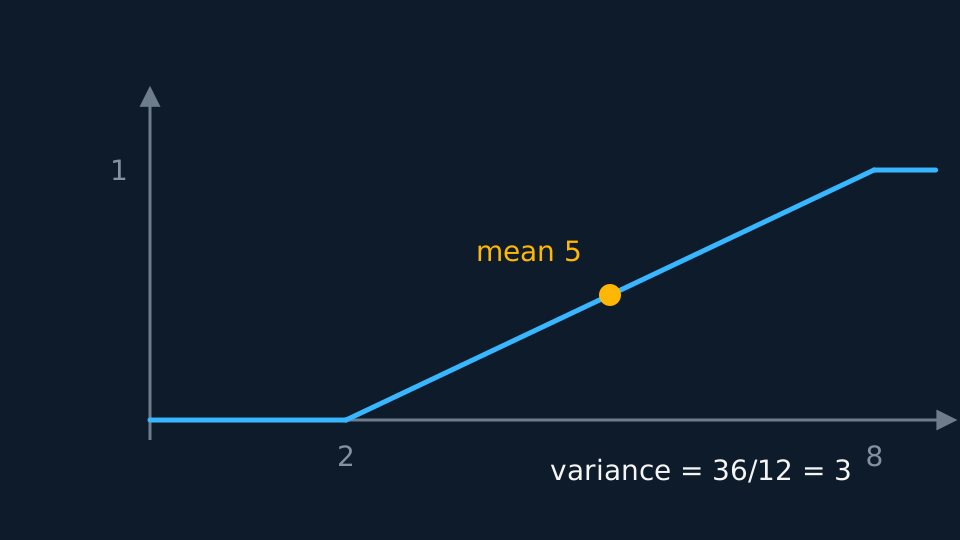
If X is equally likely to fall anywhere in [a, b] then the density must be flat, and its area must be 1, so its height is 1/(b − a). Integrating gives a straight ramp for the distribution function, and the ramp is only the middle of it. F is a function of every real x, so all three branches are part of the answer:
The two flat branches are what make it a distribution function at all: F runs to 0 far to the left and to 1 far to the right, and the ramp already gives 0 at a and 1 at b, so both joins are continuous. Quoting the ramp alone leaves F undefined outside [a, b].
Pearson Edexcel 9FM0 formulae booklet: the uniform density, mean and variance are included; this piecewise F is not, so reproduce it by integrating the constant density. Probabilities are proportions of length, so P(c < X < d) is (d − c)/(b − a) for any interval inside the range. Rounding to the nearest unit is commonly modelled by an error distributed as U(−0.5, 0.5), and a wait for a service arriving every T minutes, joined at a random moment, as U(0, T). Both are modelling assumptions and should be stated as such.
WORKED EXAMPLE
Reading off a uniform model
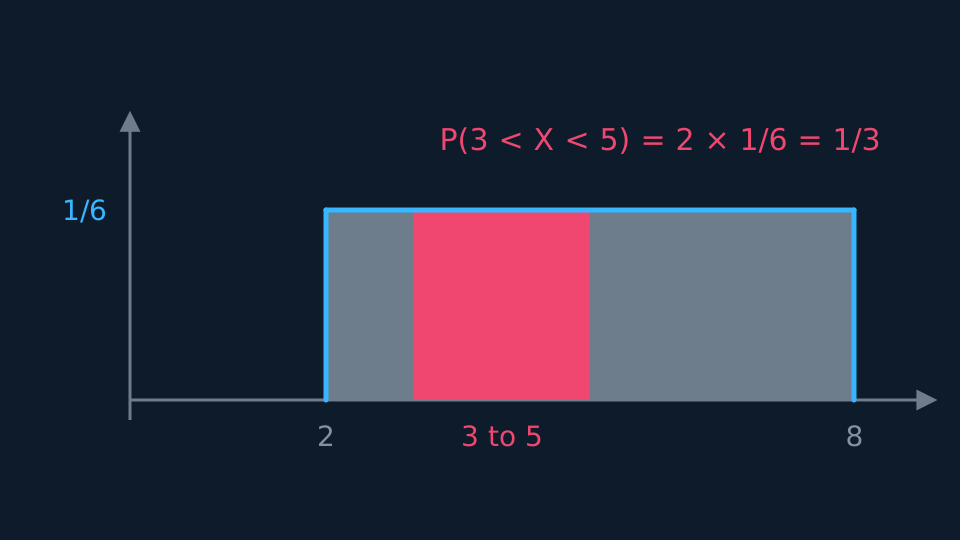
X follows U(2, 8). Find P(3 < X < 5) and P(X > 7).
The height is 1/6, so P(3 < X < 5) = 2 × 1/6 = 1/3.
P(X > 7) = 1 × 1/6 = 1/6. With a constant density, each probability is a width multiplied by the height, so no integration is required.
Mean and variance, derived
Symmetry puts the mean at the midpoint, and the integral confirms it. The variance takes one more line:
Pearson Edexcel 9FM0 formulae booklet: included, in the table of standard continuous distributions, on the Uniform row. The denominator is 12, not 4: dividing by 4 would make the standard deviation half the range, whereas (b − a)/√12 is about 29% of the range.
GUIDED PRACTICE
Deriving the variance
For X following U(a, b), show that Var(X) = (b − a)²/12, and evaluate the mean and standard deviation for U(2, 8).
Show the working
E(X²) = ∫ x²/(b − a) dx from a to b = (b³ − a³)/[3(b − a)] = (a² + ab + b²)/3, using the difference of cubes.
Subtracting [(a + b)/2]² = (a² + 2ab + b²)/4 gives (4a² + 4ab + 4b² − 3a² − 6ab − 3b²)/12 = (a² − 2ab + b²)/12.
That is (b − a)²/12, as required.
For U(2, 8): mean 5, variance 36/12 = 3, and standard deviation √3 ≈ 1.73.
ASSESSMENT FOCUS
- State the height of the density as 1/(b − a) before using it.
- Write F(x) piecewise, with 0 below a and 1 above b as well as the ramp between them.
- The variance divides by 12. Check it against the rough rule that the standard deviation is about 29% of the range.
CHECK YOURSELF
X follows U(0, 10). Find P(X > 6.5) and the standard deviation.
Show a hint
A length over the range, then the variance formula.
Show the answer
P(X > 6.5) = 3.5/10 = 0.35. Var(X) = 100/12 = 8.33, so the standard deviation is 2.89 to three significant figures.
U(a, b) has density 1/(b − a) on the interval, and a distribution function in three branches: 0 below a, (x − a)/(b − a) on it, 1 above b, so probability is proportion of length.
Its mean is the midpoint (a + b)/2 and its variance is (b − a)²/12, a standard deviation of about 29% of the range.
WORKBOOK
Printable practice for this topic: original exam-style questions with room to work, and a fully worked answer book. Free to use; please do not redistribute or sell.
Or read them with their worked answers on the continuous uniform distribution questions page.
CHECK YOUR PROGRESS
Rate how confident you feel with each objective for this lesson. Ratings are saved in this browser, on this device, unless you sign in.
- Write down the density and distribution function of U(a, b) and read probabilities off as lengths.
- Derive its mean and variance from the general integrals.
Open the full revision checklist to see every objective in the course in one place.