Maths › Further Statistics 2 › Testing variances: chi-squared and the F-distribution
Testing variances: chi-squared and the F-distribution
Sometimes the variance is the quantity under test rather than a nuisance. The chi-squared distribution is used to test a single variance against a claimed value, and the F-distribution to compare the variances of two populations.
Builds on Goodness-of-fit tests and Estimators, standard error and confidence intervals.
IN THIS TOPIC
- Test a claimed variance using the chi-squared statistic and the right degrees of freedom.
- Build a confidence interval for a variance from the two chi-squared tails.
- Test two variances for equality with an F ratio.
COMMON MISCONCEPTION
A chi-squared test for a variance uses a symmetric critical region, half the level in each tail.
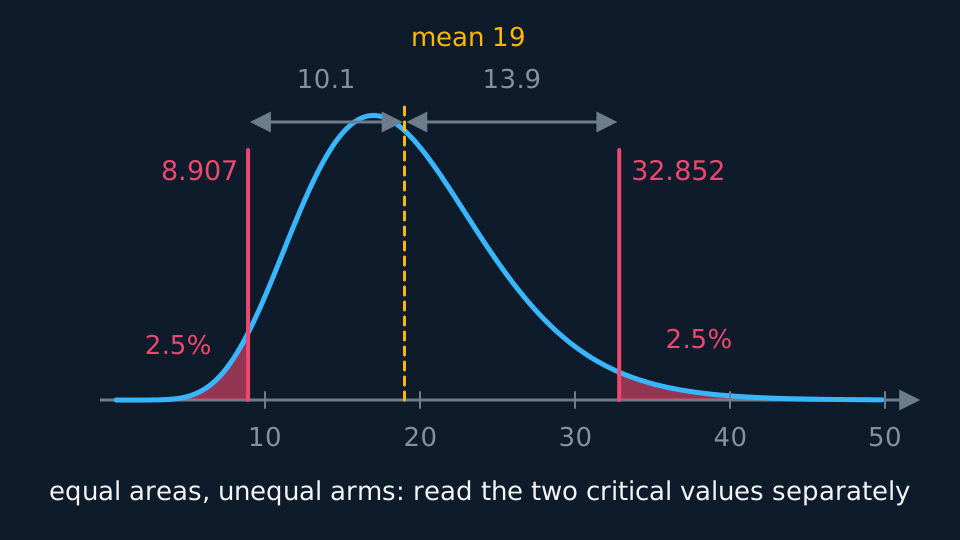
Chi-squared is skewed to the right and lives on the positive axis, so its two tails are not mirror images and a two-tailed test needs two different critical values read from opposite ends of the table. On 19 degrees of freedom the 2.5% points sit at 8.907 and 32.852, ten units below the mean of the distribution and nearly fourteen above it.
Testing a single variance with chi-squared
Take a sample from a normal population. The sample variance, scaled by the claimed population variance, has a known distribution:
Pearson Edexcel 9FM0 formulae booklet: included, under the tests for variance and mean when σ is unknown, with percentage points of χ² tabulated separately. Chi-squared is skewed to the right and lives on the positive axis, so its two tails are not mirror images. A two-tailed test therefore uses two different critical values read from opposite ends of the table; assuming one value serves both tails imports a symmetry that is not there. Normality of the population is a real requirement here, not a formality, since this test is far more sensitive to a non-normal parent than a test about a mean would be.
WORKED EXAMPLE
Testing a claimed variance
A sample of 20 gives s² = 12.5. Test at 5% whether the population variance exceeds 8.
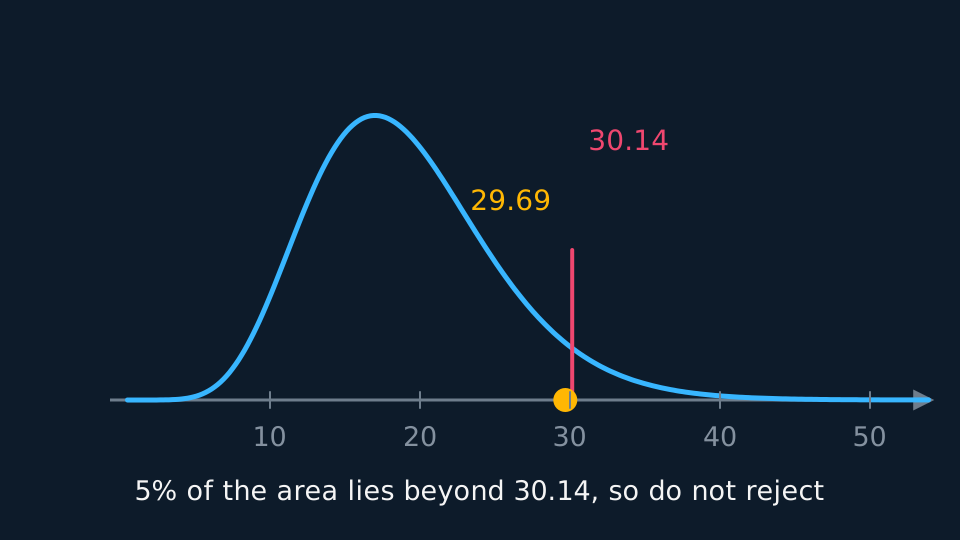
H0: σ² = 8; H1: σ² > 8. One-tailed at 5% with 19 degrees of freedom, so the critical value is 30.144.
Statistic = 19 × 12.5/8 = 29.69.
Since 29.69 < 30.144 the result is outside the critical region, so do not reject H0. There is insufficient evidence at the 5% level that the variance exceeds 8, though it is a close call.
A confidence interval for a variance
The same statistic inverted gives a confidence interval for σ². Divide (n − 1)s² by the upper critical value to get the lower limit, and by the lower critical value to get the upper limit. The larger divisor produces the smaller limit, so the two ends look swapped compared with every interval you have built before.
Describe the drawing
A right-skewed chi-squared curve with a thin coral tail shaded at each end, below eight point nine and above thirty-two point nine. Each tail holds two and a half percent, but the dashed line at the mean of nineteen sits ten units from one cut and nearly fourteen from the other, so the two critical values must be read separately from the table.
WORKED EXAMPLE
A 95% interval for the variance
For the same sample of 20 with s² = 12.5, find a 95% confidence interval for σ².
(n − 1)s² = 19 × 12.5 = 237.5. On 19 degrees of freedom the two critical values are 8.907 and 32.852.
Lower limit 237.5/32.852 = 7.23; upper limit 237.5/8.907 = 26.66.
The interval is (7.23, 26.66). It contains 8, so a two-tailed test at the 5% level would not reject σ² = 8 either. Note how wide it runs. Twenty observations pin a variance down far less tightly than they pin down a mean.
The F test for two variances
To compare the spreads of two normal populations, take the ratio of the sample variances:
Pearson Edexcel 9FM0 formulae booklet: included, in the fuller form with each sample variance divided by its own population variance, which reduces to this ratio under a null hypothesis of equal variances, with percentage points of F tabulated. The alternative hypothesis picks the numerator. For H1: σ1² > σ2² the statistic is s1²/s2² on n1 − 1 and n2 − 1 degrees of freedom, and it is rejected in the upper tail. Swap the alternative to σ2² > σ1² and both halves of the test turn over with it: the statistic becomes s2²/s1², the degrees of freedom reverse, and the rejection region is the upper tail of that new F.
Putting the larger sample variance on top whatever the alternative says would hand the same statistic to both alternatives, and would reject a directional claim on evidence pointing the other way.
Only the two-tailed test lets you choose, and there larger-over-smaller is a valid method. The two tails are reciprocal images of each other, since the lower α/2 point of F on n2 − 1 and n1 − 1 is one over the upper α/2 point of F on n1 − 1 and n2 − 1. So putting the larger variance on top and comparing with the upper α/2 point is exactly the two-tailed test in one line, which is why a two-tailed question at 5% sends you to the 2.5% column.
Either way the degrees of freedom go in the same order as the variances, numerator first, and swapping them changes the critical value.
Describe the drawing
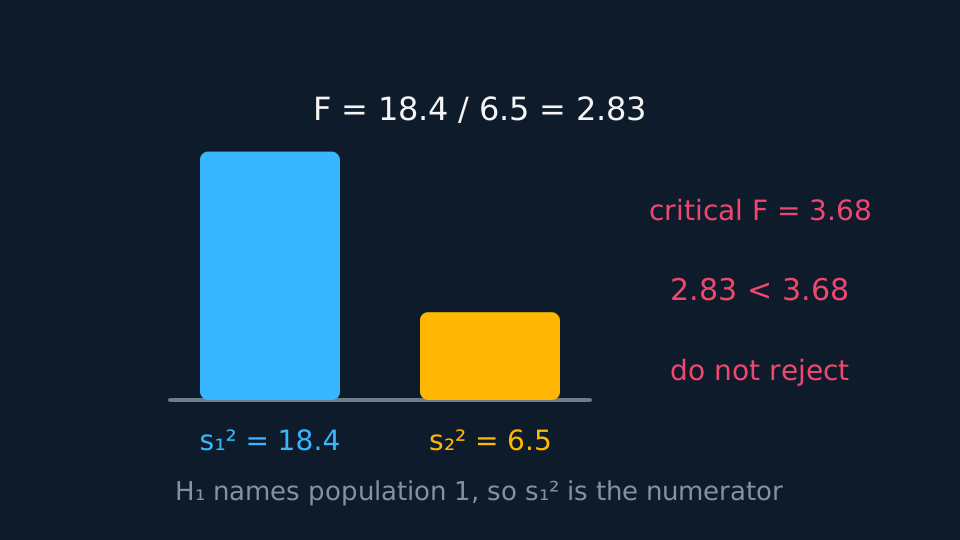
Two bars for the two sample variances, drawn from a common baseline on one scale, the first nearly three times the height of the second. Their ratio, two point eight three, is written above, and beside it the critical value of three point six eight for nine and seven degrees of freedom: the ratio falls short, so the variances may well be equal. A note records that the alternative hypothesis names the first population, which is what puts its sample variance on top.
GUIDED PRACTICE
Do the spreads differ?
A sample of 10 gives s² = 18.4; an independent sample of 8 gives s² = 6.5. Test at 5% in one tail whether the first population has the larger variance, given a critical value of 3.677.
Show the working
H0: σ1² = σ2²; H1: σ1² > σ2².
F = 18.4/6.5 = 2.83, on 9 and 7 degrees of freedom.
Since 2.83 < 3.677 the result is not in the critical region.
Do not reject H0: the samples give insufficient evidence at the 5% level that the first population is more variable, despite sample variances differing by a factor of nearly three.
Test the rule by swapping the alternative. With H1: σ2² > σ1² the statistic is 6.5/18.4 = 0.353 on 7 and 9 degrees of freedom, against a critical value of 3.293, so it is nowhere near the region and the second population is not shown to be the more variable one. That is the right verdict on data pointing the other way. Larger-over-smaller would have handed 2.83 to both alternatives and read the same evidence two ways.
ASSESSMENT FOCUS
- Use n − 1 degrees of freedom for a single variance, and both n − 1 values for an F test.
- For a two-tailed chi-squared test, read two different critical values. The distribution is not symmetric.
- For a one-tailed F test the alternative picks the numerator: the population claimed to be more variable supplies it, whichever sample variance happens to be bigger.
- Larger-over-smaller is the two-tailed procedure, not a general rule. Use it only when the alternative names no direction, and halve the level before entering the table.
- Keep the degrees of freedom in the same order as the variances, numerator first. Reversing them reads a different critical value.
- State that both populations are assumed normal. These tests are sensitive to that assumption.
CHECK YOURSELF
A sample of 16 from a normal population gives s² = 20. State the test statistic for H₀: σ² = 15 and its degrees of freedom.
Show a hint
Multiply the sample variance by n − 1 and divide by the claimed variance.
Show the answer
Statistic = 15 × 20/15 = 20, on 15 degrees of freedom. The 15 on top is n − 1 and the 15 underneath is the claimed variance; they match here only by accident.
(n − 1)S²/σ² is chi-squared on n − 1 degrees of freedom, and the distribution is skewed, so a two-tailed test needs two different critical values.
The ratio of two sample variances is F on the two degrees of freedom, numerator first; the alternative hypothesis picks the numerator, and larger-over-smaller is the two-tailed procedure at half the level.
WORKBOOK
Printable practice for this topic: original exam-style questions with room to work, and a fully worked answer book. Free to use; please do not redistribute or sell.
Or read them with their worked answers on the testing variances: chi-squared and the F-distribution questions page.
CHECK YOUR PROGRESS
Rate how confident you feel with each objective for this lesson. Ratings are saved in this browser, on this device, unless you sign in.
- Test a claimed variance using the chi-squared statistic and the right degrees of freedom.
- Build a confidence interval for a variance from the two chi-squared tails.
- Test two variances for equality with an F ratio.
Open the full revision checklist to see every objective in the course in one place.