Maths › Further Statistics 2 › Comparing two normal means
Comparing two normal means
Comparing the means of two normal populations rests on the difference of the two sample means, which is itself normally distributed when the samples are independent. State hypotheses about the population means, build the standard error of the difference, carry out the test and give a confidence interval for the difference.
Builds on Combinations of normal random variables and Estimators, standard error and confidence intervals and Hypothesis testing: correlation and the normal.
IN THIS TOPIC
- Find the standard error of a difference of sample means.
- Carry out a two-sample z test and state the conclusion in context.
- Build a confidence interval for the difference and link it to the test.
COMMON MISCONCEPTION
To compare two sample means, subtract their standard errors to get the standard error of the difference.
Standard errors combine by adding their squares. For two independent samples the difference of the means is normal, with the two variance-over-n terms added under the square root, so the difference is more variable than either mean alone. Subtracting would make the spread of a difference smaller than the spread of a single mean, and could give a negative variance.
The distribution of the difference of two sample means
Each sample mean is normal about its population mean, with variance σ²/n. Provided the two samples are independent, the difference of the means is normal as well, and the variances add:
Pearson Edexcel 9FM0 formulae booklet: included, under Sampling distributions, among the tests for the mean when σ is known. Hypotheses are about the population means, so write H₀: μx = μy. Under that null hypothesis the second bracket in the numerator is zero and the statistic reduces to a z score. Standard errors combine by adding their squares, not by subtracting: subtraction would make the spread of a difference smaller than the spread of a single mean, and could give a negative variance.
WORKED EXAMPLE
A two-sample test
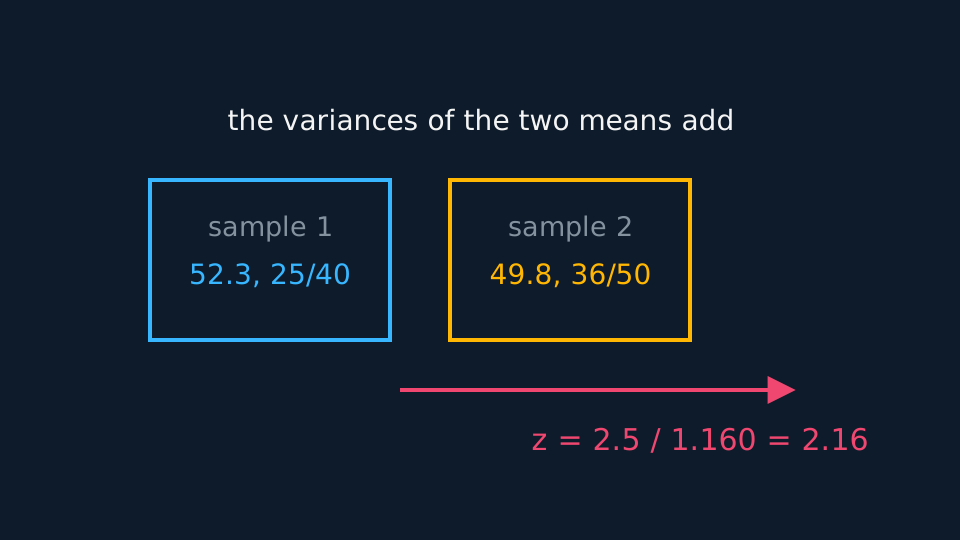
Sample 1: n = 40, mean 52.3, from a population with variance 25. Sample 2: n = 50, mean 49.8, variance 36. Test at 5% whether the population means differ.
H0: μx = μy; H1: μx ≠ μy. Two-tailed at 5%, so the critical values are ±1.96.
Standard error = √(25/40 + 36/50) = √1.345 = 1.160.
z = 2.5/1.160 = 2.16. Since 2.16 > 1.96, reject H0. There is evidence at the 5% level of a difference between the population means.
When the variances are unknown
Large samples support two separate approximations. The Central Limit Theorem makes each sample mean approximately normal whatever the shape of the population, and each sample variance s² is a sufficiently precise estimate of σ² to replace it. The statistic is unchanged with s² in place of σ², and the conclusion is then approximate; state that in the answer.
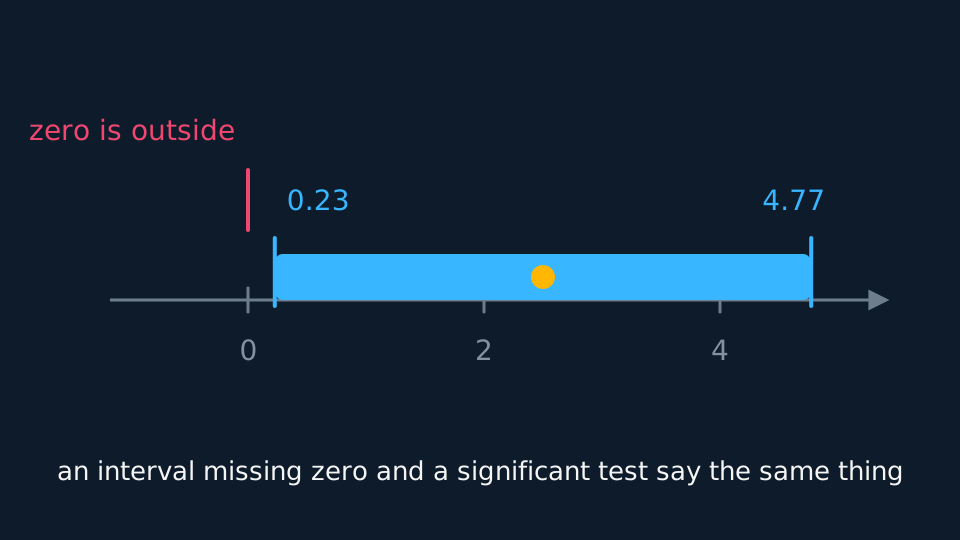
A confidence interval for the difference follows from the same standard error, and it answers the same question as the test. An interval excluding zero corresponds exactly to a two-tailed test at the matching level rejecting equality. Quote the interval alongside the conclusion: it indicates how large the difference might be, where the test reports only whether the evidence is sufficient.
GUIDED PRACTICE
An interval for the difference
For the samples above, find a 95% confidence interval for the difference in population means, and comment.
Show the working
The point estimate is 52.3 − 49.8 = 2.5, and the standard error is 1.160 as before.
The interval is 2.5 ± 1.96 × 1.160 = 2.5 ± 2.27, that is (0.23, 4.77).
Zero lies outside, so the two-tailed test at 5% rejects equality, agreeing with the test already carried out.
The interval is wide. The size of the difference stays poorly pinned down even though the test finds evidence of one.
ASSESSMENT FOCUS
- Set out the standard error as a separate calculation, showing both variance-over-n terms.
- Say whether the test is one-tailed or two-tailed before quoting a critical value.
- State the independence of the two samples. The variance rule depends on it.
- With unknown variances, say that large samples make the result approximate.
CHECK YOURSELF
Two independent samples of size 25 have means 80 and 74, from populations with variances 50 and 30. Find the standard error of the difference.
Show a hint
Divide each variance by its own n, add, then take the root.
Show the answer
50/25 + 30/25 = 2 + 1.2 = 3.2, so the standard error is √3.2 = 1.789 to three decimal places.
The difference of two independent sample means is normal, with the two variance-over-n terms added under the square root.
With large samples the sample variances may replace the population ones, and an interval missing zero matches a significant two-tailed test.
WORKBOOK
Printable practice for this topic: original exam-style questions with room to work, and a fully worked answer book. Free to use; please do not redistribute or sell.
Or read them with their worked answers on the comparing two normal means questions page.
CHECK YOUR PROGRESS
Rate how confident you feel with each objective for this lesson. Ratings are saved in this browser, on this device, unless you sign in.
- Find the standard error of a difference of sample means.
- Carry out a two-sample z test and state the conclusion in context.
- Build a confidence interval for the difference and link it to the test.
Open the full revision checklist to see every objective in the course in one place.