Physics › Measurements › Uncertainty and error
Uncertainty and error
Absolute uncertainty is the ± amount, in the measurement's own units, within which the true value is expected to lie. Percentage uncertainty is that amount divided by the value, times 100. Random and systematic errors produce uncertainty differently. Repeats reduce random scatter; a systematic error shifts every reading the same way and repeating readings does not reduce it. Error bars give the uncertainty in a gradient.
Choose your exam board to show the notes and questions relevant to your specification. You can change this setting at any time, and content for other boards remains available.
Builds on SI base and derived units.
IN THIS TOPIC
- Tell a random error from a systematic one, and pick the treatment that actually reduces each.
- Use precision, accuracy, resolution, repeatability and reproducibility with the meanings mark schemes use.
- Estimate an uncertainty from an instrument's resolution, or from the range of a set of repeats.
- Move between absolute, fractional and percentage uncertainty, and combine them through sums, products and powers.
- Put error bars on a graph and get the uncertainty in the gradient from the steepest and shallowest lines.
COMMON MISCONCEPTION
A measurement is a number.
A number alone is not a measurement. A measurement is a value, a unit and an uncertainty, because every instrument has finite resolution and every method has scatter.
Two kinds of error, treated differently
Random errors scatter readings either side of the true value. Electrical noise does it. So does a reaction time that varies from one press of the stopwatch to the next, and so does a draught nudging a balance. Because the direction of the scatter is unpredictable, repeating and averaging helps, and more repeats pull the mean in tighter, though some random scatter survives any number of them.

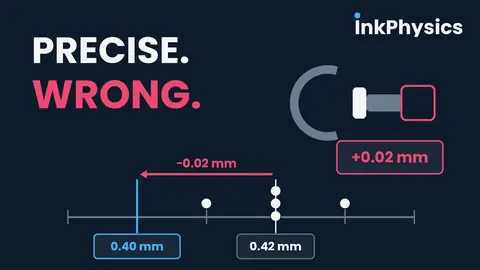
Systematic errors shift every reading the same way. A ruler whose scale starts at 1 mm does it, and so does an ammeter showing 0.02 A with nothing connected. Averaging cannot touch them. Repeat a hundred times and the readings stay consistently wrong, so the only remedy is to find the cause and remove it. Most often the cause is a zero error, and the fix there is the model for all the rest. Check the instrument reads zero when it should, then subtract the offset from every reading you took.
Precision, accuracy, resolution, repeatability and reproducibility
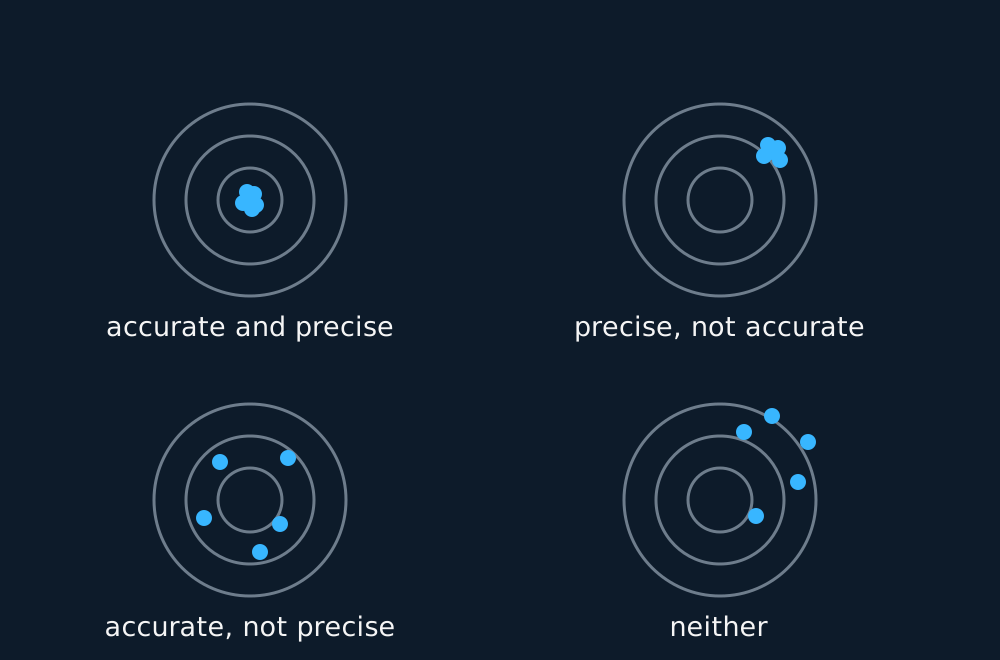
Precision is how tightly repeated readings cluster, and it says nothing whatever about being right. Accuracy is how close a result sits to the true value. The two are independent, exactly as the two kinds of error predict. A systematic error leaves you precise and wrong. Heavy random scatter leaves you imprecise even when the mean lands on the truth.
Three further terms have specific meanings in mark schemes. Resolution is the smallest change an instrument can display, one millimetre for an ordinary ruler. Repeatability means the same experimenter with the same equipment gets consistent results; reproducibility means a different experimenter, or different equipment, still agrees, which is the stronger claim.
Quantifying uncertainty
The uncertainty is the interval within which the true value can reasonably be expected to lie, written after a ± sign. For a single reading, the usual board convention is half the instrument's resolution, so a millimetre ruler contributes ±0.5 mm at each end. Measuring a length means judging both ends, which gives ±1 mm overall. For a set of repeated readings, use half the range, the largest reading minus the smallest, divided by two.
One uncertainty, three forms. The absolute uncertainty keeps the unit, ±0.5 mm. Divide by the value and you have the fractional uncertainty; multiply that by 100 and you have the percentage.
WORKED EXAMPLE
From repeats to a quoted result
Four timings of the same fall: 2.31 s, 2.35 s, 2.29 s, 2.33 s. Quote the result with its uncertainty.
The mean is (2.31 + 2.35 + 2.29 + 2.33)/4 = 2.32 s.
Half the range gives the uncertainty, (2.35 − 2.29)/2 = 0.03 s, so quote 2.32 ± 0.03 s.
As a percentage that is 0.03/2.32 × 100 = 1.3%. Notice the value carries no more decimal places than its uncertainty allows.
Combining uncertainties
Calculations mix measured quantities, and three rules combine their uncertainties. Add or subtract quantities, and you add the absolute uncertainties. Multiply or divide, and you add the percentage uncertainties. Raise a quantity to the power n, and its percentage uncertainty is multiplied by n, so a radius known to 2% yields a volume known only to 6%, because volume goes as .
The subtraction rule has a practical consequence. Take mm and mm. Their difference is mm. The value shrank while the doubt grew, so subtracting two nearly equal quantities can leave a percentage uncertainty large enough to make the result useless. Experiments are designed to avoid taking the difference of two nearly equal measurements.
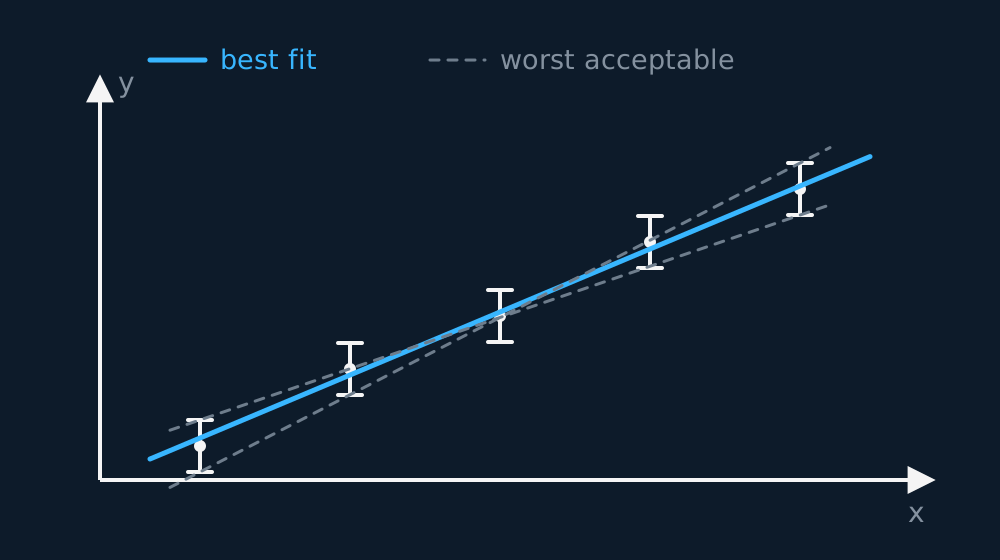
On a graph, each point's uncertainty becomes an error bar. Draw the best-fit line, then the steepest and the shallowest acceptable lines, the extremes that stay consistent with the error bars. Half the difference between those two gradients is the uncertainty in the gradient, and where the same two lines cut the axis brackets the intercept. Last, let the uncertainty set your significant figures. Quoting 12.4783 when the doubt is ±0.5 claims a precision the experiment never had.
GUIDED PRACTICE
Uncertainty in a calculated density
A block's mass carries 0.8% uncertainty and its volume 1.5%. Decide which combining rule applies to ρ = m/V, then find the percentage uncertainty in the density.
Show the working
Density divides one quantity by another, so the percentage uncertainties add. 0.8 + 1.5 = 2.3%.
Adding the absolute uncertainties would be meaningless, since kilograms and cubic metres cannot be added. Percentage uncertainties are pure numbers, so they can be combined even when the quantities have different units.
INDEPENDENT PRACTICE
A power inside a formula
g is measured via g = 2h/t2, with 0.5% uncertainty in h and 1.2% in t. Find the percentage uncertainty in g, and the absolute uncertainty if g comes out as 9.7 m s−2.
Show the working
The t is squared, so its percentage counts twice. 0.5 + 2 × 1.2 = 2.9%.
On 9.7 m s−2 that comes to 0.029 × 9.7 = 0.28, so quote 9.7 ± 0.3 m s−2. The uncertainty rounds to one significant figure, and it sets how precisely the value itself may be written.
ASSESSMENT FOCUS
- Repeating and averaging reduces random error only. Where the question describes a zero error or a mis-set instrument, give finding and removing the offset as the correction.
- Check for a power before combining percentage uncertainties. A cubed quantity carries three times the percentage uncertainty of the length that was measured.
- Asked which measurement most needs improving, choose the largest percentage uncertainty, not the largest absolute uncertainty.
- For the uncertainty in a gradient, draw the steepest and shallowest acceptable lines through the error bars and take half the difference between their gradients.
- Match significant figures to the uncertainty. If the doubt sits in the first decimal place, the answer stops there too.
- Nothing in this topic is printed in the data booklet. Percentage uncertainty, the three combination rules and half-the-range must all be recalled.
CHECK YOURSELF
A wire's diameter is measured as 0.40 ± 0.01 mm. What is the percentage uncertainty in its cross-sectional area?
Show a hint
Area depends on the diameter squared. What does the power rule do to a percentage uncertainty?
Show the answer
Percentage uncertainty in the diameter is (0.01 / 0.40) × 100 = 2.5%.
The area goes as , so the power rule doubles that. The area is uncertain by 5%.
Working through the radius changes nothing at all. Halving a value halves its absolute uncertainty too, so the percentage survives the halving untouched.
Averaging reduces random error, though it cannot remove it.
It does nothing to systematic error.
A power multiplies the percentage uncertainty by that power.
WORKBOOK
Printable practice for this topic: original exam-style questions with room to work, and a fully worked answer book. Free to use; please do not redistribute or sell.
Or read them with their mark schemes on the uncertainty and error questions page.
WHERE TO GO NEXT
- Combining uncertainties is the maths this lesson leans on, worked through step by step.
USED LATER IN
CHECK YOUR PROGRESS
Rate how confident you feel with each objective for this lesson. Ratings are saved in this browser, on this device, unless you sign in.
- Tell a random error from a systematic one, and pick the treatment that actually reduces each.
- Use precision, accuracy, resolution, repeatability and reproducibility with the meanings mark schemes use.
- Estimate an uncertainty from an instrument's resolution, or from the range of a set of repeats.
- Move between absolute, fractional and percentage uncertainty, and combine them through sums, products and powers.
- Put error bars on a graph and get the uncertainty in the gradient from the steepest and shallowest lines.
Open the full revision checklist to track your progress across the whole unit.