Physics › Medical physics › Intensity, loudness and the decibel scale
Intensity, loudness and the decibel scale
Intensity is sound power per unit area, and because the ear covers twelve orders of magnitude of it, sound is quoted in decibels. Intensity level is ten log of the intensity against a reference of 1.0 × 10⁻¹² W m⁻², and dBA weights a meter towards the frequencies the ear responds to. Equal loudness curves show what a listener matches.
Choose your exam board to show the notes and questions relevant to your specification. You can change this setting at any time, and content for other boards remains available.
The physics of the ear, part 2 of 2. Part 1 is The ear and the transmission of sound.
Builds on The ear and the transmission of sound and Progressive waves.
IN THIS TOPIC
- Use I = P/A, and use the intensity level equation in both directions.
- Explain why a logarithmic scale is the right one, and say what the dBA scale adds.
- Read an equal loudness curve, say how one is produced, and say what damage does to it.
COMMON MISCONCEPTION
A sound at 80 dB carries twice the power of one at 40 dB.
80 dB is 40 dB more, which is four factors of ten, so the intensity ratio is 104. Ten thousand times the power, not twice: the decibel scale is logarithmic precisely because the ear judges by ratio rather than by difference.
Intensity, and why the scale is logarithmic
The transmission chain from the pinna to the hair cells carries the vibration in. This section puts numbers on the sound itself: how much energy is arriving, and how the scale that measures it is built to match the ear's response.
Sound carries energy, and the quantity that matters at a detector is how much of it arrives per second on each square metre facing the wave. That is the intensity,
measured in W m−2, with A the area at right angles to the direction the sound travels. An eardrum of area 60 mm2, the drum at the head of part 1's transmission chain, in a sound of intensity I therefore absorbs a power IA, and that is the calculation an exam builds towards.
Now look at the range the ear covers. The quietest sound a good ear detects has an intensity of 1.0 × 10⁻¹² W m−2, and a sound a million million times more intense is painful rather than deafening. A linear scale cannot show both ends of that on one axis. Worse, it would misrepresent what the listener reports, because the ear judges by ratio: multiply the intensity by ten and the sound seems one step louder, multiply it by ten again and it seems one more step louder. Equal ratios feel like equal steps, and that is precisely what a logarithm turns into equal intervals.
So sounds are quoted as an intensity level in decibels, measured against the threshold of hearing:
with I0 = 1.0 × 10⁻¹² W m−2, the booklet value. Read it once and the numbers stop being arbitrary. Ten times the intensity is +10 dB, a hundred times is +20 dB, and doubling the intensity is close to +3 dB.
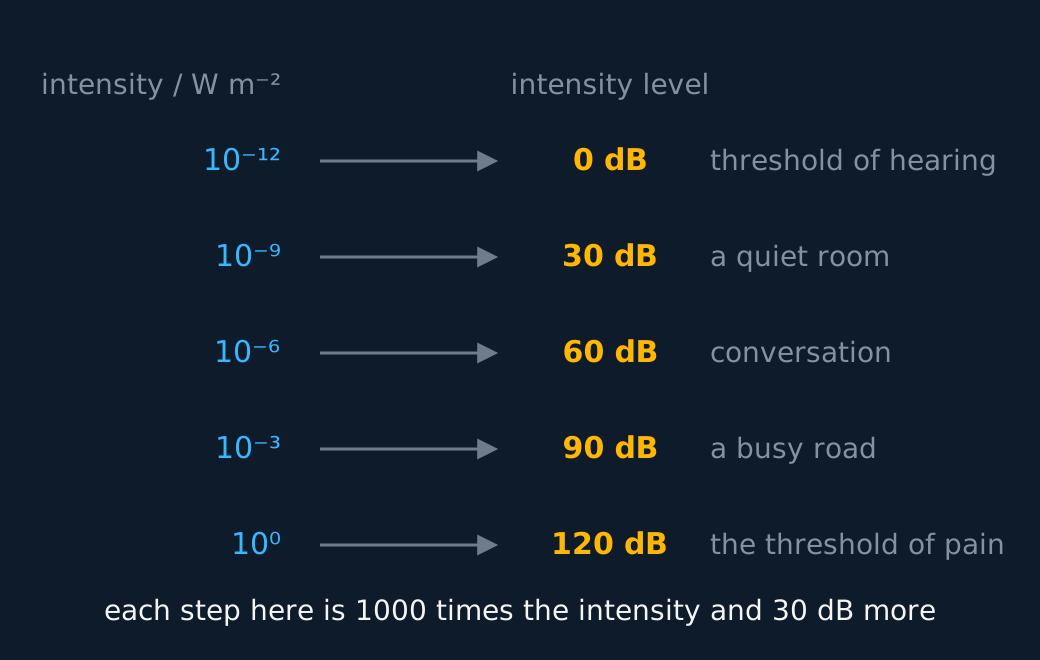
From 40 dB to 80 dB is 40 decibels, so four factors of ten, and the intensity ratio is 104. Ten thousand times, not twice.
WORKED EXAMPLE
The power arriving on an eardrum
A tone measured at 78 dB falls on an eardrum of area 60 mm2. Find the power the eardrum receives.
First the intensity. 78 = 10 log(I/I0), so I/I0 = 107.8 = 6.3 × 10⁷, and I = 6.3 × 107 × 1.0 × 10−12 = 6.3 × 10⁻⁵ W m−2.
Then the power. A = 60 mm2 = 60 × 10−6 m2, so P = IA = 6.3 × 10−5 × 60 × 10−6 = 3.8 × 10⁻⁹ W.
Four nanowatts, and the ear reports it comfortably. Converting square millimetres to square metres is where this question is usually lost: the factor is 10−6, not 10−3.
Two sounds can also be compared with each other, without either one being referred to the threshold. Their relative intensity level is
which is just the difference of their two levels, and it is what a question means by asking how many decibels louder one sound is than another.
Equal loudness curves
Intensity level is a measurement. Loudness is a judgement, and the two part company as soon as the frequency changes, because the ear is not equally sensitive across its range of about 20 Hz to 20 kHz. An equal loudness curve maps the difference.
Producing one takes a listener and two tones. A reference tone at 1 kHz is set to a chosen intensity level. A test tone at some other frequency is then adjusted until the listener judges the two equally loud, and the level it needed is plotted at that frequency. Repeat across the range, join the points, and the curve shows every combination of frequency and intensity level that sounds equally loud to that listener. Each curve is named by its own level at 1 kHz, and the results are averaged over many listeners.
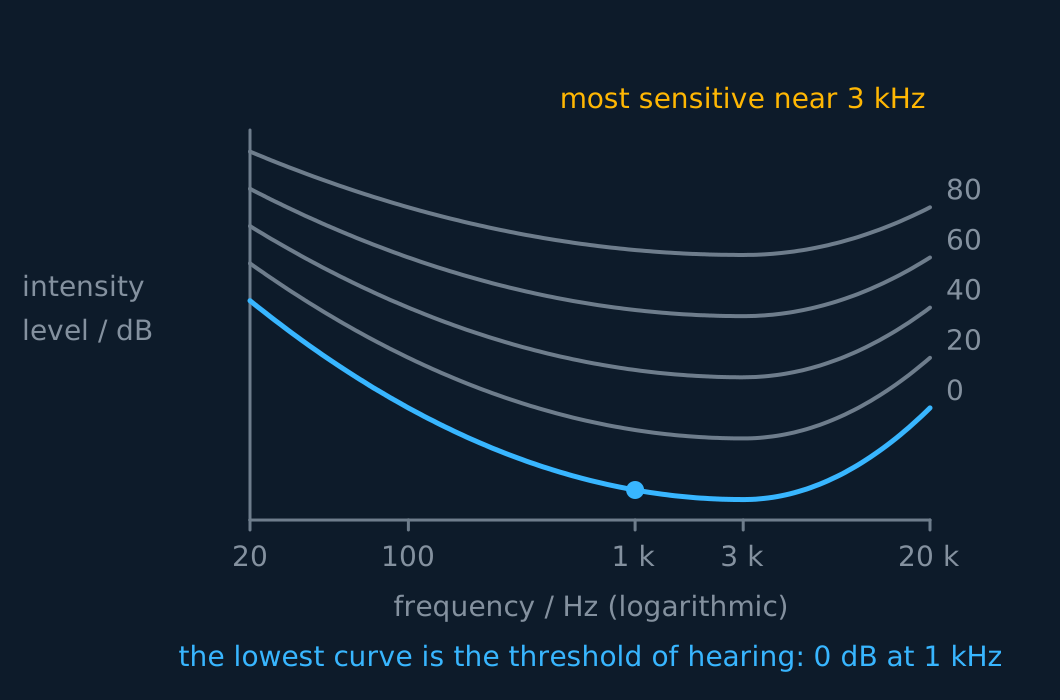
Three readings come off that family, and questions ask for all three. The ear is most sensitive between about 2 kHz and 5 kHz, where the curves dip lowest, so least intensity is needed there. Sensitivity falls away at both ends, and the bass end is the worse of the two, which is why a very low note needs a far higher intensity level to match a mid tone. And the curves flatten as they rise, so a loud passage is heard with a more even frequency balance than a quiet one.
The lowest curve of all is the threshold of hearing, the minimum intensity a normal ear can detect, quoted at 1 kHz as 1.0 × 10⁻¹² W m−2. That is where the 0 dB of the decibel scale comes from, so 0 dB does not mean silence; it means the faintest audible sound at the reference frequency.
A meter reading in plain dB weights every frequency equally, so it will call a rumbling low-frequency noise louder than a listener does. The dBA scale narrows that gap by passing the signal through a standard A-weighting curve before the level is computed, discounting the frequencies the ear is poor at, and noise-at-work exposure limits are written in dBA for that reason.
Be careful what that achieves. The weighting is one agreed curve, drawn to approximate the ear's response at moderate levels, so a dBA figure is still an intensity level and not a measurement of the loudness anyone hears: the equal loudness curves flatten as the level rises, and no single fixed curve can follow that. What A-weighting gives is one number that counts the frequencies the ear is sensitive to more heavily than the ones it is not, which is what an exposure limit needs.
What damage does to the curves
Hearing is lost in two ways the specification asks about: injury from exposure to excessive noise, and gradual deterioration with age. Both show up as a change in the curves rather than as silence.
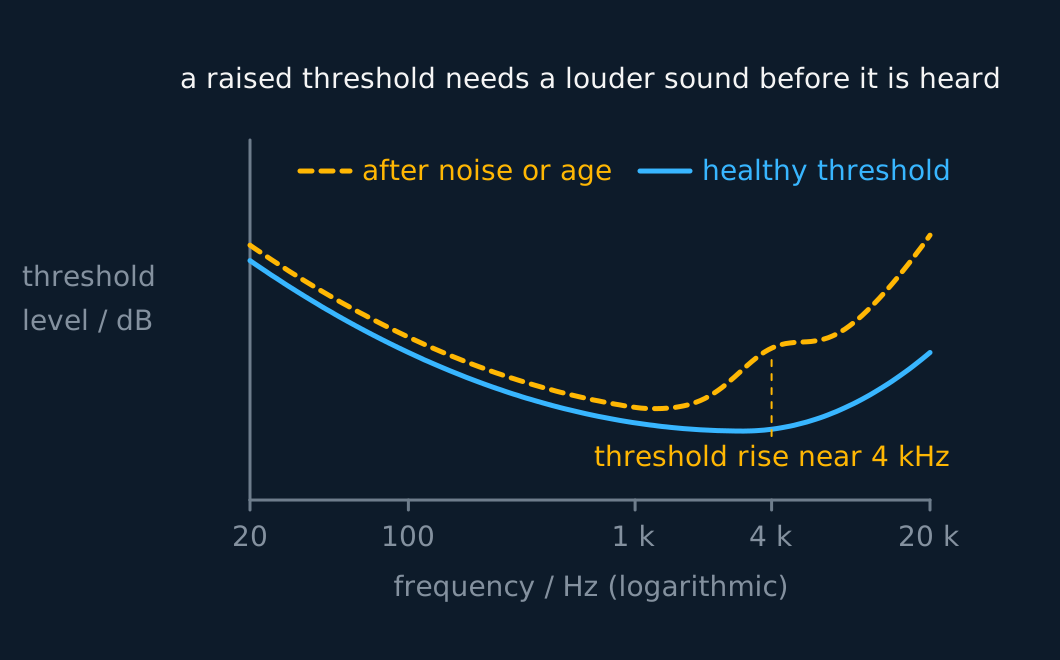
The threshold curve lifts, meaning a greater intensity is now needed before anything is heard at all, and it lifts unevenly. The high-frequency end goes first, so the top of the range shrinks well before the middle is affected. Loud noise typically leaves a dip in performance around 4 kHz; ageing raises the whole treble end steadily. The higher equal loudness curves change less, so loud sounds still seem loud while quiet ones vanish.
The practical consequence is worth stating in an answer, because it is what a patient reports. Consonants such as s, f and t carry their information at high frequency and at low intensity, so they are the first things to go, and speech becomes hard to follow in a noisy room long before anyone would say they were deaf.
ASSESSMENT FOCUS
- Working back from a level to an intensity is one line: I = I0 × 10L/10. Then multiply by the area, in square metres, if a power is wanted.
- Quote the reference intensity properly. I0 = 1.0 × 10⁻¹² W m−2 is the agreed reference for the decibel scale, taken as the approximate threshold of hearing of a normal ear at 1 kHz; state the frequency, and keep it distinct from an individual listener's measured threshold.
- Intensity and intensity level are different quantities with different units. W m−2 against dB, so give whichever of the two the question names.
- A dBA answer should say weighting rather than loudness. The meter passes the signal through one standard curve approximating the ear's response at moderate levels, so the figure discounts the frequencies the ear is poor at, but it is still an intensity level, not a measurement of what anyone hears.
- For hearing loss, describe the shift in the curves rather than the biology. The specification excludes the physiological changes, so marks are for the threshold rising and for the high-frequency end rising most.
CHECK YOURSELF
A machine produces a sound of intensity 2.0 × 10⁻⁴ W m−2 at a worker's ear. Find the intensity level in dB. A second machine is 6.0 dB louder: find its intensity. Explain why the site's noise limit is written in dBA rather than dB.
Show a hint
One equation, used forwards and then backwards. The last part is about which frequencies the ear actually notices.
Show the answer
I/I0 = (2.0 × 10⁻⁴)/(1.0 × 10−12) = 2.0 × 10⁸, and 10 log(2.0 × 10⁸) = 83 dB.
6.0 dB more means 10 log(I2/I1) = 6.0, so I2/I1 = 100.6 = 4.0 and I2 = 8.0 × 10⁻⁴ W m−2.
A plain dB reading treats every frequency alike, so it overstates the effect of low-frequency rumble that the ear barely registers. The dBA scale applies a standard weighting curve, drawn to approximate the ear's response at moderate levels, before the level is computed, so its single number counts the frequencies the ear is sensitive to most heavily. That makes it an exposure metric on an agreed curve rather than a measurement of perceived loudness, and an exposure metric is what a limit needs.
Intensity is power per unit area; intensity level is ten log of it against 1.0 × 10⁻¹² W m⁻².
The scale is logarithmic because the ear judges by ratio, so +10 dB is always ten times the intensity.
Equal loudness curves dip near 3 kHz, flatten as they rise, and lift at the treble end when hearing is damaged.
Or read them with their mark schemes on the ear and the transmission of sound questions page.
WHERE TO GO NEXT
- Exponentials and logarithms is the maths this lesson leans on, worked through from GCSE.
CHECK YOUR PROGRESS
Rate how confident you feel with each objective for this lesson. Ratings are saved in this browser, on this device, unless you sign in.
- Use I = P/A, and use the intensity level equation in both directions.
- Explain why a logarithmic scale is the right one, and say what the dBA scale adds.
- Read an equal loudness curve, say how one is produced, and say what damage does to it.
Open the full revision checklist to track your progress across the whole unit.