Biology › Evolution and speciation › Continuous and discontinuous variation
Continuous and discontinuous variation
Discontinuous variation sorts a population into distinct categories; continuous variation spreads it along an unbroken range. The difference follows from the number of genes involved and from whether environmental conditions modify the phenotype. ABO blood group and adult height are the worked examples.
Before this Natural selection and variation · Meiosis and the origin of variation · Monohybrid inheritance
COMMON MISCONCEPTION
Continuous variation is caused by the environment and discontinuous variation is caused by genes.
Both continuous and discontinuous characteristics can have a genetic basis. Height is polygenic and is also affected by environment; ABO blood group is controlled mainly by one gene and falls into discrete categories. The relative influence of genes and environment depends on the characteristic.
What you should be able to do
- Distinguish continuous from discontinuous variation on the number of genes, the effect of the environment, the distribution and the graph.
- Give a named example of each kind, and say why blood group and height behave differently.
- Explain how several genes acting together on one characteristic produce a smooth distribution rather than separate classes.
- Describe how environmental factors modify a phenotype, and say why they are not inherited.
- Use the terms intraspecific and interspecific variation correctly.
Two kinds of variation, and the graph appropriate to each
Discontinuous variation produces distinct categories with no intermediate values; ABO blood group is an example. Continuous variation produces a range of quantitative values; height is an example. Discontinuous characteristics are often controlled by one or a small number of genes. Continuous characteristics are usually polygenic and are often also influenced by environmental conditions.
The two examples behave differently in every respect. Every ABO result is one of four categories; no individual falls between A and B, and diet and exercise do not move anyone from one group to another. Heights measured in the same sample run continuously from the shortest to the tallest with no gaps, and nutrition during growth contributes to the value reached.
Discontinuous variation sorts a population into a small number of distinct categories with no intermediates. Continuous variation spreads a population along an unbroken range in which any value between the extremes is possible. Name the pattern before giving its cause.
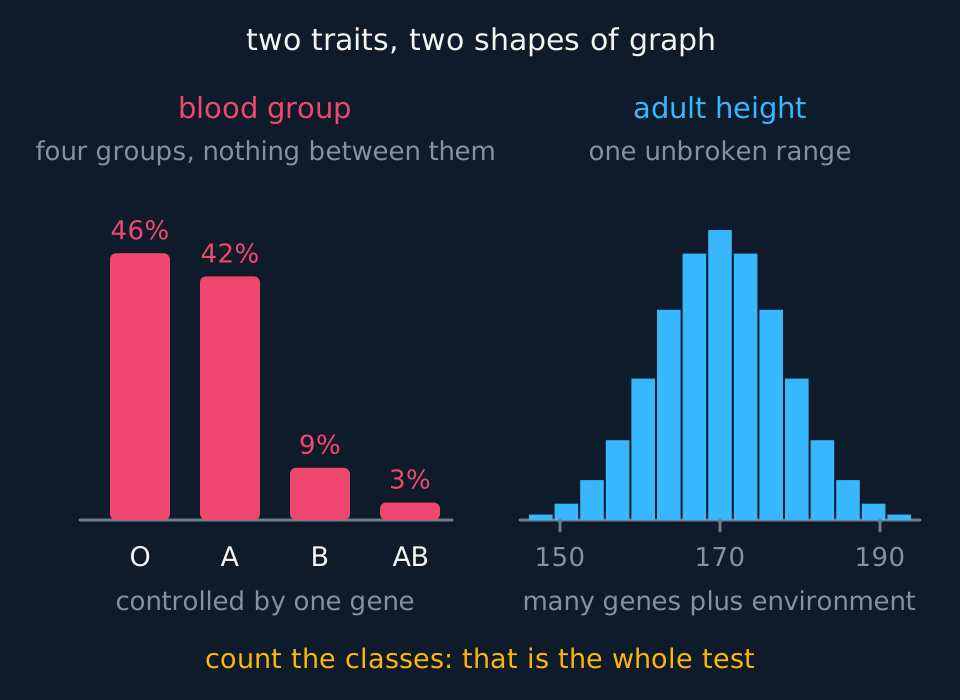
The contrast can be set out on four separate criteria.
| Discontinuous | Continuous | |
|---|---|---|
| Genes involved | One gene, or very few | Many genes, called polygenes |
| Effect of the environment | None, or almost none | Large: the phenotype can be moved by conditions |
| The population | Falls into a few distinct classes | Spreads over a range with no gaps |
| The graph | A bar chart, with the bars apart | A histogram whose bars touch, usually a bell shape |
| Examples | ABO blood group, human sex, ability to roll the tongue, coat colour in some mice | Height, body mass, milk yield, leaf length, skin colour |
- Continuous variation
- Variation in which the individuals of a population differ by small amounts over an unbroken range, with any value between the extremes possible; height is the standard example.
- Discontinuous variation
- Variation in which the individuals of a population fall into a small number of distinct categories with no intermediates; ABO blood group is the standard example.
- Polygenes
- A group of different genes, each with a small additive effect, that together control one characteristic and give it a continuous distribution.
Why one gene gives classes and many genes give a curve
The four blood groups come from one gene, called I, with three alleles in the population. Any person carries two of them, there are six possible genotypes, and because IA and IB are codominant and both are dominant to IO, those six genotypes give exactly four phenotypes. There is no way to be between two of them, because there is no genotype between two genotypes. That is the mechanism of discontinuous variation: a small number of alleles at a small number of loci gives a small number of phenotypes, and the classes are separated by whole genotypes rather than by degrees.
Adding loci changes the pattern. Suppose a characteristic is affected by one gene whose two alleles add different amounts to the result. There are three genotypes and three phenotype classes in the ratio 1:2:1. Add a second gene of the same kind, acting on the same characteristic, and the number of contributing alleles an individual can carry runs from none to four, giving five classes. Four such genes give nine. The classes get more numerous, the difference between neighbouring classes gets smaller, and the shape of the distribution begins to look like a bell.
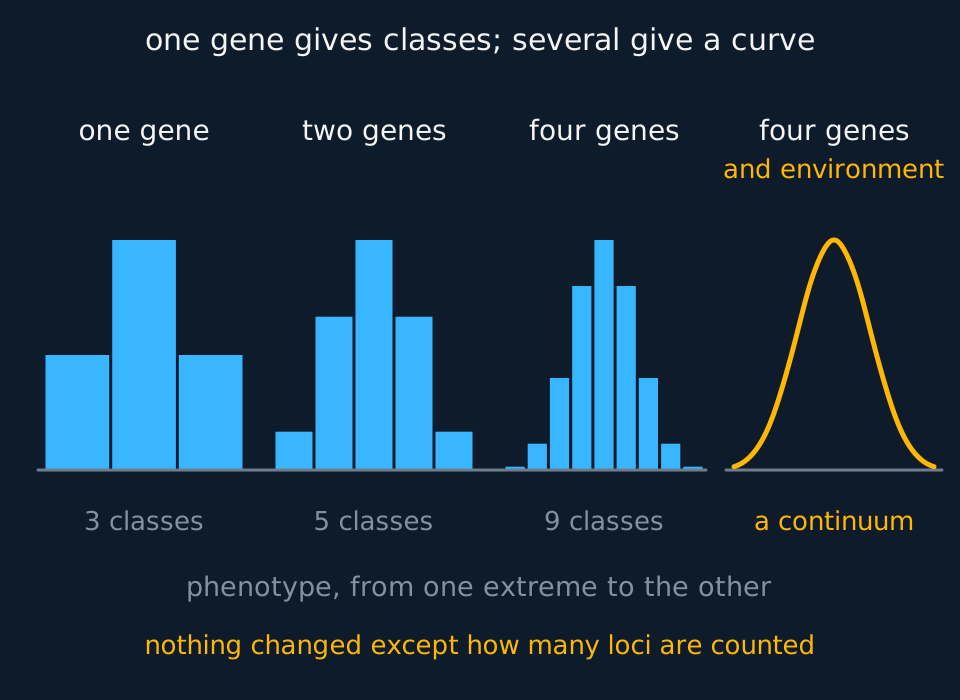
Two or three genes still leave visible steps. Continuous characteristics usually involve many more, and the steps are then smaller than the precision of the measurement. Environmental variation adds further overlap: an individual whose genotype places them in one class may measure the same as an individual from the class above or below, because nutrition, illness and activity have altered the value reached. Continuous variation therefore results from polygenes and environmental conditions together.
The reverse claim is incorrect. Continuous variation is not caused by the environment alone. It has a genetic basis in the same sense that blood group does, and tall parents have taller children on average across a range of adequate diets. Environmental conditions add further spread on top of the genetic component, and only within the range the genotype permits.
Where the environment gets into a phenotype
The phenotype is the characteristic you can observe, and it is produced by a genotype developing in a set of conditions. Where the conditions can change the outcome, the variation you measure is part genetic and part environmental, and no amount of measuring separates the two in a single individual.
Three worked cases show the effect. Cuttings taken from one hydrangea are genetically identical, and they produce blue flowers in acid soil and pink flowers where the soil is alkaline, because the availability of aluminium ions changes with pH. Himalayan rabbits carry an allele for an enzyme in the fur-pigment pathway that works at low temperature and not at high, so the cool extremities grow black fur while the warm trunk grows white; shave a patch on the back and bind ice to it and the fur that regrows there is black. A wheat plant given plenty of nitrogen grows taller than its genetically identical neighbour on poor soil. In each case the genotype determines the range of possible phenotypes and the conditions determine which value within that range is reached.
Two consequences follow. Environmental variation is not inherited, because nothing about it is written into the DNA of the gametes, which is why a bodybuilder's children are born with the ordinary distribution of muscle mass and why acquired characteristics do not accumulate over generations. And environmental variation is a confounding factor in any investigation of inheritance, which is why breeding experiments grow the plants in one greenhouse and why twin studies are used in human genetics. Twin studies compare similarity between monozygotic and dizygotic twins while accounting, as far as possible, for shared and non-shared environments, prenatal effects and sampling. They estimate heritability in the population and environments studied; they do not isolate genes from environment perfectly.
- Phenotype
- The observable characteristics of an organism, produced by its genotype developing under a particular set of environmental conditions.
- Environmental variation
- Differences in phenotype between organisms caused by the conditions they grew in rather than by their alleles, and therefore not passed to offspring.
Intraspecific and interspecific variation
Intraspecific variation is variation between individuals of the same species: the range of heights in a school hall, the range of shell colours in one population of snails, the range of milk yields in one herd. It is the variation natural selection acts on.
Interspecific variation is variation between members of different species: the difference between a house sparrow and a tree sparrow, or between two species of buttercup. It is what classification is built out of, and it is not raw material for selection within either species, because the two gene pools are separate.
The prefixes follow their ordinary use. Intra means within, as in intracellular; inter means between, as in intermolecular. Measurements from one population show intraspecific variation; a comparison between two named species shows interspecific variation.
| Term | What it compares | A worked example |
|---|---|---|
| Intraspecific variation | Individuals within one species | Wing length in a population of one butterfly species |
| Interspecific variation | Members of different species | Wing length compared between two butterfly species |
TRY IT: Reading a distribution and naming it
A biologist records two sets of data from the same field. The first is the number of plants of a clover species carrying each of two leaf markings, which comes out as 214 plants with a white band and 36 without. The second is the length of the longest leaf on each of 120 plants of that species, which runs from 21 mm to 58 mm with most values near 38 mm and no gaps anywhere in the range.
Name the kind of variation shown by each set, say how you would draw each one, and state what the second set suggests about the number of genes involved.
Check your answer
The leaf marking shows discontinuous variation. There are two distinct categories with nothing in between, which is the definition, and it is drawn as a bar chart with the bars separated because the categories are separate.
The leaf length shows continuous variation. The values run over an unbroken range with no gaps, so it is drawn as a histogram whose bars touch, and the shape described, with most values in the middle and fewer at each end, is the usual bell.
The leaf length is very likely controlled by several genes acting together, that is by polygenes, each contributing a small amount to the total. The environment will also be contributing, since light, water and mineral supply all affect leaf growth, and both together are what fill in the range.
Both sets are intraspecific variation, because every plant measured belongs to the same species. Nothing here compares two species, so interspecific would be the wrong word.
In the exam
- Open by naming the pattern rather than the cause: 'discontinuous, because the individuals fall into distinct categories with no intermediates'. Give the genetic basis next.
- Explain continuous variation with both components, polygenes and environmental conditions.
- Both kinds of variation have a genetic basis. State that continuous characteristics are also modified by conditions, rather than that they are environmental and discontinuous ones genetic.
- Use a bar chart for discontinuous and a histogram for continuous data, and give the reason: the gaps between the bars represent gaps in the population.
- Intra means within one species, inter means between species. Identify which the data come from before choosing the term.
Check yourself
Coat colour in a population of mice is recorded as black, brown or white, in the numbers 61, 28 and 11. Body mass in the same population runs from 14.2 g to 31.6 g, with most animals between 20 g and 24 g and no gaps. Explain which kind of variation each characteristic shows, account for the difference in terms of genes and the environment, and state which kind of graph each set of data requires.
Answer
Coat colour shows discontinuous variation. The population falls into three distinct categories and no mouse is between two of them, which is what the term means.
Body mass shows continuous variation. The values run over an unbroken range from 14.2 g to 31.6 g with no gaps, so any value between the extremes is possible.
Coat colour is controlled by one gene, or by very few, with a small number of alleles. A small number of genotypes gives a small number of phenotypes, and there is no genotype lying between two genotypes, so there is no phenotype lying between two phenotypes. Food supply and temperature do not move a mouse from one colour class to another.
Body mass is controlled by many genes, called polygenes, each adding a small amount to the total. Many loci give many closely spaced classes. On top of that the environment, chiefly the amount of food available and the animal's health and activity, changes the mass an individual reaches, and that further spread fills in whatever gaps the genetics left.
Coat colour is drawn as a bar chart with the bars separated, because the categories are separate. Body mass is drawn as a histogram with the bars touching, because the measurements are continuous and the classes are only a way of grouping them.
Both sets are intraspecific variation, since all the mice belong to one species.
Questions
Question 15 marks
Studies of variation in human characteristics often compare identical twins reared apart with identical twins reared together. Evaluate this design as a way of separating the genetic contribution to a characteristic from the environmental one.
Mark scheme
- B1 identical twins have the same genotype, so any difference in phenotype between two of them must have come from the conditions they grew in rather than from their alleles
- B1 comparing pairs reared apart with pairs reared together changes the environment while the genotype is held constant, which is as close to a controlled experiment as human inheritance allows
- B1 against it: identical twins separated in infancy are rare, so the samples are very small and a few unusual pairs can move the result a long way
- B1 against it: twins placed for adoption are often placed in homes of a similar kind, and every pair shared a uterus before they were separated, so the two environments differ less than the phrase 'reared apart' suggests
- B1 a judgement: the design is the strongest human evidence that a characteristic has a genetic component, but any figure it yields applies to that population and to the range of environments actually sampled, so it is an estimate rather than a fixed proportion
Question 24 marks
Compare continuous variation with discontinuous variation, referring to the genes involved, the effect of the environment and the graph used to display each.
Mark scheme
- B1 continuous variation is controlled by many genes acting together, called polygenes, whereas discontinuous variation is controlled by one gene or very few
- B1 the environment changes a continuous characteristic a great deal, whereas it has little or no effect on a discontinuous one
- B1 a continuous characteristic spreads over an unbroken range with no gaps, whereas a discontinuous one falls into separate classes
- B1 continuous data are drawn as a histogram with the bars touching, whereas discontinuous data are drawn as a bar chart with the bars separated
Question 34 marks
The table gives the length of the longest leaf on each of eight plants of one clover species growing in a single field, constructed for this question rather than measured. Calculate the mean leaf length, and calculate the standard deviation of the eight values to two significant figures.
| Plant | Length of longest leaf / mm |
|---|---|
| 1 | 18 |
| 2 | 20 |
| 3 | 21 |
| 4 | 22 |
| 5 | 22 |
| 6 | 23 |
| 7 | 24 |
| 8 | 26 |
Mark scheme
- M1 mean = sum of the values ÷ number of values = 176 ÷ 8
- A1 mean = 22.0 mm
- M1 the deviations from the mean are −4, −2, −1, 0, 0, 1, 2 and 4, so Σ(x − mean)2 = 16 + 4 + 1 + 0 + 0 + 1 + 4 + 16 = 42 mm2
- A1 standard deviation = √(42 ÷ 7) = √6.0 = 2.4 mm, dividing by n − 1 because this is a sample
Question 44 marks
Body length in one species of fish shows continuous variation. The table gives the body lengths of 200 of these fish netted from a lake on one day, constructed for this question rather than measured, and the distribution has two peaks. Suggest an explanation for the two peaks, and suggest one further measurement that would test it.
| Body length / mm | Number of fish |
|---|---|
| 50 to 59 | 8 |
| 60 to 69 | 31 |
| 70 to 79 | 44 |
| 80 to 89 | 22 |
| 90 to 99 | 9 |
| 100 to 109 | 18 |
| 110 to 119 | 37 |
| 120 to 129 | 24 |
| 130 to 139 | 7 |
Mark scheme
- B1 within each peak the lengths run over an unbroken range with no gaps, so this is not a discontinuous characteristic falling into two distinct classes
- B1 the sample is likely to hold two groups whose mean lengths differ, most plausibly two age groups, since fish hatched this year have had less time to grow than fish hatched the year before; accept males and females differing in mean length
- B1 each group has its own continuous distribution about its own mean, and the two overlap, which is why nine fish are still recorded in the 90 to 99 mm class between the peaks
- A1 record the age of each fish from the growth rings on its scales, or record its sex, and plot the two groups separately: each should then give a single unbroken spread with one peak
Question 54 marks
A characteristic is controlled by several genes, each with two alleles of equal and additive effect. With one such gene there are 3 phenotype classes, and with two such genes there are 5. Calculate the number of phenotype classes with three such genes, and calculate the number with six such genes.
Mark scheme
- M1 each additional gene adds two more possible contributing alleles, so the number of classes follows the pattern (2 × number of genes) + 1
- A1 for three genes: (2 × 3) + 1 = 7 classes
- M1 apply the same pattern to six genes: (2 × 6) + 1
- A1 = 13 classes, closer together than for three genes and easier for environmental variation to blur into an apparently continuous spread
Question 63 marks
A characteristic controlled by four genes, each with two alleles of equal and additive effect, gives nine phenotype classes. Explain why adding more such genes makes the variation appear continuous.
Mark scheme
- B1 each extra gene adds two more possible contributing alleles, so the number of phenotype classes increases
- B1 the difference between one class and the next therefore becomes smaller, until it is smaller than the differences that can be measured
- B1 environmental variation then shifts individuals across those small gaps, so no separate classes remain and the distribution is unbroken
Question 73 marks
Cuttings taken from one hydrangea plant are grown in acid soil and in alkaline soil, and they produce flowers of different colours. Explain what this shows about variation.
Mark scheme
- B1 the cuttings are clones, so all of them have the same genotype and any difference between them cannot be genetic
- B1 the difference in flower colour is therefore environmental variation, caused here by the difference in soil pH and the availability of ions that follows from it
- B1 the phenotype is produced by the genotype developing in a particular environment, and this environmental difference is not passed to any offspring because the alleles are unchanged
Question 83 marks
Himalayan rabbits carry an allele for a fur-pigment enzyme that works at low temperature but not at high temperature, giving black fur on the cool extremities and white fur on the warmer trunk. A patch of white fur is shaved from a rabbit's back and an ice pack is bound over the area while the fur regrows. Explain the colour of the fur that regrows under the ice pack.
Mark scheme
- B1 the allele the rabbit carries codes for an enzyme in the pigment pathway that is only active at low temperature, so pigment is made only where the skin is cool
- B1 binding ice to the shaved patch lowers the local skin temperature below the point at which the enzyme works, even though the genotype at that patch is unchanged
- B1 the fur that regrows under the ice pack will be black, because the local environmental condition, low temperature, rather than a different genotype, determines whether the enzyme is active and pigment is made
Question 93 marks
Two wheat plants of identical genotype are grown, one in soil given plenty of nitrogen fertiliser and one in poor soil with little nitrogen, and the well-fertilised plant grows much taller. Suggest why the two plants differ in height despite being genetically identical, and suggest what would happen to the height difference if seed from each plant were grown together in the same, well-fertilised soil.
Mark scheme
- B1 the height difference is environmental variation caused by the difference in nitrogen availability, not genetic variation, because the two plants share the same genotype
- B1 the phenotype reached is produced by the genotype developing under a particular set of conditions, and the conditions differ here while the genotype does not
- B1 grown together in the same well-fertilised soil, the height difference would disappear or become much smaller, because the environmental cause of the original difference would no longer apply and offspring inherit alleles, not the environmentally produced phenotype of a parent
Question 103 marks
A student claims that height shows continuous variation only because of differences in diet and exercise, and has no genetic basis at all. Explain why this claim is incorrect.
Mark scheme
- B1 height is controlled by many genes, called polygenes, each contributing a small additive amount to the total, so there is a genetic basis to height in the same sense that there is for a discontinuous characteristic such as blood group
- B1 evidence for the genetic component is that, across a range of adequate diets, taller parents tend to have taller children on average, which would not be expected if height had no genetic basis
- B1 the environment adds further variation on top of the genetic component, and only within the range the genotype permits, so height is controlled by both genes and environment together rather than by environment alone
Question 113 marks
Two genetically identical (cloned) strawberry plants are grown, one in a greenhouse and one outdoors, and the outdoor plant produces smaller fruit. Separately, the height of 50 unrelated strawberry plants of different genotypes, grown together in the same greenhouse, is found to vary continuously. Identify which difference is environmental variation and which is at least partly genetic variation, justifying each choice.
Mark scheme
- B1 the fruit-size difference between the two clones is environmental variation, because the two plants are genetically identical, so the difference cannot be caused by different alleles and must be caused by the difference in growing conditions
- B1 the height variation among the 50 unrelated plants is at least partly genetic variation, because the plants have different genotypes but were grown in the same conditions, so the difference cannot be attributed to environment alone
- B1 the logic in each case is the same: holding the genotype constant while the environment varies isolates environmental variation, and holding the environment constant while the genotype varies isolates genetic variation
Question 123 marks
Seed coat colour in a crop plant is controlled by a single gene and falls into two sharply distinct classes regardless of growing conditions, whereas seed mass varies smoothly across a wide range and is heavier in plants grown with more water. Explain, with reference to the number of genes involved, why environmental conditions affect seed mass but not seed coat colour.
Mark scheme
- B1 seed coat colour is discontinuous, controlled by a single gene, so there is no genotype lying between the possible genotypes and therefore no phenotype lying between the two colour classes for environmental conditions to shift an individual across
- B1 seed mass is continuous, controlled by many genes, called polygenes, each contributing a small additive amount, giving many closely spaced classes with very small gaps between them
- B1 environmental conditions such as water availability can shift an individual's value within the range set by its genotype, and because the classes for a polygenic characteristic are so close together this shift is enough to move individuals across the small gaps between them, an effect too small to matter for a characteristic with only a few widely separated genotype classes
Question 132 marks
State what is meant by discontinuous variation, and give one named example of a human characteristic that shows it.
Mark scheme
- B1 variation in which the individuals of a population fall into a small number of distinct categories, with no intermediates between them
- B1 ABO blood group, or another correct example such as the ability to roll the tongue
Question 142 marks
A student measures the shell height of 90 snails from one wood, and separately compares the shell height of two different snail species. Identify which set of data shows intraspecific variation and which shows interspecific variation, and justify each choice.
Mark scheme
- B1 the 90 snails from one wood show intraspecific variation, because all the individuals measured belong to the same species
- B1 the comparison of two species shows interspecific variation, because the measurements come from members of different species
Question 152 marks
State how many different genotypes are possible for the ABO blood group gene in a population, and state how many phenotypes these genotypes give rise to.
Mark scheme
- B1 six genotypes are possible: IAIA, IAIO, IBIB, IBIO, IAIB and IOIO
- B1 these six genotypes give four phenotypes, groups A, B, AB and O, because IA and IB are codominant with each other and both are dominant to IO, so two different genotypes give group A and two give group B
Worth remembering
- Discontinuous variation puts a population into a few distinct classes with no intermediates; continuous variation spreads it over an unbroken range.
- Discontinuous characteristics are controlled by one gene or very few and are not modified by the environment; ABO blood group is the example to quote.
- Continuous characteristics are controlled by polygenes and are modified by the environment; height and mass are the examples to quote.
- More loci means more phenotype classes, closer together, until the classes stop being visible at all.
- The environment changes the phenotype but not the alleles, so environmental variation is not inherited.
- Intraspecific variation is within one species, interspecific variation is between different species.
CHECK YOUR PROGRESS
Rate how confident you are with each objective for this lesson. Ratings are saved in this browser, on this device, unless you sign in.
- Distinguish continuous from discontinuous variation on the number of genes, the effect of the environment, the distribution and the graph.
- Give a named example of each kind, and say why blood group and height behave differently.
- Explain how several genes acting together on one characteristic produce a smooth distribution rather than separate classes.
- Describe how environmental factors modify a phenotype, and say why they are not inherited.
- Use the terms intraspecific and interspecific variation correctly.
Open the full revision checklist to see every objective in the curriculum in one place.
Practise this lesson
WORKBOOK
The written questions from this topic, on paper with room to work, and a separate book of mark schemes. The 2 questions that are set on a diagram stay on this page, where the diagram can be drawn. Free to use; please do not redistribute or sell.