Maths › Algebra and functions › Functions in modelling
Functions in modelling
Choose a function family from the behaviour of the data or context, determine its parameters, interpret the output with units, and state the interval on which the model is reasonable. Use the modelling cycle to define, fit, evaluate and refine the model.
Builds on Log graphs and exponential models and Trigonometric graphs and equations.
IN THIS TOPIC
- Name the four stages of the problem solving cycle, and say which stage a piece of work belongs to.
- Specify a modelling question precisely enough to answer, and plan what to measure and how often.
- Match a situation's behaviour to the function family that describes it.
- Fit and interpret a model's constants in context, and state clearly where the model fails.
COMMON MISCONCEPTION
The best model is the one that fits the data most closely.
Closeness of fit is not by itself evidence that the family is right, since a curve through every data point can still extrapolate badly. The family is chosen from the behaviour: a fixed period gives a trigonometric model, a rate proportional to the amount an exponential, a constant product a reciprocal. A complete answer also names the assumption the model makes and where it fails.
The problem solving cycle
A model is one stage of a longer piece of work, and the stages run in a loop rather than a line. The problem solving cycle is the loop a modelling task runs round: specify the problem, collect the information, process and represent it, interpret the result, and go round again where the interpretation asks for it.
| Stage | What it settles |
|---|---|
| Specify the problem | the question in a form an answer could settle, and what would count as an answer |
| Collect the information | what to measure, how accurately, how often, over how long |
| Process and represent it | which family, which constants, which graph or table |
| Interpret the result | what it says about the situation, and where it stops being trustworthy |
Specifying means turning a general question into one a number can answer. “Is the harbour safe?” names no quantity; “for how many hours a day is the depth at least 4 m?” names the quantity, the threshold and the window, so a model has something to be right or wrong about. Stating what would count as an answer belongs to the same stage, and it fixes what the model has to produce.
Collecting is a design decision rather than a formality: what to measure (depth at the harbour mouth, not at the beach), how precisely, how often (hourly readings will show a twelve-hour tide, daily readings will not), and over how long (a fortnight, so that spring tides and neap tides are both in the record). Sampling too coarsely leaves a gap that no amount of later algebra will fill, which is why this stage sits ahead of the choice of function.
Processing and representing means identifying the family, fitting its constants and showing the behaviour as a graph or a table. Interpreting converts the output back into the quantities of the situation, in metres and hours, with any limitation stated in those terms.
The cycle then returns to the start. Interpreting is the stage at which a model is found to be wrong, and the cycle answers that by returning to the specification rather than patching the result: the assumption that failed is written into a sharper specification, and often it is only the collecting stage that has to be repeated, at a finer interval or over a longer record.
Choosing the family
Each function family corresponds to a characteristic behaviour, and the family is identified before any constants are fitted. Behaviour that repeats at a fixed interval points to trig. A rate proportional to the current amount points to an exponential. Two quantities whose product stays constant point to a reciprocal. Families combine too, a constant plus a trig term for tides, a constant plus a decaying exponential for cooling.
All of that is the processing stage, and it inherits what the two stages before it did: a question with a quantity in it, and a record collected finely enough to show the behaviour being diagnosed.
| Behaviour observed | Family to reach for |
|---|---|
| repeats every fixed interval | trigonometric: a + b sin(kt) |
| rate proportional to amount | exponential: Ae to the kt |
| product of the two quantities constant | reciprocal: k/x |
| steady rate of change | linear: mx + c |
WORKED EXAMPLE
Reading a tide model
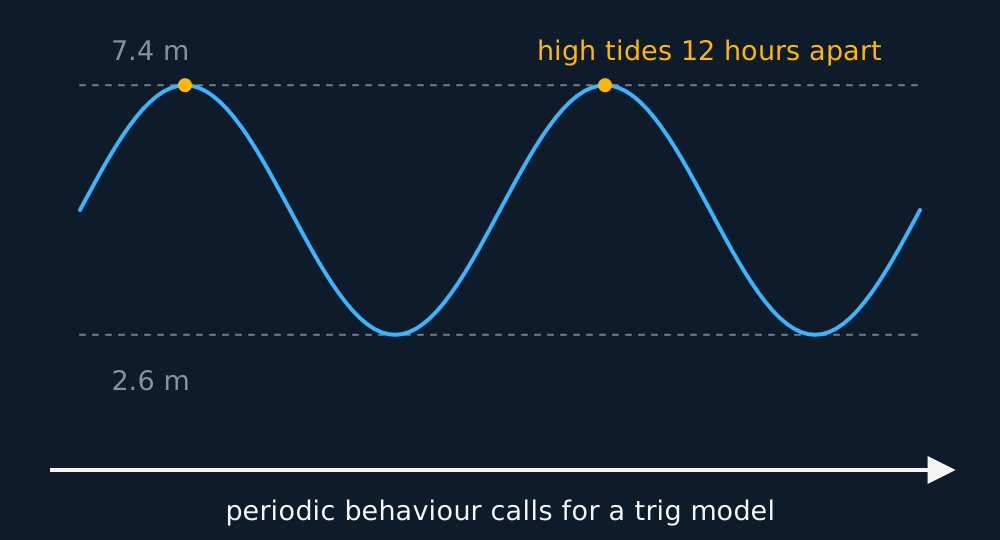
The depth of water in a harbour is modelled by h = 5 + 2.4 sin (30t)°, with t in hours after midnight. Find the period of the tide, the greatest and least depths, and the first time of high tide.
The sine completes a cycle when 30t reaches 360, so the period is 12 hours.
Sine runs between ±1, so h runs from 5 − 2.4 = 2.6 m to 5 + 2.4 = 7.4 m.
High tide needs sin (30t)° = 1, first at 30t = 90, so t = 3, three in the morning.
The 5 is the mean depth in metres, the 2.4 is the tidal amplitude in metres, and the 30 gives the period, since 30t reaches 360 after 12 hours.
The four answers belong to the interpreting stage rather than to the algebra: a period in hours, two depths in metres and a time of day, each read back into the harbour in its own units.
Fitting, and knowing the limits
A fitted model applies only under the conditions it was built for, and closeness of fit is not by itself evidence that the family is right: a curve through every data point can still extrapolate badly. A complete answer names the assumption the model makes, states the conditions under which it fails, and proposes a specific refinement, which returns the work to the specifying stage.
GUIDED PRACTICE
A cooling drink, read in full
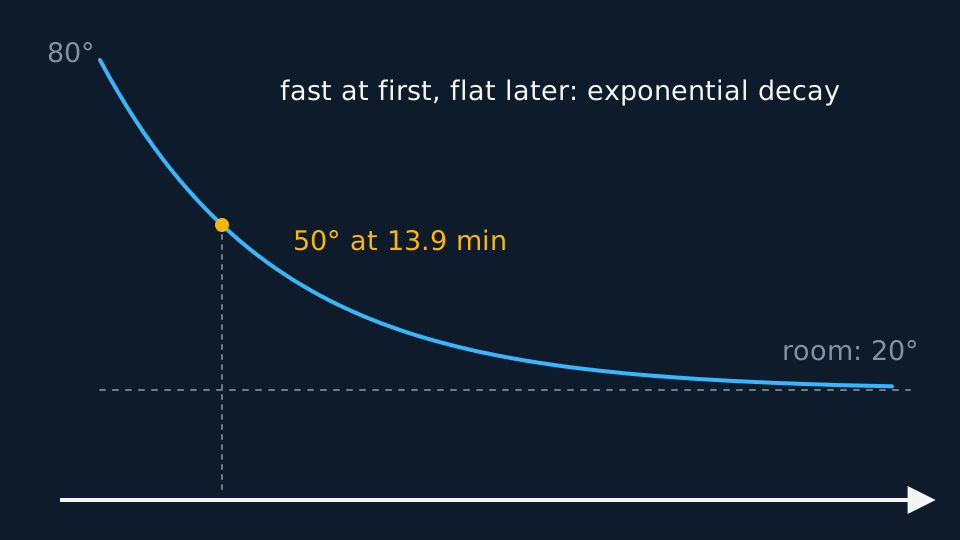
A drink's temperature is modelled by T = 20 + 60e−0.05t, t in minutes. State the initial temperature, explain the physical meaning of the 20, and find when T reaches 50°, before opening the working.
Show the working
At t = 0 the exponential is 1, so T starts at 20 + 60 = 80°.
As t increases the exponential term tends to zero and T tends to 20°, the room temperature. The model has the drink cooling towards its surroundings and not below them.
Setting T = 50 gives e−0.05t = ½, so t = ln 2/0.05 = 13.9 minutes.
A model of the form T = 80e−kt would have the temperature tending to 0°, which the physical situation excludes. The added constant 20 represents the room temperature, and adding it is one complete turn of the cycle: a prediction interpreted, found wrong for large t, and a specification that now includes the surroundings.
INDEPENDENT PRACTICE
Criticise and refine
Hours of daylight in a town are modelled by D = 12 + 4.2 sin (30m)°, with m in months after the spring equinox. State what the model predicts for the longest day, and give one limitation and one refinement.
Show the working
The longest day is 12 + 4.2 = 16.2 hours, three months in, at midsummer.
One limitation. Real daylight is not perfectly sinusoidal, and months are of unequal length, so the model drifts against the calendar across the year.
One refinement. Fit the period in days rather than months, or estimate the amplitude from the town's latitude; either can be tested. “Collect more data” is incomplete unless the type, range or purpose of the additional data is stated.
Both refinements send the work back round the cycle rather than forward: a specification in days rather than months, then a collecting stage of dated sunrise and sunset times, and only then a constant fitted again.
ASSESSMENT FOCUS
- Asked to describe the cycle, give the four stages in order, in your own words, and finish with what sends the work round again. Asked which stage a described piece of work belongs to, name the stage and what it produces.
- A question about what to measure, how often or for how long is a collecting-stage question, and the answer is a number with a reason: hourly, because the tide turns twice a day.
- Identify the family from the behaviour before fitting any constants, and state the behaviour that identifies it.
- Interpret every constant with its units and its physical meaning. “Initial” means the value at t = 0, and long-term behaviour is the limit as t increases.
- A limitation names the assumption that fails and the conditions under which it fails. A refinement changes the model in a stated, testable way.
CHECK YOURSELF
The value of a machine is modelled by V = 500 + 7500e−0.25t pounds after t years. State the initial value, the long-term value, and what the 500 represents.
Show a hint
Evaluate at t = 0, then take the limit as t increases.
Show the answer
At t = 0, V = 500 + 7500 = £8000.
As t increases the exponential term tends to zero, so V tends to £500.
The 500 is the machine's scrap or residual value, the limit the model tends to as t increases, and it distinguishes this model from one of the form Ae to the −kt.
The modelling cycle is specify, collect, process and represent, interpret, then repeat with a sharper question.
The behaviour determines the family: a fixed period gives a trigonometric model, a rate proportional to the amount gives an exponential model, and a constant product gives a reciprocal model.
Fit the constants, interpret them with units, and state the conditions under which the model fails.
WORKBOOK
Printable practice for this topic: original exam-style questions with room to work, and a fully worked answer book. Free to use; please do not redistribute or sell.
Or read them with their worked answers on the functions in modelling questions page.
USED LATER IN
CHECK YOUR PROGRESS
Rate how confident you feel with each objective for this lesson. Ratings are saved in this browser, on this device, unless you sign in.
- Name the four stages of the problem solving cycle, and say which stage a piece of work belongs to.
- Specify a modelling question precisely enough to answer, and plan what to measure and how often.
- Match a situation's behaviour to the function family that describes it.
- Fit and interpret a model's constants in context, and state clearly where the model fails.
Open the full revision checklist to see every objective in the course in one place.