Chemistry › Rate equations › Finding orders from initial rates, half-lives and graphs
Finding orders from initial rates, half-lives and graphs
An order is found by changing a concentration and watching the rate. The initial-rates method compares the start of several runs; continuous monitoring follows one run to the end and reads rates and half-lives from the curve. The iodination of propanone, followed with a colorimeter, does both and is the usual way of carrying out required practical 7.
Key terms Every definition in rate equations, lesson by lesson
Before this Rate equations, orders of reaction and the rate constant – what zero, first and second order do to the graphs · Measuring the rate of a reaction – 1/t as a measure of rate · Redox titrations: manganate(VII) and thiosulfate – the iodine–thiosulfate titration with starch
COMMON MISCONCEPTION
Any rate measured during the reaction will do for comparing runs, as long as it is measured the same way each time.
Rates must be compared at known concentrations, and only at t = 0 are they the ones that were mixed. Later, every reactant has fallen by an amount that differs from run to run, so a rate measured then belongs to an unknown mixture. The initial rate is the gradient of a tangent at t = 0, or 1/t from a clock reaction.
What you should be able to do
- Deduce the order with respect to each reactant from a table of initial rates, including runs in which two concentrations change.
- Explain why 1/t from a clock reaction is proportional to the initial rate.
- Find a rate from the tangent to a concentration–time graph, and use successive half-lives to identify the order.
- Explain the isolation method, and why a run with the other reactants in large excess gives the order with respect to one reactant only.
- Describe how to follow the iodine and propanone reaction by colorimetry and by titration, and explain the purpose of each step.
- Evaluate the errors in that practical and suggest improvements.
The initial-rates method
The rate of most reactions falls as the reactants are used up, so a rate measured two minutes into a run depends on concentrations nobody chose. At the moment of mixing, every concentration is the one that was measured out. The initial rate, the rate at t = 0, is the fair basis for comparing runs.
The method is a set of runs at one temperature. Between two runs, change the concentration of one substance only and keep every other concentration the same. Find the initial rate of each. If the concentration went up by a factor c and the rate by a factor r, the order n is the power that turns c into r, so r = cⁿ. Doubling a concentration and getting four times the rate means second order, because 2² = 4.
There are two ways to get an initial rate. One is to follow the concentration for the first part of the run and draw the tangent to the curve at t = 0; its gradient is the initial rate. The other is a clock reaction, which measures the time t taken to make a fixed, small amount of product. Because the amount is fixed and small, the rate over that time is close to the initial rate, and rate is proportional to 1/t.
- Initial rate
- The rate of reaction at the moment the reactants are mixed, found from the gradient of the tangent to a concentration–time graph at t = 0.
- Clock reaction
- A reaction in which the time taken to form a fixed amount of product is measured, usually by a sudden colour change; 1/t is proportional to the initial rate.
Describe the drawing
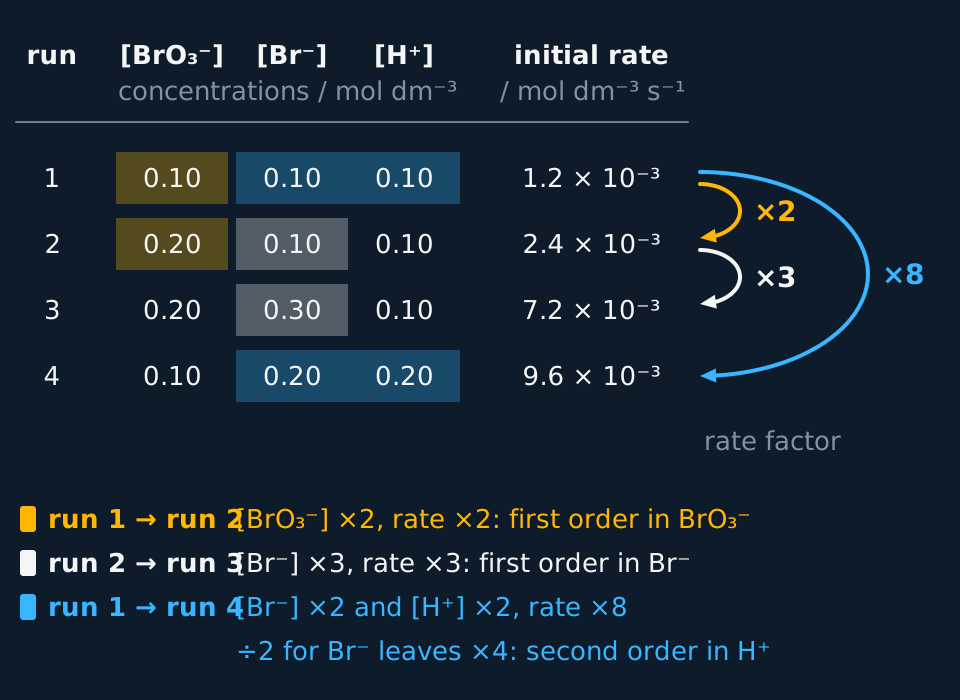
A table of four runs of the bromate, bromide and acid reaction giving the three starting concentrations and the initial rate of each. Curved arrows in the right margin join run 1 to run 2, where only bromate doubles and the rate doubles; run 2 to run 3, where only bromide triples and the rate triples; and run 1 to run 4, where bromide and hydrogen ions both double and the rate rises eight times. The changed cells are shaded, and the working below concludes first order in bromate and bromide and second order in hydrogen ions.
Orders from an initial-rates table of four runs
Bromate ions oxidise bromide ions in acid: BrO₃⁻(aq) + 5Br⁻(aq) + 6H⁺(aq) → 3Br₂(aq) + 3H₂O(l). At a fixed temperature: run 1, [BrO₃⁻] = 0.10, [Br⁻] = 0.10, [H⁺] = 0.10, initial rate 1.2 × 10⁻³; run 2, 0.20, 0.10, 0.10, rate 2.4 × 10⁻³; run 3, 0.20, 0.30, 0.10, rate 7.2 × 10⁻³; run 4, 0.10, 0.20, 0.20, rate 9.6 × 10⁻³. Concentrations are in mol dm⁻³ and rates in mol dm⁻³ s⁻¹. Deduce the rate equation and calculate k.
Show the working
Runs 1 and 2: only [BrO₃⁻] changes, and it doubles. The rate doubles, 2.4 ÷ 1.2 = 2, so the reaction is first order with respect to BrO₃⁻.
Runs 2 and 3: only [Br⁻] changes, and it triples. The rate triples, 7.2 ÷ 2.4 = 3, so it is first order with respect to Br⁻.
Runs 1 and 4: [Br⁻] and [H⁺] both double, and the rate rises by 9.6 ÷ 1.2 = 8. Doubling Br⁻ accounts for a factor of 2, which leaves 8 ÷ 2 = 4 for doubling H⁺. Since 2² = 4, the reaction is second order with respect to H⁺.
The rate equation is rate = k[BrO₃⁻][Br⁻][H⁺]², fourth order overall. From run 1, k = 1.2 × 10⁻³ ÷ (0.10 × 0.10 × 0.10²) = 12 mol⁻³ dm⁹ s⁻¹. Any other run gives the same value, which is a check on the orders.
Run 4 is the harder kind of comparison. Two concentrations changed, so the effect of the one already known is divided out first and what is left belongs to the other. A table with no clean pair of runs for a substance always needs this step.
The iodine clock method
The iodine clock gives initial rates by timing, with no graph to draw. Edexcel sets it as core practical 13b, and it is a usual way of carrying out the initial-rates half of required practical 7.
Hydrogen peroxide oxidises iodide ions to iodine in acid. A small, known amount of sodium thiosulfate in the flask turns the iodine back into iodide as fast as it forms. When the thiosulfate is used up, the next iodine meets the starch that is also present and the mixture turns blue-black at once. The same amount of iodine has formed in every run, so a shorter time means a faster rate.
H₂O₂(aq) + 2I⁻(aq) + 2H⁺(aq) → I₂(aq) + 2H₂O(l)The reaction being timed.
I₂(aq) + 2S₂O₃²⁻(aq) → 2I⁻(aq) + S₄O₆²⁻(aq)Fast. It removes the iodine until the thiosulfate runs out.
Apparatus: burettes for 0.100 mol dm⁻³ potassium iodide, 0.25 mol dm⁻³ sulfuric acid, 0.0050 mol dm⁻³ sodium thiosulfate, 0.10 mol dm⁻³ hydrogen peroxide and distilled water; starch solution; a 100 cm³ conical flask on a white tile; a stopclock; a thermometer.
| Step | What to do | Why |
|---|---|---|
| 1 | Run 25.0 cm³ of potassium iodide, 10.0 cm³ of sulfuric acid, 5.0 cm³ of sodium thiosulfate and 1 cm³ of starch into the flask | Every reagent but one is in the flask, so the run starts only when the last is added |
| 2 | Add 10.0 cm³ of hydrogen peroxide quickly, swirl, and start the stopclock as it goes in | Time zero is the moment every concentration has its starting value |
| 3 | Stop the clock when the blue-black colour first appears, and record t | The colour marks the moment a fixed amount of iodine has formed |
| 4 | Repeat with 20.0, 15.0, 10.0 and 5.0 cm³ of potassium iodide, each made up to 25.0 cm³ with water | Only [I⁻] changes; the total volume stays at 51 cm³, so the other concentrations do not |
| 5 | Repeat each run, with every solution at the same temperature | k depends on temperature, and repeats show the scatter |
These results are idealised; real ones scatter a little.
| Volume of KI / cm³ | Volume of water / cm³ | t / s | 1/t / s⁻¹ |
|---|---|---|---|
| 25.0 | 0.0 | 40 | 0.0250 |
| 20.0 | 5.0 | 50 | 0.0200 |
| 15.0 | 10.0 | 67 | 0.0149 |
| 10.0 | 15.0 | 100 | 0.0100 |
| 5.0 | 20.0 | 200 | 0.0050 |
With the total volume fixed, the volume of potassium iodide is proportional to [I⁻] in the mixture. Halving it from 20.0 to 10.0 cm³ halves 1/t, from 0.0200 to 0.0100 s⁻¹, so a graph of 1/t against the volume of iodide is a straight line through the origin and the reaction is first order with respect to iodide. A second set of runs, the iodide fixed and the hydrogen peroxide varied, shows that it is first order in H₂O₂ as well.
The colour change is sharp, so the end of each run is easy to judge; the larger errors are a late start to the clock on the fastest runs and a change in room temperature between runs. The sulfuric acid and the hydrogen peroxide can irritate the eyes: wear eye protection, and check the CLEAPSS Hazcards and the school's risk assessment before starting.
Following one run: tangents and half-lives
Continuous monitoring follows a single reaction mixture from start to finish, measuring something that depends on concentration at regular intervals. A coloured reactant or product can be followed with a colorimeter: iodine, bromine and manganate(VII) all absorb visible light. A gas can be collected in a syringe, or its loss followed on a balance. A change in the concentration of H⁺ can be followed with a pH meter. Or small samples can be withdrawn and titrated.
| Method | What is measured | Suits a reaction that | Example |
|---|---|---|---|
| Colorimetry | Absorbance of light of one colour | has one coloured reactant or product | Iodine in the iodination of propanone |
| Gas collection | Volume of gas in a syringe | gives off a gas that is not very soluble | Oxygen from hydrogen peroxide with manganese(IV) oxide |
| Loss of mass | Mass of the flask on a balance | gives off a dense gas that escapes | Carbon dioxide from marble chips and hydrochloric acid |
| pH | pH with a meter | makes or uses H⁺ or OH⁻ | Hydrolysis of 2-chloro-2-methylpropane, which makes H⁺ and Cl⁻ |
| Electrical conductivity | Conductivity with a probe | changes the number or the kind of ions | Ethyl ethanoate with OH⁻, where CH₃COO⁻ replaces the more conductive OH⁻ |
| Titration of quenched samples | Titre of each sample | has a reactant or product that can be titrated | Iodine with thiosulfate; acid or alkali with a standard solution |
The choice comes down to which substance changes in a way that can be measured without stopping the reaction. The first five methods read the mixture as it reacts; titration takes it apart a sample at a time. For a reaction not met before, a suitable method is deduced from its equation, and the usual answers are a colour, a gas or a change in the ions.
Titration needs one extra step. The reaction carries on in the sample while it waits to be titrated, so it is quenched the moment it is withdrawn: run into iced water, or into a solution that removes a catalyst or a reactant. The titre then gives the concentration at the time of sampling.
Describe the drawing
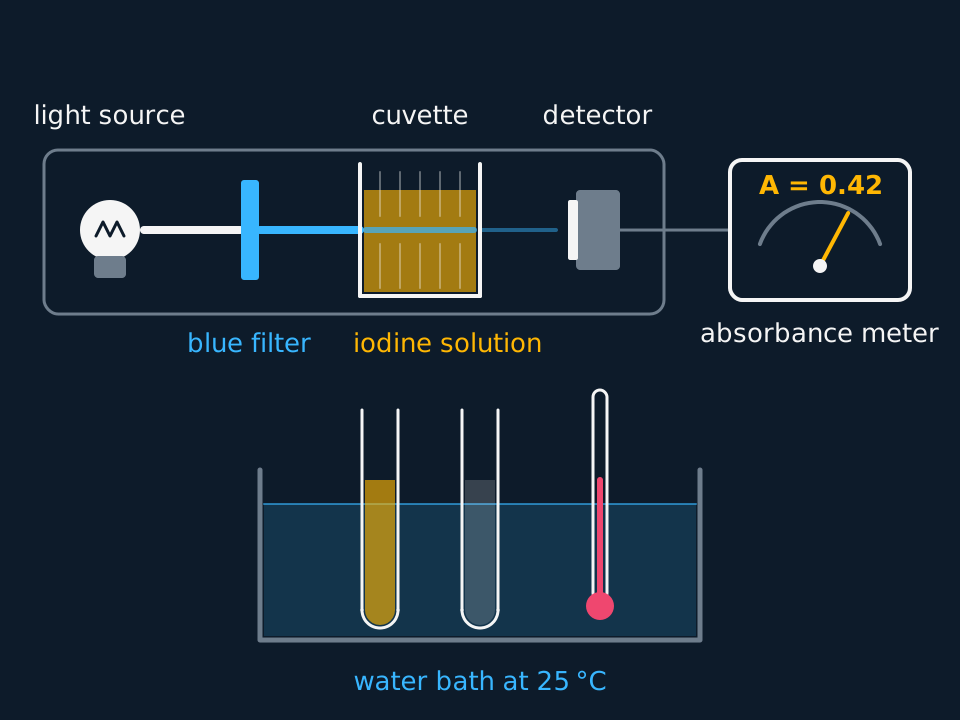
A colorimeter in cross-section with light travelling left to right: a white bulb, a blue filter, a square cuvette of pale yellow-brown iodine solution with its clear faces in the beam and its ribbed faces towards the reader, a photocell detector and a meter reading absorbance. The beam is white before the filter, blue after it and fainter after the cuvette. Below, a water bath at 25 degrees Celsius holds two boiling tubes and a thermometer.
Continuous monitoring gives a concentration–time graph. A tangent drawn at any time gives the rate at that moment, and tangents at several points give a set of rates at different concentrations. Plotting those rates against concentration shows the order from the shape: horizontal for zero, straight through the origin for first, curving upwards for second.
The half-life gives a quicker test. Read the time for the concentration to fall from its starting value to half, then from half to a quarter, then from a quarter to an eighth. If the three times are equal, the reaction is first order. If each is double the last, it is second order. If each is half the last, it is zero order, because a zero-order reactant is used at a steady rate and each halving starts with less to remove.
Describe the drawing
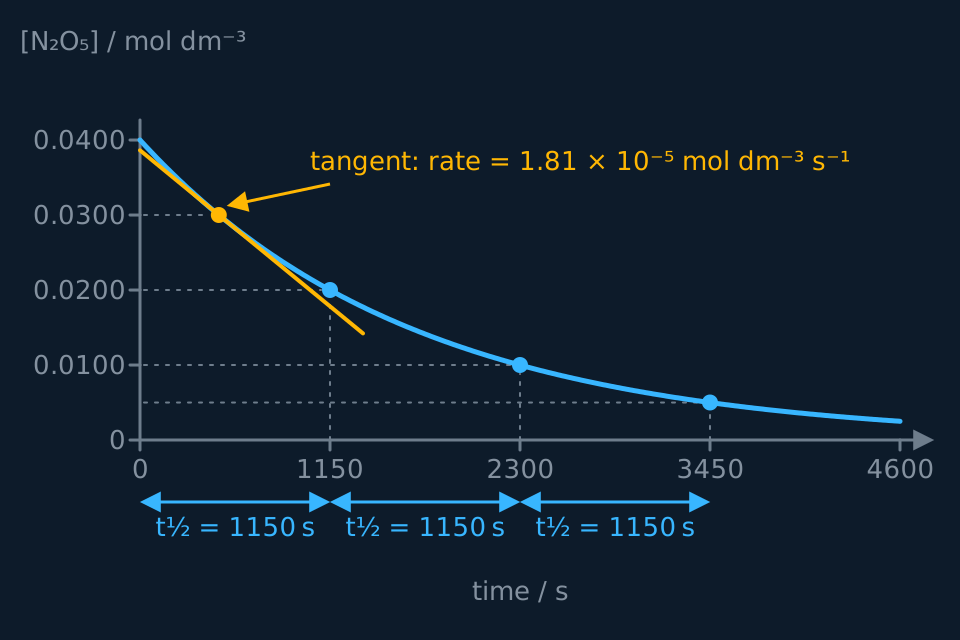
Concentration of dinitrogen pentoxide against time, falling from 0.0400 mol per cubic decimetre in a smooth exponential decay. Dashed construction lines mark 0.0200 at 1150 seconds, 0.0100 at 2300 and 0.00500 at 3450, and three equal brackets under the time axis each read t half equals 1150 s. An amber tangent touches the curve at 0.0300, labelled with its gradient, a rate of 1.81 times ten to the minus five.
- Continuous monitoring
- Following one reaction mixture by measuring a property that depends on concentration at regular intervals as the reaction proceeds.
- Half-life, t½
- The time taken for the concentration of a reactant to fall to half of its starting value.
- Absorbance
- A measure of how much light of a chosen colour a solution absorbs; for a dilute solution it is proportional to the concentration of the coloured species.
- Calibration graph
- A graph of absorbance against known concentrations of the coloured species, used to convert each absorbance reading into a concentration.
- Quenching
- Stopping the reaction in a withdrawn sample, by cooling, dilution or removing a reactant or catalyst, so its composition at that moment can be measured.
TRY IT: Half-lives that keep doubling
A reactant's concentration falls from 0.80 to 0.40 mol dm⁻³ in 40 s, from 0.40 to 0.20 in a further 80 s, and from 0.20 to 0.10 in a further 160 s. Identify the order with respect to this reactant and explain how the half-lives show it.
Check your answer
The half-lives are 40 s, 80 s and 160 s, each double the one before, so they are not constant and the reaction is not first order.
For a second-order reactant the rate depends on the square of the concentration. Each time the concentration halves, the rate falls to a quarter while only half as much is left to remove, so the next halving takes twice as long.
The reaction is second order with respect to this reactant.
Required practical 7: iodine and propanone
Required practical 7 is measuring the rate of a reaction by an initial-rate method and by a continuous monitoring method, and every board sets both methods under its own numbering. The acid-catalysed iodination of propanone serves for both.
Propanone and acid are used in large excess, a hundred times or more the concentration of iodine, so their concentrations hardly change during a run. Iodine is the only concentration that falls, and one run followed with a colorimeter shows how its concentration changes with time. Further runs with different starting concentrations of propanone and of acid then give their orders by initial rates.
Swamping the other reactants like this is the isolation method, and it changes what one run measures. With [CH₃COCH₃] and [H⁺] fixed, the rate equation behaves as rate = k′, where k′ = k[CH₃COCH₃][H⁺] is constant for that run. Had iodine been first order, the run would have followed rate = k′[I₂] and shown a constant half-life, although the reaction is not first order overall; such a run is called pseudo-first-order. Either way the order found belongs to iodine alone, and k′ is not k: dividing k′ by the fixed concentrations of the reactants in excess gives k.
- Isolation method
- Finding the order with respect to one reactant by putting every other reactant in large excess, so that only the isolated reactant's concentration changes during the run.
Apparatus: a colorimeter with a blue filter and cuvettes; burettes or graduated pipettes for 2.00 mol dm⁻³ propanone, 1.00 mol dm⁻³ hydrochloric acid, 0.0100 mol dm⁻³ iodine in potassium iodide solution and distilled water; boiling tubes in a water bath at 25 °C with a thermometer; a stopclock. For the titration route, add a 10.0 cm³ pipette, conical flasks each holding 10 cm³ of 0.5 mol dm⁻³ sodium hydrogencarbonate, a burette of 0.00500 mol dm⁻³ sodium thiosulfate, and starch solution.
| Step | What to do | Why |
|---|---|---|
| 1 | Measure the absorbance of iodine solutions of known concentration, 0.0005 to 0.0025 mol dm⁻³, with the blue filter, and plot absorbance against concentration | The calibration graph converts each absorbance into a concentration of iodine |
| 2 | Zero the colorimeter with a cuvette of the propanone and acid mixture containing no iodine | The reading then measures the iodine alone |
| 3 | Run 10.0 cm³ of propanone, 10.0 cm³ of acid and 10.0 cm³ of water into one boiling tube, and 10.0 cm³ of iodine solution into another; stand both in the water bath for 10 minutes | Both solutions start at 25 °C, since k depends on temperature |
| 4 | Pour the iodine into the propanone mixture, start the stopclock at the moment of mixing, shake, and fill a cuvette | Time zero is the moment every concentration has its starting value |
| 5 | Read the absorbance every 30 s for 10 minutes, or until the solution is colourless | Many readings fix the line and show whether it is straight or curved |
| 6 | Repeat with 5.0 cm³ of propanone and 15.0 cm³ of water, then with 5.0 cm³ of acid and 15.0 cm³ of water, then with 5.0 cm³ of iodine and 5.0 cm³ of extra water | One concentration is halved each time and the total volume stays at 40.0 cm³, so the others do not change |
| 7 | For the titration route, withdraw 10.0 cm³ of a larger mixture every 2 minutes and run it into sodium hydrogencarbonate; titrate the iodine with thiosulfate, adding starch near the end point | The hydrogencarbonate neutralises the acid catalyst, which stops the reaction in the sample |
In the first run the mixture holds 0.500 mol dm⁻³ propanone, 0.250 mol dm⁻³ H⁺ and 0.00250 mol dm⁻³ iodine. In the titration route the iodine in each 10.0 cm³ sample reacts with thiosulfate, I₂(aq) + 2S₂O₃²⁻(aq) → 2I⁻(aq) + S₄O₆²⁻(aq), so a sample taken at the start needs 10.0 cm³ of the 0.00500 mol dm⁻³ solution.
Risks. Propanone is highly flammable, so keep it away from flames. The product, iodopropanone, irritates the eyes and nose, so work in a well-ventilated room and do not smell the mixtures. Iodine solution stains skin and clothing. Wear eye protection throughout. Check the CLEAPSS Hazcards and the school's risk assessment before starting, and where they differ from the advice here, follow them.
Results and the errors that matter
These readings from the first run are idealised; real ones scatter a little about the line.
| Time / s | 0 | 60 | 120 | 180 | 240 | 300 |
|---|---|---|---|---|---|---|
| Absorbance | 0.80 | 0.73 | 0.67 | 0.60 | 0.53 | 0.46 |
The absorbance falls by very nearly the same amount in every minute, so the graph of iodine concentration against time is a straight line and the rate does not change as the iodine is used up. The reaction is zero order with respect to iodine. The calibration gave an absorbance of 0.80 for 0.00250 mol dm⁻³, a factor of 320 dm³ mol⁻¹. The gradient is −0.34 ÷ 300 = −1.13 × 10⁻³ s⁻¹ in absorbance, and dividing by 320 gives a rate of 3.5 × 10⁻⁶ mol dm⁻³ s⁻¹.
The other runs complete the rate equation. Halving the propanone halves the gradient, and so does halving the acid: each is first order. Halving the iodine gives a line that starts at half the height and has the same gradient, which confirms zero order. The rate equation is rate = k[CH₃COCH₃][H⁺], and from the first run k = 3.5 × 10⁻⁶ ÷ (0.500 × 0.250) = 2.8 × 10⁻⁵ mol⁻¹ dm³ s⁻¹ at 25 °C.
Temperature is the error that matters most, because k depends on it steeply. For this reaction a rise of 1 °C near room temperature raises the rate by roughly a tenth, which is larger than the uncertainty in any volume. A late start to the stopclock matters less than it seems: the line is straight, so a late start moves the line sideways without changing its gradient.
| Limitation | Effect | Improvement |
|---|---|---|
| The cuvette warms inside the colorimeter | The rate rises during the run | Read quickly and check the temperature of the mixture at the end |
| Solutions not at the bath temperature when mixed | Each run is at a slightly different temperature | Equilibrate both tubes for the same time and check with a thermometer |
| Iodine is volatile | Iodine is lost from an open tube, not only by reaction | Keep tubes and cuvettes stoppered or covered |
| Fingerprints or scratches on the cuvette | Absorbance readings too high | Hold it by the ridged sides and wipe the clear faces |
| Delay between withdrawing and quenching a sample | The titre gives a concentration later than the recorded time | Run the sample straight into the hydrogencarbonate and record the time at that moment |
| Starch added too early | Iodine binds to the starch and the end point is blurred | Add starch only when the solution is pale yellow |
The orders are only as good as the comparison between runs. Every run should use the same stock solutions, the same bath and the same colorimeter, and any run that disagrees with its repeat should be repeated again before the order is decided.
Other boards: practical numbers, k from a half-life and choosing a method
OCR assesses the skills of required practical 7 in two practical activity groups: PAG 9 finds a rate by continuous monitoring and PAG 10 by an initial-rates method such as a clock. Edexcel's core practical 13a follows the propanone and iodine reaction by titration of quenched samples, the titration route in the RP7 method, and core practical 13b is the iodine clock method.
OCR and Cambridge require the relation between the half-life and the rate constant of a first-order reaction, k = ln 2 ÷ t½, and set calculations on it. AQA's specification does not name the relation, though the constant half-life is the test of first order on every paper.
A larger k means a faster decay and a shorter half-life:
k = ln 2 ÷ t½ = 0.693 ÷ t½First order only. With t½ in seconds, k is in s⁻¹.
The rate constant from the half-life of a first-order decay
Dinitrogen pentoxide decomposes at 318 K: 2N₂O₅(g) → 4NO₂(g) + O₂(g). A concentration–time graph starting at 0.0400 mol dm⁻³ falls to 0.0200 at 1140 s, to 0.0100 at 2300 s and to 0.00500 at 3450 s. Show that the reaction is first order, calculate k, find the rate when [N₂O₅] = 0.0300 mol dm⁻³, and give the time for the concentration to fall to 0.00250 mol dm⁻³.
Show the working
Successive half-lives: 1140 s, then 2300 − 1140 = 1160 s, then 3450 − 2300 = 1150 s. They are the same within the precision of reading a graph, so the reaction is first order. Mean t½ = 1150 s.
k = 0.693 ÷ 1150 = 6.03 × 10⁻⁴ s⁻¹.
Rate = k[N₂O₅] = 6.03 × 10⁻⁴ × 0.0300 = 1.81 × 10⁻⁵ mol dm⁻³ s⁻¹ to three significant figures.
From 0.0400 to 0.00250 is a fall to one sixteenth, which is four half-lives: 4 × 1150 = 4600 s, or about 77 minutes. The coefficient of 2 in the equation played no part, because the order was measured.
Edexcel also asks for a suitable method of following a reaction to be deduced from the equation of a reaction not met before. The usual answers: a coloured species suits colorimetry, a gas suits a syringe or a balance, and a change in the number or kind of ions suits pH or conductivity.
In the exam
- An order from an initial-rates table comes with its evidence: the scheme wants the two runs named and the factor on the concentration set beside the factor on the rate, then the order.
- Where two concentrations change at once, divide out the effect of the one whose order is known before deducing the other.
- For first order, read at least two successive half-lives from the graph and state that they are equal; a single half-life is not credited as evidence.
- On an Explain question about RP7, state that propanone and acid are in large excess so that only the iodine concentration changes, and that sodium hydrogencarbonate quenches the sample by neutralising the acid catalyst.
- Temperature control is the improvement to name first for a rate practical, because k depends on temperature. 'Repeat the experiment' on its own earns no credit as an improvement.
Check yourself
A student follows the iodine and propanone reaction with a colorimeter and gets a straight line of absorbance against time. She concludes that the reaction is zero order overall. Explain what her graph does show, and what she would need to do to find the overall order.
Answer
A straight line means the iodine concentration falls at a steady rate, so the rate does not depend on the iodine concentration. The graph shows that the reaction is zero order with respect to iodine, and nothing more.
Propanone and acid were in large excess, so their concentrations hardly changed during the run. The graph cannot show their orders, because they were not varied.
To find the overall order she must repeat the run with a different starting concentration of propanone, then of acid, changing one at a time and keeping the total volume and temperature the same. Each halving halves the gradient, so both are first order and the reaction is second order overall.
Questions
Question 16 marks
Describe how to find the order with respect to propanone in the acid-catalysed reaction of propanone with iodine, using a colorimeter.
Mark scheme
Indicative content
- calibrate: measure the absorbance of iodine solutions of known concentration with a blue filter and plot a calibration graph
- bring the propanone, acid and water mixture and the iodine solution to the same temperature in a water bath before mixing
- mix, start the timer at the moment of mixing, and record the absorbance at regular intervals such as every 30 s
- convert absorbance to iodine concentration, plot it against time and find the gradient, which is the rate
- repeat with a different volume of propanone, made up with water to the same total volume so that the other concentrations and the temperature are unchanged
- compare the factor on the propanone concentration with the factor on the rate: halving propanone halves the rate, so it is first order
Levels
- Level 3 (5–6 marks) the calibration graph, the temperature control before mixing, the timing and regular absorbance readings, the conversion to concentration and the rate from the gradient, and the repeat with a different propanone concentration at the same total volume are all present, with the order deduced from the factors on concentration and rate
- Level 2 (3–4 marks) the colorimeter follows the iodine concentration with time and the run is repeated with a different propanone concentration; the calibration, the constant concentrations of iodine and acid, or the step from rates to order is not there
- Level 1 (1–2 marks) the colorimeter is said to measure the colour of iodine; the propanone concentration is often changed along with the total volume, so two things vary at once
Question 25 marks
Calculate the rate constant, with its units, for the reaction of A with B, after deducing the order with respect to each from the initial rates in the table.
| Run | [A] / mol dm⁻³ | [B] / mol dm⁻³ | Initial rate / mol dm⁻³ s⁻¹ |
|---|---|---|---|
| 1 | 0.010 | 0.020 | 3.0 × 10⁻⁵ |
| 2 | 0.020 | 0.020 | 1.2 × 10⁻⁴ |
| 3 | 0.010 | 0.060 | 9.0 × 10⁻⁵ |
Mark scheme
- B1 runs 1 and 2: [A] doubles and the rate is multiplied by 4, so the reaction is second order in A
- B1 runs 1 and 3: [B] triples and the rate triples, so the reaction is first order in B
- M1 rate = k[A]²[B], so k = 3.0 × 10⁻⁵ ÷ (0.010² × 0.020) = 3.0 × 10⁻⁵ ÷ 2.0 × 10⁻⁶
- M1 units: (mol dm⁻³ s⁻¹) ÷ (mol dm⁻³)³ for an overall order of three
- A1 k = 15 mol⁻² dm⁶ s⁻¹, to two significant figures; accept dm⁶ mol⁻² s⁻¹, and allow error carried forward from wrong orders
Question 34 marks
State what is meant by the half-life of a reaction, and identify the order shown by each set of successive half-lives in the table.
| Reactant | First t½ / s | Second t½ / s | Third t½ / s |
|---|---|---|---|
| P | 25 | 25 | 25 |
| Q | 60 | 30 | 15 |
| R | 20 | 40 | 80 |
Mark scheme
- B1 the half-life is the time taken for the concentration of a reactant to fall to half of its starting value
- B1 P is first order, since its half-life is constant
- B1 Q is zero order, since each half-life is half the one before
- B1 R is second order, since each half-life is double the one before
All 20 questions with mark schemes, the other 17 set out in full on the question page.
Worth remembering
- Divide out the effect of the known order first when two concentrations change between a pair of runs.
- 1/t measures the rate only if every run makes the same fixed amount of product.
- A chord between two points gives an average rate; the rate at a moment needs the tangent.
- One half-life shows nothing about the order; two or more equal ones show first order.
- A straight line in the RP7 run shows zero order in iodine only: propanone and acid were not varied in it.
CHECK YOUR PROGRESS
Rate how confident you are with each objective for this lesson. Ratings are saved in this browser, on this device, unless you sign in.
- Deduce the order with respect to each reactant from a table of initial rates, including runs in which two concentrations change.
- Explain why 1/t from a clock reaction is proportional to the initial rate.
- Find a rate from the tangent to a concentration–time graph, and use successive half-lives to identify the order.
- Explain the isolation method, and why a run with the other reactants in large excess gives the order with respect to one reactant only.
- Describe how to follow the iodine and propanone reaction by colorimetry and by titration, and explain the purpose of each step.
- Evaluate the errors in that practical and suggest improvements.
Open the full revision checklist to see every objective in the curriculum in one place.
Practise this lesson
WORKBOOK
The written questions from this topic, on paper with room to work, and a separate book of mark schemes. The 6 questions that are set on a diagram stay on this page, where the diagram can be drawn. Free to use; please do not redistribute or sell.