Chemistry › Working in the laboratory › Measurement, uncertainty and significant figures in chemistry
Measurement, uncertainty and significant figures in chemistry
Every reading taken in a chemistry laboratory carries an uncertainty set by the apparatus: half a division on a burette, one in the last digit on a balance. How large that uncertainty is, what happens to it when readings are subtracted or combined in a calculation, and how to make it smaller decide how far a result can be trusted. So does the difference between a precise result and an accurate one.
Key terms Every definition in working in the laboratory, lesson by lesson
Before this GCSE required practicals: reading a scale and repeating a measurement · GCSE mathematics: rounding to significant figures and calculating a percentage
COMMON MISCONCEPTION
If my titres all agree with each other, my answer must be right.
Concordant titres show precision, not accuracy. A pipette rinsed with water, or an acid stronger than its label, shifts every titre the same way: the repeats agree and the answer is still wrong. Agreement rules out random error only; the uncertainty of the apparatus and a comparison with a known value are what say how far out a result is.
What you should be able to do
- State the uncertainty of a single reading on a burette, a pipette, a balance and a thermometer, and explain why a difference of two readings carries twice that.
- Calculate a percentage uncertainty, and combine percentage uncertainties for a result calculated from several measurements.
- Suggest how to reduce the percentage uncertainty of a measurement by changing the quantity measured or the apparatus.
- Give a calculated answer to the number of significant figures the data justify.
- Distinguish accuracy from precision, and random error from systematic error, with an example of each from a titration.
- Rearrange an equation, convert units, use logarithms, and find a gradient and intercept from a straight-line graph.
Reading a scale
Every reading has an uncertainty, and the apparatus sets its size. A burette shows how. The surface of a water-based solution in the tube is not flat: it curves down in the middle where it meets the glass, and the curved surface is the meniscus. A burette is read at the bottom of that curve, with the eye level with it, against lines marked every 0.10 cm³.
The bottom of the meniscus usually sits between two lines rather than on one. Halfway between them is as fine as the eye can judge, so a burette is read to the nearest 0.05 cm³. Readings are written to two decimal places and the second decimal is always 0 or 5: 23.40 cm³ or 23.45 cm³, never 23.4 or 23.43. Each reading is uncertain by half a division, ±0.05 cm³.
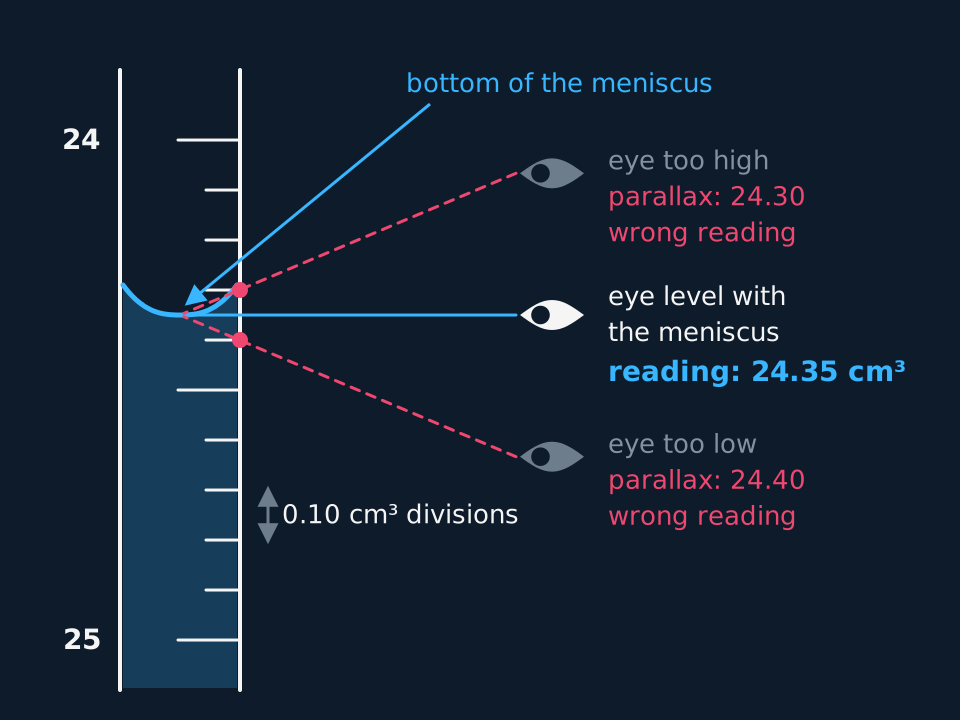
Describe the drawing
A close-up of a burette scale from 24 at the top to 25 below it, with a line every 0.10 cm³. The liquid surface curves down in the middle and its lowest point sits halfway between the 24.30 and 24.40 lines. An eye level with it looks straight across, giving the reading 24.35 cm³. Two grey eyes, one higher and one lower, look along sloping dashed lines that cross the scale at 24.30 and 24.40: parallax gives a wrong reading.
Reading from above or below the meniscus lines it up against the wrong mark, a parallax error. The cure is to bring the eye level with the meniscus, not to read more carefully from where the eye already is.
That half-division is the resolution of the instrument at work, and one convention covers every reading in the course. A scale read by eye is uncertain by half its smallest division: ±0.05 cm³ on a burette marked every 0.10 cm³, ±0.5 °C on a thermometer marked every 1 °C, ±0.5 cm³ on a measuring cylinder marked every 1 cm³.
A digital instrument is uncertain by one in its last digit, because the display has already rounded and nothing finer can be read from it. A balance whose display steps in 0.01 g is uncertain by ±0.01 g; a digital thermometer reading to 0.1 °C, by ±0.1 °C. A value a question states overrides both rules: some questions give a two-decimal-place balance as ±0.005 g a reading, and then that is the value used.
Glassware with a single line works differently. A pipette or a volumetric flask has no scale to read. It is filled until the bottom of the meniscus sits on the line, and its uncertainty is the manufacturer's tolerance, printed on the glass. A 25 cm³ pipette of the usual school grade, class B, delivers 25.00 ± 0.06 cm³. A class B 250 cm³ volumetric flask holds 250.0 ± 0.3 cm³.
| Apparatus | Smallest division or digit | Uncertainty of one reading |
|---|---|---|
| Burette, 50 cm³ | 0.10 cm³, read by eye | ±0.05 cm³ |
| Pipette, 25 cm³, class B | One line | ±0.06 cm³ |
| Volumetric flask, 250 cm³, class B | One line | ±0.3 cm³ |
| Measuring cylinder, 100 cm³ | 1 cm³, read by eye | ±0.5 cm³ |
| Thermometer | 1 °C, read by eye | ±0.5 °C |
| Digital thermometer | 0.1 °C, displayed | ±0.1 °C |
| Balance, two decimal places | 0.01 g, displayed | ±0.01 g |
| Balance, three decimal places | 0.001 g, displayed | ±0.001 g |
- Resolution
- The smallest change in the quantity being measured that gives a change in the reading on the instrument.
- Uncertainty
- The interval within which the true value of a measurement can be expected to lie, written as ± a value in the unit of the measurement.
- Parallax error
- An error in reading a scale caused by viewing it from an angle instead of with the eye level with the mark or meniscus being read.
A difference of two readings
A titre is never read off the burette in one go. The burette is read before the titration starts and again at the end point, and the titre is the difference. Both readings carry ±0.05 cm³. In the worst case the two errors run in opposite directions, so the titre carries ±0.10 cm³.
The same rule applies wherever a measurement is the difference of two readings. Weighing by difference uses two balance readings, so a mass found on a two-decimal-place balance is uncertain by ±0.02 g. A temperature rise read from a thermometer to ±0.5 °C is uncertain by ±1.0 °C. Pressing the tare button does not escape this, because setting the zero is itself a reading. A pipette volume is different: the pipette is filled to one line and drained, so it is one measurement with one tolerance, ±0.06 cm³.
An absolute uncertainty alone says little about how good a measurement is. ±0.10 cm³ on a titre of 40 cm³ hardly matters; on a titre of 2 cm³ it is a twentieth of the answer. The percentage uncertainty sets the uncertainty against the size of the measurement.
percentage uncertainty = (absolute uncertainty ÷ measured value) × 100
- Percentage uncertainty
- The absolute uncertainty of a measurement divided by the measured value, multiplied by 100.
Two percentage uncertainties
A titre is 24.35 cm³, from a burette read to ±0.05 cm³. A crucible and its contents lose 0.42 g on heating, weighed on a balance that reads to 0.01 g. Calculate the percentage uncertainty in each measurement.
Show the working
The titre is the difference of two burette readings, so its absolute uncertainty is 2 × 0.05 = ±0.10 cm³.
Percentage uncertainty in the titre = (0.10 ÷ 24.35) × 100 = 0.41%.
The mass change is the difference of two balance readings, each ±0.01 g, so its absolute uncertainty is 2 × 0.01 = ±0.02 g.
Percentage uncertainty in the mass change = (0.02 ÷ 0.42) × 100 = 4.8%.
The mass loss is about twelve times less certain than the titre. The balance is the finer instrument, but 0.42 g is only 21 times its uncertainty, while 24.35 cm³ is over 240 times the burette's.
A percentage uncertainty is usually given to two significant figures. It is itself an estimate, and a third figure would claim a confidence the apparatus does not support.
Combining uncertainties and making them smaller
Most results in chemistry come from several measurements multiplied and divided together. A concentration found by titration uses a mass, the volume of a flask, the volume of a pipette and a titre. When measurements are multiplied or divided, their percentage uncertainties add to give the percentage uncertainty in the result. When measurements are added or subtracted, their absolute uncertainties add, which is the difference rule again.
Values from the data sheet, such as relative atomic masses, and the whole numbers in a balanced equation, such as the 2 in a 1 : 2 ratio, are treated as exact. They add nothing to the total.
The uncertainty in a titration result
A student weighs 2.35 g of anhydrous sodium carbonate by difference on a two-decimal-place balance, dissolves it, and makes the solution up to 250.0 cm³ in a volumetric flask (±0.3 cm³). A 25.0 cm³ pipette (±0.06 cm³) transfers portions of it to a conical flask, and the mean titre of hydrochloric acid is 23.80 cm³. The acid's concentration works out at 0.186 mol dm⁻³. Calculate the percentage uncertainty in that concentration, and give the result with its absolute uncertainty.
Show the working
List each measurement with its absolute uncertainty. Mass: two readings, ±0.02 g. Flask: one fill, ±0.3 cm³. Pipette: one fill, ±0.06 cm³. Titre: two readings, ±0.10 cm³.
Convert each to a percentage. Mass: 0.02 ÷ 2.35 × 100 = 0.85%. Flask: 0.3 ÷ 250.0 × 100 = 0.12%. Pipette: 0.06 ÷ 25.0 × 100 = 0.24%. Titre: 0.10 ÷ 23.80 × 100 = 0.42%.
The concentration is calculated by multiplying and dividing these four quantities, so the percentages add: 0.85 + 0.12 + 0.24 + 0.42 = 1.63%, which is 1.6% to two significant figures.
Absolute uncertainty = 1.63% of 0.186 = 0.0030 mol dm⁻³. The result is 0.186 ± 0.003 mol dm⁻³.
The mass and the titre together make up 1.27 of the 1.63%, nearly 80% of the total, so those are the two measurements worth improving. The flask contributes least.
Turning those four measurements into 0.186 mol dm⁻³ is a titration calculation. The uncertainty calculation does not need it: it needs only to know which measurements were multiplied or divided.
The absolute uncertainty of a reading is fixed by the apparatus. The percentage uncertainty is not, because it falls as the measurement gets bigger. One reading of 0.20 g on a balance that displays 0.01 g is uncertain by 5%; a reading of 2.00 g on the same balance, by 0.5%. A titre behaves alike, and a titration is designed to give a titre of more than about 20 cm³ from a 50 cm³ burette for that reason.
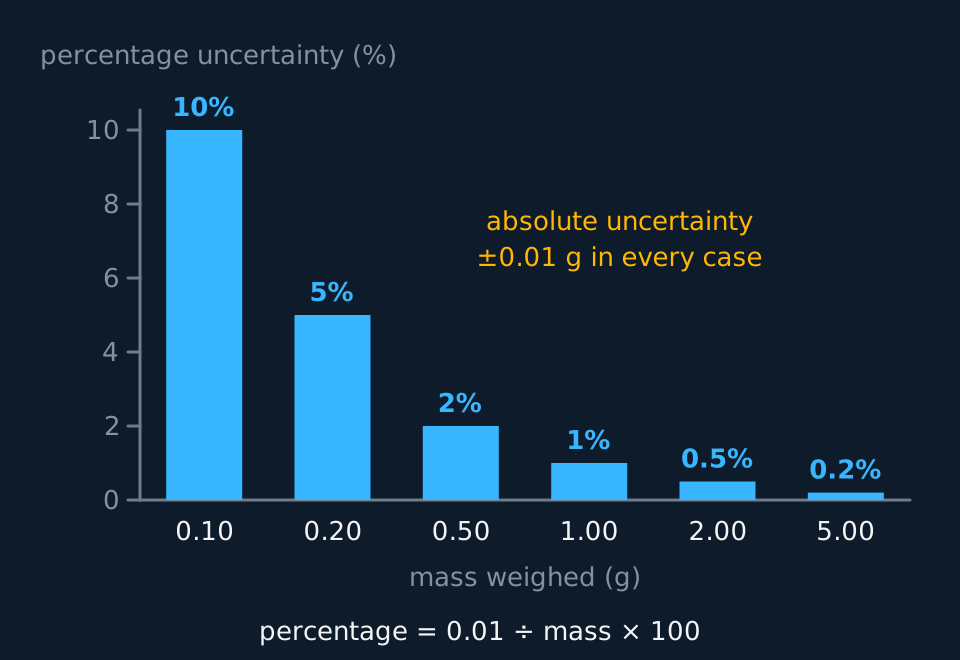
There are two ways to make a percentage uncertainty smaller. Measure a larger quantity: more solid, a more concentrated solution that gives a larger temperature rise, a more dilute titrant that gives a longer titre. Or use apparatus with a finer resolution: a three-decimal-place balance, a thermometer marked every 0.1 °C. Repeating a measurement and taking a mean reduces the effect of random error, but it leaves the uncertainty of each reading where it was.
TRY IT: A small temperature rise
In a calorimetry experiment the temperature rises from 19.5 °C to 25.5 °C, read on a thermometer marked every 1 °C. Calculate the percentage uncertainty in the temperature rise, and suggest two changes that would reduce it.
Check your answer
The rise is 25.5 − 19.5 = 6.0 °C. It is the difference of two readings, each ±0.5 °C, so its uncertainty is ±1.0 °C and the percentage uncertainty is 1.0 ÷ 6.0 × 100 = 17%.
A thermometer marked every 0.1 °C is read to ±0.05 °C, so the same rise would be uncertain by ±0.1 °C, which is 1.7%: a tenfold improvement from the apparatus alone.
Doubling the concentration of both reacting solutions, at the same volumes, releases twice the heat into the same mass of solution and roughly doubles the rise to about 12 °C. On the original thermometer the percentage uncertainty then falls to about 8%.
Accuracy, precision and error
Three titres of 23.80, 23.85 and 23.80 cm³ agree closely, but close agreement is not the same as being right. Agreement between repeats shows that results are precise. Closeness to the true value is accuracy, and a set of results can have either property without the other.
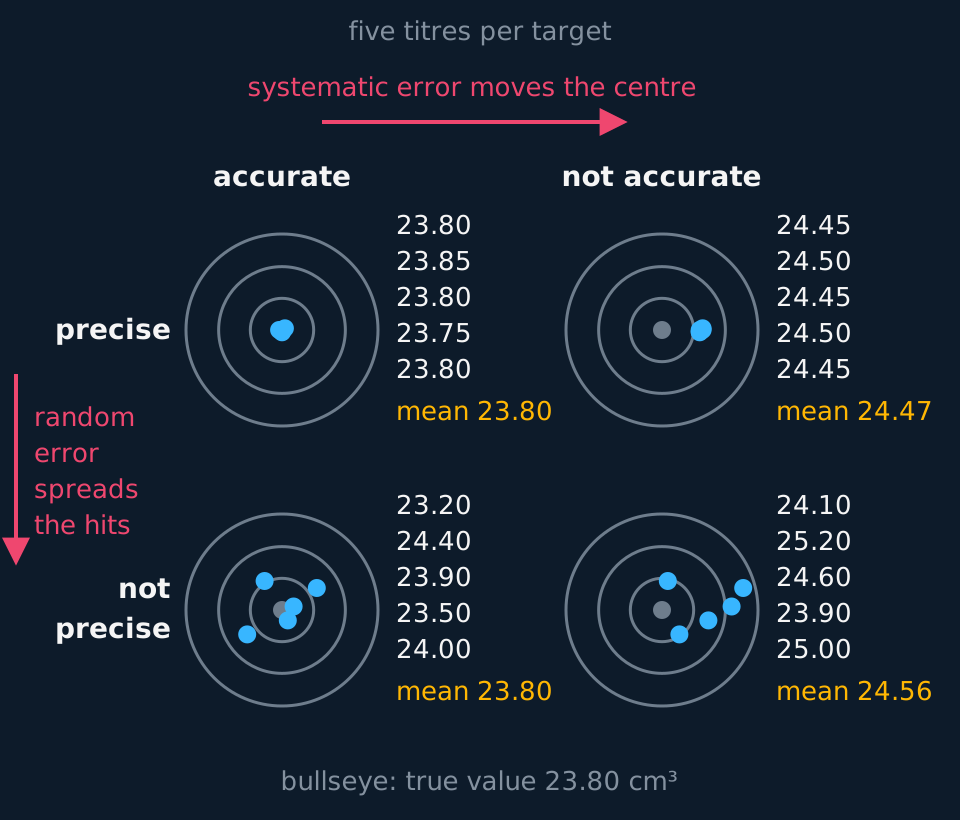
Describe the drawing
Four targets in a two by two grid, columns headed accurate and not accurate, rows precise and not precise, each with its five titres listed beside it for a true value of 23.80 cm³. Top left: hits tight on the bullseye. Top right: hits tight but off-centre, mean 24.47. Bottom left: hits scattered but centred, mean 23.80. Bottom right: scattered and off-centre. Arrows show systematic error moving the centre across the columns and random error spreading the hits down the rows.
Behind the two words are two kinds of error. A random error makes repeated readings scatter unpredictably on both sides of the true value: judging the drop at which phenolphthalein turns colourless, reading a meniscus slightly high one time and slightly low the next, a draught cooling a calorimeter more in one run than another. Random errors lower precision. Repeating and calculating a mean reduces their effect, because the highs and lows partly cancel.
A systematic error shifts every reading in the same direction by a similar amount. A burette rinsed with water instead of the solution it will hold dilutes that solution, so every titre comes out too large. A balance that does not read zero when empty adds the same amount to every mass read straight off it, although weighing by difference cancels it. Heat lost from an unlidded calorimeter makes every temperature rise too small. Repeats cannot reveal a systematic error, because every repeat carries it. It is found by checking against a known value or by changing the method, and removed by fixing the cause.
In a titration, results are concordant when they agree within 0.10 cm³ of each other, and the mean titre is calculated from concordant results only. The first, rough titre, run quickly to find roughly where the end point is, is left out.
A titre that disagrees with the rest by well over 0.10 cm³ is an anomalous result. It usually has a cause that can be named: the end point overshot by a few drops, an air bubble leaving the burette tip, a conical flask not rinsed out. It is left out of the mean, the titration is repeated until enough titres agree, and the record says which titre was left out and why.
Choosing the titres for a mean
A student records a rough titre of 25.10 cm³, then accurate titres of 24.30, 24.65, 24.35 and 24.30 cm³. Calculate the mean titre.
Show the working
The rough titre is left out. It was run quickly to locate the end point and overshoots it.
24.30, 24.35 and 24.30 cm³ all lie within 0.10 cm³ of one another, so they are concordant. 24.65 cm³ is 0.30 cm³ above the nearest of them, so it is anomalous and left out.
Mean titre = (24.30 + 24.35 + 24.30) ÷ 3 = 24.3167 cm³, given to two decimal places as 24.32 cm³.
The mean is calculated, not read off the burette, so the rule that a reading ends in 0 or 5 does not apply to it. Its uncertainty is taken as that of one titre, ±0.10 cm³.
Comparing a result with an accepted value is the test for systematic error. Express the difference as a percentage of the accepted value and set it beside the total percentage uncertainty. If the difference is the larger, the resolution of the apparatus cannot account for it, and a systematic error in the method is likely.
- Accuracy
- A measurement or result is accurate when it is close to the true value.
- Precision
- Results are precise when repeated measurements are close to one another, with little spread about the mean.
- Random error
- An error that makes repeated readings scatter unpredictably on both sides of the true value; its effect is reduced by repeating the measurement and taking a mean.
- Systematic error
- An error that shifts every reading from the true value in the same direction by a similar amount; repeating the measurement neither reveals it nor reduces it.
- Concordant results
- Titres that agree within 0.10 cm³ of each other, from which the mean titre is calculated.
- Anomalous result
- A result that does not fit the pattern of the others, such as a titre outside the concordant set, and is left out of the mean.
Maths for chemistry
A calculator gives 0.186301 for the concentration in the titration example. Its data were 2.35 g, 23.80 cm³ and 25.0 cm³: three, four and three significant figures. A result cannot be more precise than the least precise measurement that went into it, so the answer is 0.186 mol dm⁻³. Keep every figure in the calculator and round once, at the end; a value rounded at each line can come out wrong in its last figure. A result quoted with its uncertainty stops at the uncertainty's decimal place: 0.186 ± 0.003 mol dm⁻³.
Standard form writes a number as one between 1 and 10 times a power of ten, and settles how many figures are significant: 2.30 × 10⁻³ mol has three, 2.3 × 10⁻³ mol two. Zeros at the front of a decimal never count, so 0.0023 has two. Rearranging does the same operation to both sides until the wanted quantity stands alone: c = n ÷ V, multiplied by V on both sides, gives n = c × V. Rearrange first, then substitute, so each line can be checked.
Units are converted before they are combined. Divide a volume in cm³ by 1000 for dm³, because 1 dm³ = 1000 cm³: 25.0 cm³ is 0.0250 dm³. Multiply an energy in kJ by 1000 for J wherever it meets R = 8.31 J K⁻¹ mol⁻¹, and add 273 to a Celsius temperature for kelvin.
A logarithm squeezes many powers of ten onto a short scale. pH = −log₁₀[H⁺], so [H⁺] is 10 raised to the power −pH: at pH 3.40, [H⁺] = 10⁻³·⁴⁰ = 3.98 × 10⁻⁴ mol dm⁻³. The natural logarithm, ln, uses the base e = 2.718 in place of 10, and it turns the Arrhenius equation, k = Ae^(−Ea/RT), into ln k = ln A − Ea/RT.
That form is a straight line, y = mx + c, with m the gradient and c the intercept on the y axis. Plotting ln k against 1/T gives a gradient of −Ea/R and an intercept of ln A. The gradient is read from two points far apart on the line of best fit, not from two data points, as the change in y divided by the change in x, with its unit.
| Point read from the line | 1/T / K⁻¹ | ln k |
|---|---|---|
| First | 3.100 × 10⁻³ | −4.20 |
| Second | 3.500 × 10⁻³ | −10.20 |
Activation energy from a gradient
A graph of ln k against 1/T for a reaction is a straight line, and two points read from it are in the table. Calculate the activation energy, Ea, in kJ mol⁻¹. R = 8.31 J K⁻¹ mol⁻¹.
Show the working
Gradient = change in ln k ÷ change in 1/T = (−10.20 − (−4.20)) ÷ (3.500 × 10⁻³ − 3.100 × 10⁻³) = −6.00 ÷ (4.00 × 10⁻⁴) = −1.50 × 10⁴ K. ln k has no unit and 1/T is in K⁻¹, so the gradient is in K.
In the form y = mx + c, ln k = −(Ea/R) × (1/T) + ln A, so the gradient is −Ea/R. Rearranged, Ea = −gradient × R.
Ea = 1.50 × 10⁴ K × 8.31 J K⁻¹ mol⁻¹ = 1.2465 × 10⁵ J mol⁻¹.
Dividing by 1000 to convert J to kJ gives Ea = 125 kJ mol⁻¹ to three significant figures. A negative gradient gives a positive activation energy, as it must.
Other boards: percentage error
Cambridge mark schemes often call (uncertainty ÷ measured value) × 100 the percentage error. The calculation is the one taught here as a percentage uncertainty, and Paper 5 asks for it when a plan or a set of results is evaluated. Read the question for which meaning is wanted: a percentage error can also mean the difference between a result and a data-book value, as a percentage of that value.
The practical guides of the four boards do not all treat a digital balance alike. Some take half the last digit, ±0.005 g on a two-decimal-place balance, where one in the last digit gives ±0.01 g. A question that depends on the difference states its value, and the stated value is the one to use.
In the exam
- For a titre or a mass by difference, the scheme awards the uncertainty mark only when one reading's uncertainty is doubled: ±0.10 cm³ for a titre, ±0.02 g for a mass on a balance that displays 0.01 g, unless the question states another value.
- 'Repeat the experiment' is not credited on a question about reducing a percentage uncertainty. The scheme accepts a larger mass or volume on the same apparatus, or apparatus with a finer resolution.
- A mean titre is calculated from concordant titres only. A mean that includes the rough titre, or an anomalous one, is not awarded the mark even when the arithmetic is right.
- An evaluation of a result against an accepted value earns its marks for three things: the percentage difference, its comparison with the total percentage uncertainty, and a named systematic error that would push the result in the observed direction.
- Give a calculated answer to the number of significant figures in the least precise data, with its unit. A gradient read from a graph needs its unit too, which is the unit of y divided by the unit of x.
Check yourself
A student titrates 25.0 cm³ portions of a sodium hydroxide solution labelled 0.100 mol dm⁻³ against standard hydrochloric acid, and from three concordant titres finds its concentration to be 0.0962 mol dm⁻³. The total percentage uncertainty in her measurements is 1.1%. Evaluate whether the difference from the label can be explained by the uncertainty of the apparatus.
Answer
The difference is 0.100 − 0.0962 = 0.0038 mol dm⁻³, which is 0.0038 ÷ 0.100 × 100 = 3.8% of the labelled value.
The apparatus accounts for 1.1%. The result is more than three times further from the label than that, so the resolution of the glassware and balance cannot explain it, and a systematic error is likely, in the method or in one of the solutions.
Concordant titres show only that whatever went wrong went wrong the same way each time. One cause that fits: the pipette was rinsed with water and not with the alkali, so each portion was diluted, held less sodium hydroxide, and needed a smaller titre. Another: the acid was more concentrated than its label stated, which also makes every titre too small. Both lower the calculated concentration, and neither shows up as scatter.
Questions
Question 16 marks
Evaluate, in terms of accuracy and precision, the results of two students who titrate portions of the same solution, and suggest the kind of error each set shows. Their accurate titres are given in the table; an experienced analyst using the same solutions finds the true titre to be 23.95 cm³.
| Student | Titre 1 / cm³ | Titre 2 / cm³ | Titre 3 / cm³ |
|---|---|---|---|
| A | 24.10 | 24.15 | 24.10 |
| B | 23.60 | 24.40 | 23.90 |
Mark scheme
Indicative content
- student A's titres all agree within 0.10 cm³ of one another, so they are concordant and A's results are precise
- A's mean titre is 24.12 cm³, 0.17 cm³ above the true value and outside the ±0.10 cm³ of a titre, so A's results are not accurate
- A's results show a systematic error that moved every titre up by a similar amount, such as a burette rinsed with water that diluted the titrant
- student B's titres spread over 0.80 cm³ and no two agree within 0.10 cm³, so B's results are not precise and none are concordant
- B's mean of 23.97 cm³ lies close to the true value only by chance, because a mean of scattered, non-concordant titres cannot be relied on
- B's results show random error, such as judging the end point inconsistently or reading the meniscus from different heights; B should repeat until titres agree
Levels
- Level 3 (5–6 marks) both students are judged on both accuracy and precision against the true titre, with the concordance and the means used as evidence, the kind of error each set shows is named with a plausible cause, and the answer says what each student should do; precision and accuracy are kept apart throughout
- Level 2 (3–4 marks) both sets are correctly called precise or accurate and one kind of error is named with a cause; the other kind is not identified, or the means are never set against 23.95 cm³
- Level 1 (1–2 marks) one student's results are called accurate because they are close together, with precision and accuracy swapped and no kind of error named
Question 24 marks
Calculate the titre and its percentage uncertainty when a student's initial burette reading is 1.20 cm³ and her final reading is 23.70 cm³, each reading being uncertain by ±0.05 cm³.
Mark scheme
- M1 titre = 23.70 − 1.20 = 22.50 cm³
- M1 the titre is the difference of two readings, so its uncertainty is 2 × 0.05 = ±0.10 cm³
- M1 percentage uncertainty = 0.10 ÷ 22.50 × 100; error carried forward from an undoubled ±0.05 cm³
- A1 percentage uncertainty = 0.44%; allow 0.444%
Question 34 marks
Calculate the total percentage uncertainty in a concentration of 0.0915 mol dm⁻³, found by multiplying and dividing the three measurements given in the table, and give the concentration with its absolute uncertainty.
| Measurement | Value | Uncertainty |
|---|---|---|
| Pipette volume | 25.0 cm³ | ±0.06 cm³ |
| Mean titre | 18.20 cm³ | ±0.10 cm³ |
| Volumetric flask | 250.0 cm³ | ±0.3 cm³ |
Mark scheme
- M1 the separate percentage uncertainties are 0.24% for the pipette, 0.55% for the titre and 0.12% for the flask
- M1 the quantities are multiplied and divided, so the percentage uncertainties are added, giving 0.91%
- M1 absolute uncertainty = 0.91% of 0.0915 = 0.00083 mol dm⁻³; error carried forward from the total percentage
- A1 0.0915 ± 0.0008 mol dm⁻³, the uncertainty to one significant figure
All 19 questions with mark schemes, the other 16 set out in full on the question page.
Worth remembering
- Double the reading uncertainty for a titre or a mass by difference: ±0.10 cm³ for a titre, ±0.02 g for a mass on a balance reading to 0.01 g.
- Divide by the measurement, not by the capacity: ±0.10 cm³ on a titre of 24.35 cm³, not on a 50 cm³ burette.
- Adding the absolute uncertainties of a mass and a volume is meaningless; multiplied or divided quantities add their percentages.
- 'Repeat and take a mean' never shrinks the uncertainty of one reading and never removes a systematic error.
- A result rounded at each line, or given to more figures than the least precise data, misses the answer mark.
CHECK YOUR PROGRESS
Rate how confident you are with each objective for this lesson. Ratings are saved in this browser, on this device, unless you sign in.
- State the uncertainty of a single reading on a burette, a pipette, a balance and a thermometer, and explain why a difference of two readings carries twice that.
- Calculate a percentage uncertainty, and combine percentage uncertainties for a result calculated from several measurements.
- Suggest how to reduce the percentage uncertainty of a measurement by changing the quantity measured or the apparatus.
- Give a calculated answer to the number of significant figures the data justify.
- Distinguish accuracy from precision, and random error from systematic error, with an example of each from a titration.
- Rearrange an equation, convert units, use logarithms, and find a gradient and intercept from a straight-line graph.
Open the full revision checklist to see every objective in the curriculum in one place.
Practise this lesson
WORKBOOK
The written questions from this topic, on paper with room to work, and a separate book of mark schemes. The 4 questions that are set on a diagram stay on this page, where the diagram can be drawn. Free to use; please do not redistribute or sell.
Used later in Concentration, volumetric solutions and titration calculations · Measuring an enthalpy change: calorimetry · Measuring the rate of a reaction