Chemistry › Kinetics › The Maxwell–Boltzmann distribution, temperature and catalysts
The Maxwell–Boltzmann distribution, temperature and catalysts
The molecules in a gas do not share one energy. A few are almost still, most have middling energies, and a very few have a great deal. The Maxwell–Boltzmann distribution draws that spread, and the area beyond the activation energy counts the molecules able to react. Warming the gas stretches the curve past Ea, so ten degrees can double a rate; a catalyst leaves the curve alone and moves Ea.
Key terms Every definition in kinetics, lesson by lesson
Before this Collision theory, activation energy and the rate of reaction – a successful collision needs at least Ea and the right orientation · Enthalpy change, standard conditions and the definitions – reading an enthalpy profile
COMMON MISCONCEPTION
Heating a reaction speeds it up because the molecules move faster and so collide more often.
A 10 °C rise makes molecules collide only about 2% more often, but roughly doubles the rate. What changes is the energy distribution: the curve flattens and spreads to the right, so the fraction of molecules with at least the activation energy rises sharply, and a larger proportion of collisions succeed.
What you should be able to do
- Sketch the Maxwell–Boltzmann distribution correctly, marking the most probable energy, the mean energy and the activation energy.
- State what the area under the curve, and the area beyond Ea, represent.
- Sketch the distribution at a higher temperature on the same axes, and explain why a small rise in temperature gives a large rise in rate.
- Explain how a catalyst increases a rate, using an enthalpy profile and the distribution with two activation energies marked.
- Compare the effects of a rise in temperature and of a catalyst, and explain why industry uses catalysts.
A spread of energies
The molecules of a gas at one temperature do not all have one energy. In the air inside a bicycle tyre each molecule is struck by others billions of times a second, and every collision passes energy from one molecule to another. At any instant a few molecules have just been brought almost to a stop, most are moving at middling speeds, and a very few have been struck several times in a row from behind and are moving very fast. The temperature fixes the average. It does not fix the energy of any one molecule.
The Maxwell–Boltzmann distribution is the graph of that spread. Kinetic energy runs along the horizontal axis, and the vertical axis is the number of molecules with each energy.
The curve has a shape to learn. It starts at the origin, because no molecule has zero energy. It rises steeply to a single peak, then falls away more slowly in a long tail to the right. The tail comes closer and closer to the energy axis without ever reaching it: there is no maximum energy, only energies that fewer and fewer molecules have. A curve that meets the axis on the right, or turns back up, is drawn wrongly.
The peak is at the most probable energy, the energy more molecules have than any other. The mean energy lies to the right of the peak, because the long tail of fast molecules pulls the average up. A label 'average energy' on the peak is therefore wrong.
The area under the whole curve is the total number of molecules in the sample. The area under the part of the curve to the right of the activation energy is the number of molecules with at least that energy, the ones able to react if they collide in the right orientation. For most reactions at room temperature Ea lies far out in the tail, and that area is a thin sliver of the whole.
- Maxwell–Boltzmann distribution
- The distribution of the energies of the molecules in a gas at a given temperature, shown as the number of molecules with each energy.
- Most probable energy
- The energy at the peak of the Maxwell–Boltzmann distribution, the energy possessed by the greatest number of molecules.
- Mean energy
- The average energy of the molecules, which lies to the right of the most probable energy because the distribution is not symmetrical.
Raising the temperature
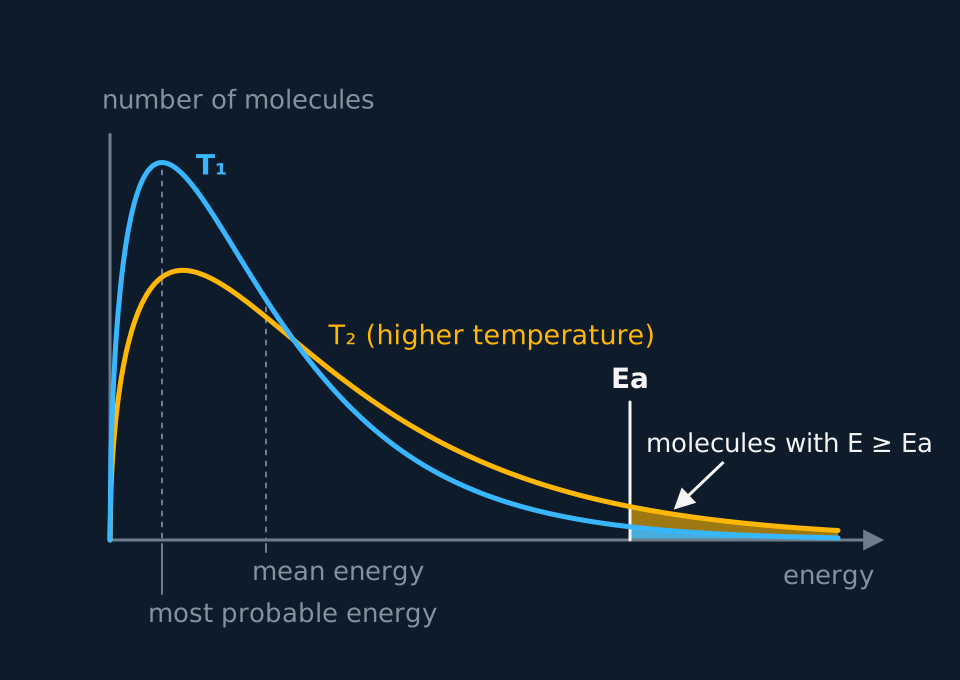
At a higher temperature the molecules have more energy on average, and the curve changes in three ways. The peak moves to the right, to a higher most probable energy. The peak is lower. And the curve is broader, with more of it in the tail. The number of molecules has not changed, so the area under the new curve equals the area under the old; a peak drawn further right but just as high would have added molecules.
Describe the drawing
Two Maxwell–Boltzmann curves on axes of number of molecules against energy, both starting at the origin. The cyan curve for the lower temperature T₁ rises to a tall peak near the left and falls into a long tail; the amber curve for the higher temperature T₂ peaks lower and further right and is broader, crossing the first curve once and staying above it at high energy. Neither tail reaches the energy axis. A vertical line marks the activation energy, and the area beyond it is shaded for each curve, the amber area visibly larger than the cyan one. Dashed drop lines mark the most probable energy and the mean energy of T₁.

Describe the drawing
The Maxwell–Boltzmann distribution animated through three rising temperatures on fixed axes of number of molecules against energy, with a vertical activation-energy line far out in the tail. At T₁ a tall cyan peak sits near the left and 1.9 percent of the area lies beyond Ea. At 1.2 T₁ the amber curve peaks lower and further right and the shaded tail beyond Ea grows to 4.0 percent; at 1.4 T₁ the coral curve is lower and broader again with 6.7 percent beyond Ea. The last frame overlays all three, each enclosing the same area, and the earlier curves are left as grey dashes while the next one is drawn.
With the activation energy marked on the same axes, the higher-temperature curve lies above the lower one beyond it, so the area to the right of Ea, the number of molecules with enough energy to react, is larger. More collisions have at least the activation energy, so more of them succeed each second, and the rate rises.
There is a second, smaller effect. Faster molecules also collide more often. But the collision frequency rises only with the square root of the absolute temperature, so going from 298 K to 308 K raises it by less than 2%. The rate of a typical reaction nearly doubles over the same ten degrees. Almost all of that increase comes from the larger number of collisions with at least Ea, and that is the point the mark scheme credits first.
A small rise in temperature has a large effect because of where Ea sits. Near the peak, warming the gas moves a modest share of the molecules from one energy to another. Far out in the tail, where Ea usually lies, the number of molecules falls so steeply with energy that a slight stretch of the curve to the right can double the area beyond Ea. The further out Ea lies, the more a given rise in temperature multiplies that area.
- Activation energy
- The minimum energy that colliding particles must have for a reaction to take place.
Sketching the distribution at two temperatures, mark by mark
Sketch the Maxwell–Boltzmann distribution for a sample of gas at 300 K and, on the same axes, for the same sample at 350 K. Mark the activation energy, and use the sketch to explain why the reaction is faster at 350 K.
Show the working
The axes come first. The vertical axis is labelled number of molecules and the horizontal axis energy; no units or scale are needed. 'Speed', 'rate' or 'temperature' on an axis is not accepted.
The 300 K curve starts at the origin, because no molecule has zero energy, rises to a single peak and falls in a long tail. The tail approaches the energy axis without touching or crossing it, because there is no maximum energy.
The 350 K curve also starts at the origin. Its peak lies to the right of the 300 K peak, at a higher most probable energy, and is lower, because the same molecules are spread over a wider range of energies.
The curves cross once, to the right of the 300 K peak. Beyond that point the 350 K curve lies above the 300 K curve all the way along the tail, and its tail also stays above the axis.
The two areas are equal, since heating does not change the number of molecules. A hotter curve drawn as tall as the cooler one, or enclosing visibly more area, is marked wrong.
Ea is one vertical line far out in the tail, to the right of both peaks. The area beyond it under the 350 K curve is the larger, so more molecules have at least the activation energy, a greater proportion of collisions succeed, and there are more successful collisions per unit time.
Catalysts
A catalyst increases the rate of a reaction without being changed in chemical composition or amount at the end. Manganese(IV) oxide shows both halves of that: a spatula of the black solid makes hydrogen peroxide solution froth within seconds, and once the fizzing stops the solid can be filtered off, dried and weighed at its starting mass.
2H₂O₂(aq) → 2H₂O(l) + O₂(g)Catalysed by manganese(IV) oxide, by iodide ions and by the enzyme catalase. ΔH = −98 kJ per mole of H₂O₂ by every route.
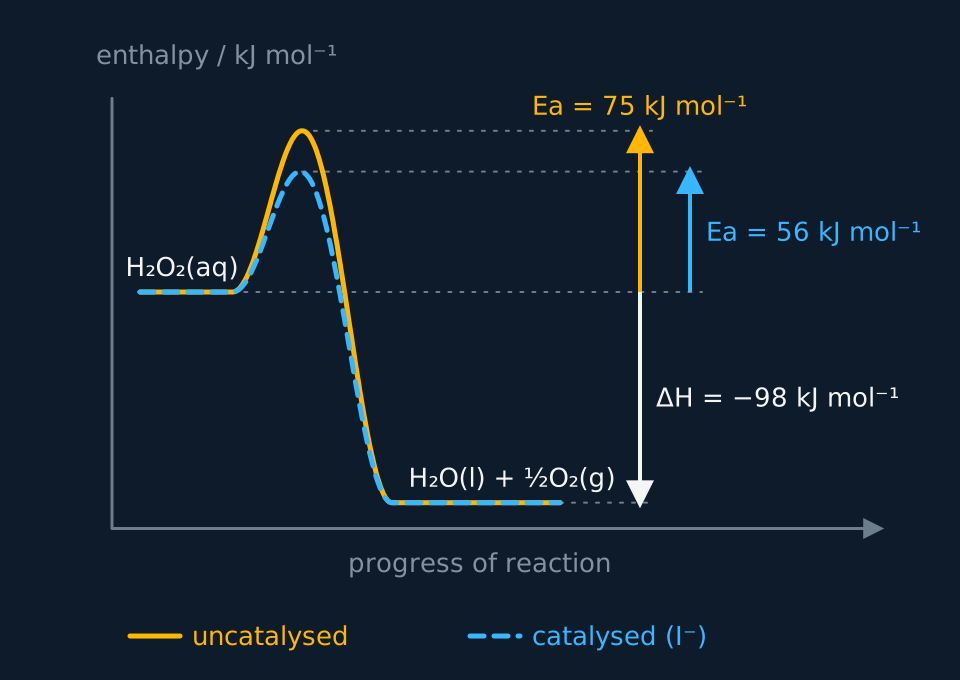
A catalyst works by providing an alternative reaction route with a lower activation energy. The reactants and products are the same, so ΔH is the same; only the barrier between them is lower. A catalyst cannot make more product than the reaction would have made. It lowers the barrier for the reverse reaction by the same amount, so it does not move the position of an equilibrium either: it brings the mixture to equilibrium sooner.
Describe the drawing
An enthalpy profile for hydrogen peroxide decomposing to water and oxygen. Both routes start on the same reactant line and finish on the same product line 98 kilojoules per mole lower. The solid amber uncatalysed route climbs to a peak 75 above the reactants; the dashed cyan route catalysed by iodide climbs to a lower peak only 56 above them. Arrows on the right measure the two activation energies upward from the reactant line and one shared enthalpy change downward.

Describe the drawing
An enthalpy profile for hydrogen peroxide decomposing to water and oxygen, built up in four stages. First the solid amber uncatalysed route climbs to a peak 75 kilojoules per mole above the reactants, with its activation energy arrow. Then a dashed cyan catalysed route appears beneath it between the same reactant and product levels. Then the catalysed activation energy arrow is drawn, 56 kilojoules per mole. Finally one downward arrow marks the enthalpy change of minus 98 kilojoules per mole, the same on both routes.
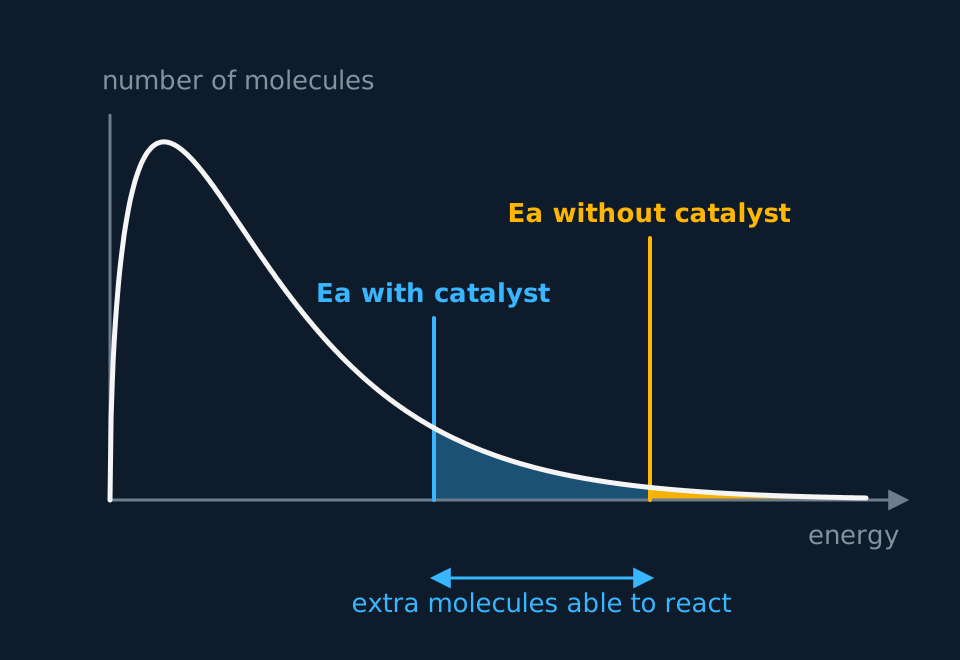
The catalyst gives no molecule any extra energy, so on the Maxwell–Boltzmann distribution the curve does not move at all. What moves is the activation energy, to the left. The area beyond the new, lower Ea is much larger than the area beyond the old one, so a much larger proportion of collisions have enough energy to react, and the rate rises.
Describe the drawing
A single Maxwell–Boltzmann curve of number of molecules against energy, rising from the origin to a peak and falling into a long tail that never meets the axis. Two vertical lines cross the tail: the amber activation energy without a catalyst far out to the right, and the cyan activation energy with a catalyst further left. The area beyond the catalysed line is shaded lightly and the much smaller area beyond the uncatalysed line more darkly; a bracket under the axis between the two lines marks the extra molecules able to react.
The effect is large because the number of molecules falls so steeply along the tail. Iodide ions lower the activation energy for the decomposition of hydrogen peroxide from about 75 kJ mol⁻¹ to about 56 kJ mol⁻¹. At room temperature that cut of a quarter raises the number of collisions with enough energy about two thousand times. Matching it without the catalyst would take a temperature of about 126 °C, above the boiling point of the solution.
Temperature and a catalyst both increase the number of collisions with at least the activation energy, by different routes. Heating changes the curve and leaves Ea where it was. A catalyst leaves the curve where it was and moves Ea. Draw them that way: one diagram with two curves and one Ea, the other with one curve and two values of Ea.
| Raising the temperature | Adding a catalyst | |
|---|---|---|
| Maxwell–Boltzmann curve | Peak lower and further right, same area | Unchanged |
| Activation energy | Unchanged | Lower, by an alternative route |
| Molecules with at least Ea | More | More |
| Collision frequency | Slightly higher | Unchanged |
| ΔH | Unchanged | Unchanged |
| Drawn as | Two curves, one Ea | One curve, two values of Ea |
Catalysts are also classed by phase. A heterogeneous catalyst is in a different phase from the reactants, as solid iron is with the nitrogen and hydrogen of the Haber process, and a homogeneous catalyst is in the same phase, as dissolved iodide ions are with hydrogen peroxide solution.
Catalysts matter to industry because a lower activation energy lets a reaction go at a useful rate at a lower temperature. That saves the fuel burnt to heat the plant and the carbon dioxide the burning releases, and for an exothermic equilibrium it raises the yield as well. In an answer, name both: less energy used, and, where the reaction is an exothermic equilibrium, a better yield.
- Catalyst
- A substance that increases the rate of a reaction without being changed in chemical composition or amount, by providing an alternative reaction route with a lower activation energy.
- Heterogeneous catalyst
- A catalyst in a different phase from the reactants, such as solid iron in the Haber process.
- Homogeneous catalyst
- A catalyst in the same phase as the reactants, such as iodide ions dissolved with hydrogen peroxide.
TRY IT: Heat it or catalyse it
A reaction between two gases is too slow at 300 K. One engineer proposes running it at 320 K. Another proposes adding a solid catalyst and staying at 300 K. Use the Maxwell–Boltzmann distribution to explain how each proposal increases the rate, and suggest one reason the plant might prefer the catalyst.
Check your answer
At 320 K the distribution moves: the peak shifts to higher energy and drops, and the curve spreads into the tail. Ea stays where it was, but the area beyond it grows, so more collisions have at least Ea and the rate rises. The molecules also collide slightly more often.
With the catalyst the distribution is unchanged, because the temperature is unchanged. The reaction takes a route with a lower Ea, and the area beyond that lower value is far larger, so a much greater proportion of collisions succeed.
The catalyst saves the fuel needed to heat the gases to 320 K, and the carbon dioxide released in burning it. If the reaction is exothermic and reversible, the lower temperature also gives a higher equilibrium yield. Against that, the catalyst costs money and can be poisoned.
Other boards: the Boltzmann distribution and sustainability
OCR and Cambridge call the curve the Boltzmann distribution. It is drawn, labelled and marked in the same way, and an answer on those papers can use either name.
OCR's statement on catalysts and sustainability credits two gains from a catalyst: less energy used at a lower temperature, and reactions with a better atom economy and less waste. Ethanoic acid is one example. It is now made by combining methanol with carbon monoxide, with a rhodium or iridium compound dissolved in the mixture as a homogeneous catalyst, and every atom of the reactants ends up in the product.
CH₃OH(l) + CO(g) → CH₃COOH(l)Carbonylation of methanol, catalysed by a rhodium or iridium complex with iodide. One product, so the atom economy is 100%.
The older route, oxidising hydrocarbons from crude oil, gave a mixture of by-products to separate and dispose of. An OCR answer on sustainability names the atom economy and the lower energy demand together.
In the exam
- A sketch is marked on the axes (number of molecules, energy), a start at the origin, a tail that stays above the axis, and, for a hotter curve, a peak that is lower and further right. A tail that touches the axis loses that mark.
- For the effect of temperature, the scheme awards the first mark for more molecules having energy at least equal to Ea. 'Collisions are more frequent' is true but is the smaller effect, and is not credited on its own.
- For a catalyst the scheme accepts 'provides an alternative route with a lower activation energy'. 'Gives the molecules energy' or 'lowers the energy needed' with no route is rejected.
- A catalyst diagram earns its mark with one curve and two values of Ea. Drawing a second curve says the catalyst changed the molecules' energies, and is not accepted.
- Where industry is asked about, give both benefits of a catalyst, less energy and, for an exothermic equilibrium, a higher yield; 'cheaper' alone does not answer.
Check yourself
A student draws the Maxwell–Boltzmann distribution for a gas at 400 K, then draws the curve for 500 K on the same axes with its peak further to the right and exactly as high as the first. Explain what is wrong with the second curve, describe the correct one, and explain why the rate is greater at 500 K.
Answer
The area under each curve is the number of molecules, and heating the gas does not change that number. A curve just as high but spread further to the right encloses a larger area, so it shows more molecules than the gas has.
The correct 500 K curve starts at the origin, has its peak further to the right and lower than the 400 K peak, and lies above the 400 K curve at high energies, approaching the axis more slowly. The two areas are equal.
Beyond Ea the 500 K curve lies above the 400 K curve, so more molecules have at least the activation energy. A greater proportion of collisions are successful, so there are more successful collisions per second and the rate is greater.
Questions
Question 16 marks
Discuss the advantages and disadvantages, to a company making a product by an exothermic reversible reaction between gases, of using a heterogeneous catalyst rather than a higher temperature to obtain a useful rate.
Mark scheme
Indicative content
- a catalyst provides a route with a lower activation energy, so a useful rate is reached at a lower temperature
- less fuel is burnt to heat the plant, which lowers the energy cost and the carbon dioxide released
- the reaction is exothermic, so a lower temperature gives a higher equilibrium yield, while a catalyst does not change the position of equilibrium
- the catalyst is not used up, and as a solid it stays in the reactor and does not need separating from the products
- against that, the catalyst costs money and must be replaced, and impurities in the feed can poison its surface
- on balance a catalyst is preferred where the saving in energy and the gain in yield outweigh its cost, as in the Haber process, where iron gives a useful rate at about 450 °C
Levels
- Level 3 (5–6 marks) the advantages of the catalyst over a higher temperature are all explained, the lower activation energy, the saving in fuel and carbon dioxide, and the higher equilibrium yield of the exothermic reaction, together with its ease of separation and the disadvantages of cost and poisoning, ending with a justified conclusion
- Level 2 (3–4 marks) the lower activation energy and the energy saving are explained and one drawback is given; the higher equilibrium yield for an exothermic reaction, or the conclusion, is not there
- Level 1 (1–2 marks) the catalyst is said to lower the activation energy or save energy, often with the claim that it also shifts the equilibrium to the right
Question 25 marks
Draw a Maxwell–Boltzmann distribution for a sample of gas, labelling both axes. Mark the most probable energy, the mean energy and an activation energy, Ea, and shade the area that represents the molecules able to react.
Mark scheme
- B1 axes labelled number of molecules, vertical, and energy, horizontal; ignore units
- B1 the curve starts at the origin, rises to a single peak and falls in a long tail to the right
- B1 the tail approaches the energy axis but does not touch or cross it; a tail that meets the axis loses this mark
- B1 the most probable energy is marked at the peak and the mean energy to the right of the peak
- B1 Ea is marked well to the right of the peak, with the area under the curve beyond it shaded
Question 35 marks
Draw an enthalpy profile for an exothermic reaction with and without a catalyst, labelling the activation energy of each route and ΔH, and explain why the catalyst does not change the equilibrium yield of a reversible reaction.
Mark scheme
- B1 axes labelled enthalpy and progress of reaction, with the product level below the reactant level
- B1 two humps between the same reactant and product levels, the catalysed one lower
- B1 the activation energy of each route drawn from the reactant level to the top of its own peak
- B1 a single ΔH arrow from the reactants to the products, the same for both routes
- B1 the catalyst lowers the activation energy of the forward and reverse reactions equally, so the position of equilibrium is unchanged and is only reached sooner
All 17 questions with mark schemes, the other 14 set out in full on the question page.
Worth remembering
- An axis labelled 'speed', 'rate' or 'temperature', or a tail that lands on the axis, loses the sketch mark.
- 'Average energy' written at the peak is wrong: the mean lies to the right of the most probable energy.
- A hotter curve drawn as tall as the cooler one shows extra molecules; the peak must be lower as well as further right.
- Draw one curve on a catalyst diagram and mark two values of Ea; a second curve says the catalyst changed the molecules' energies.
- Give the first temperature mark to more molecules with at least Ea; more frequent collisions are true but the smaller effect.
CHECK YOUR PROGRESS
Rate how confident you are with each objective for this lesson. Ratings are saved in this browser, on this device, unless you sign in.
- Sketch the Maxwell–Boltzmann distribution correctly, marking the most probable energy, the mean energy and the activation energy.
- State what the area under the curve, and the area beyond Ea, represent.
- Sketch the distribution at a higher temperature on the same axes, and explain why a small rise in temperature gives a large rise in rate.
- Explain how a catalyst increases a rate, using an enthalpy profile and the distribution with two activation energies marked.
- Compare the effects of a rise in temperature and of a catalyst, and explain why industry uses catalysts.
Open the full revision checklist to see every objective in the curriculum in one place.
Practise this lesson
WORKBOOK
The written questions from this topic, on paper with room to work, and a separate book of mark schemes. The 2 questions that are set on a diagram stay on this page, where the diagram can be drawn. Free to use; please do not redistribute or sell.
Used later in Dynamic equilibrium, Le Chatelier's principle and industrial compromise · The Arrhenius equation and the rate-determining step · Catalysis: heterogeneous, homogeneous and autocatalytic